Latest Articles
- Jun 3, 2026|Gabbie Rhodes|8 min read
Hiring a skilled geoscientist or engineer is the first step to strengthening your team. The next is training new employees for success.

Trending articles
- By Jessica Johnson
- By Gabbie Rhodes
- By Gabbie Rhodes
- By Gabbie Rhodes
- May 20, 2026|Gabbie Rhodes|14 min read
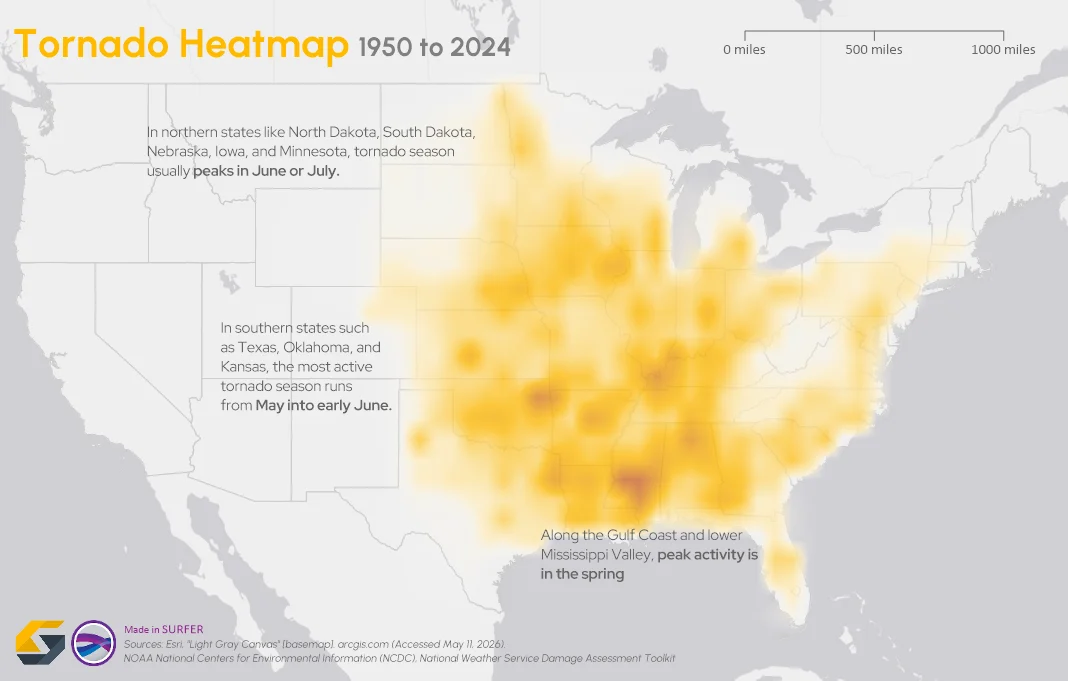
To truly answer the question, "what damage can a tornado cause," the first step is analyzing broader patterns across communities and landscapes.
- May 20, 2026|Gabbie Rhodes|7 min read
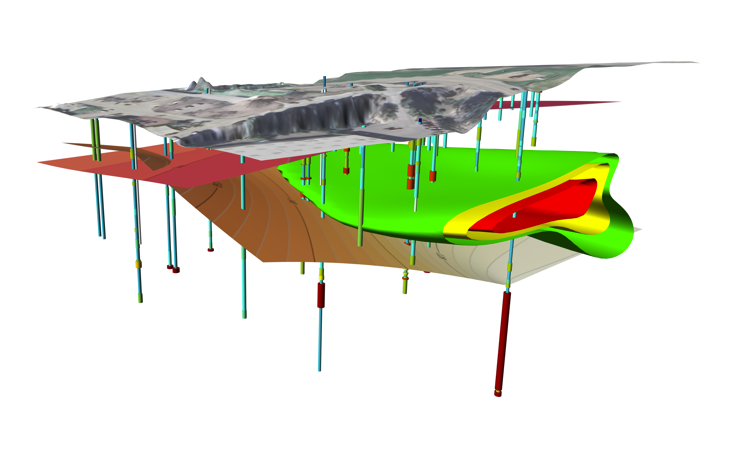
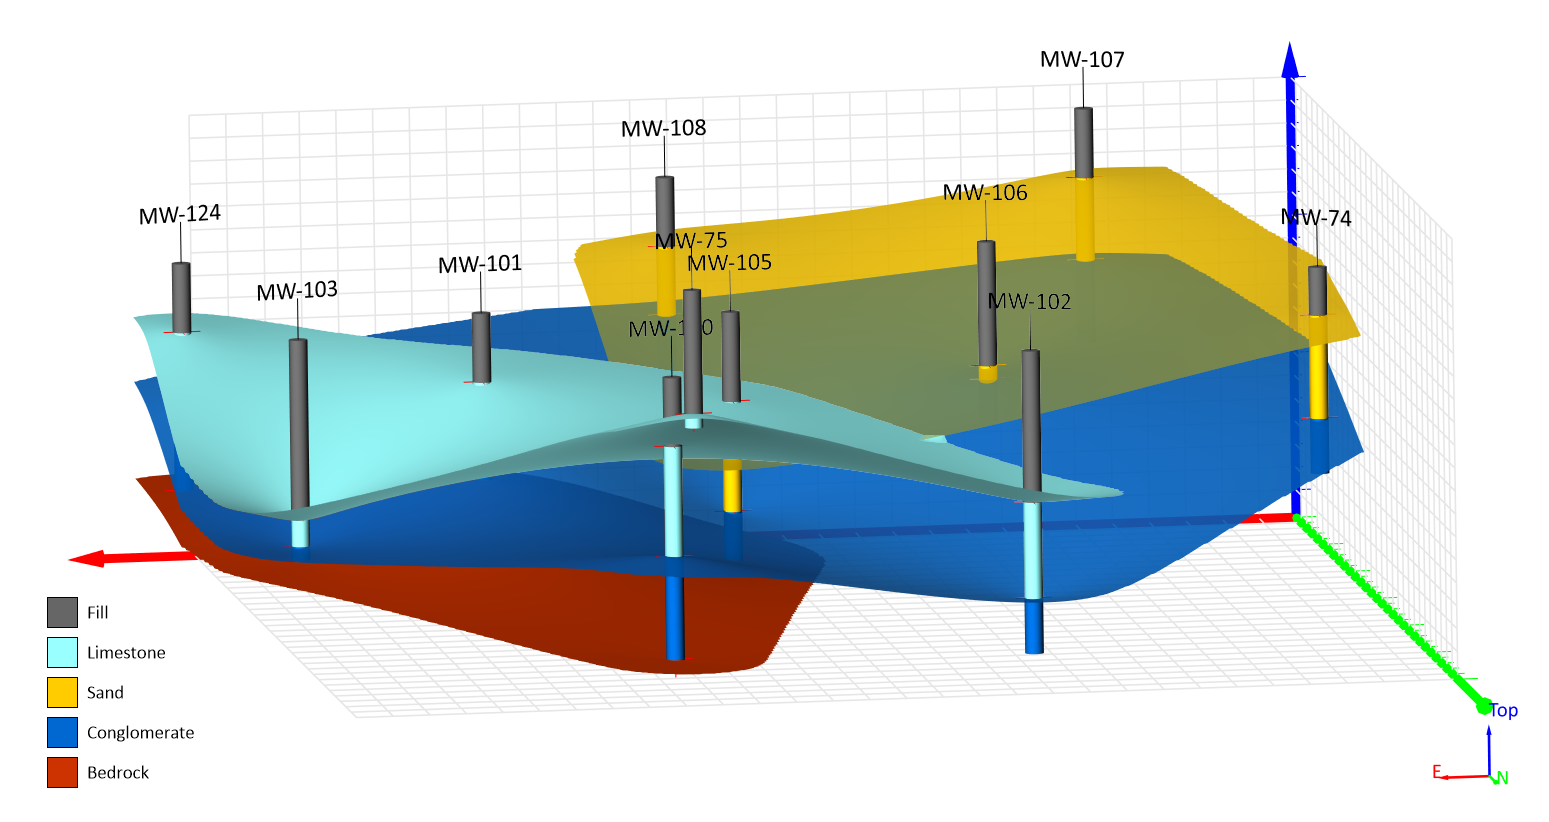
The gap between analysis and true spatial understanding has real consequences in subsurface mapping. 3D modeling closes that gap.
Data Visualization
- Apr 23, 2026|Gabbie Rhodes|16 min
The strongest candidates are often in high demand. But with the right approach, you can attract and recruit top talent to build a stronger team.
- Apr 23, 2026|Gabbie Rhodes|9 min
Even accurate data can fall short if time is displayed poorly. That’s why thoughtful time formatting is essential for your data visualization.
- Apr 15, 2026|Gabbie Rhodes|11 min
You’re trained to value precision. Every contour, parameter, and assumption matters. But how do you share complex data to non-experts? Learn tips.
- Apr 15, 2026|Gabbie Rhodes|12 min
IT procurement includes budget justifications, security reviews, and sign-off. To make it through the process, IT procurement best practices matters.


Spotlights
- Jan 20, 2026|Gabbie Rhodes|5 min read
A regional hydrologist does rapid assessments of sinkholes, leveraging a peaks and depressions map. Learn why the map is so powerful.
- Jan 6, 2026|Gabbie Rhodes|6 min read
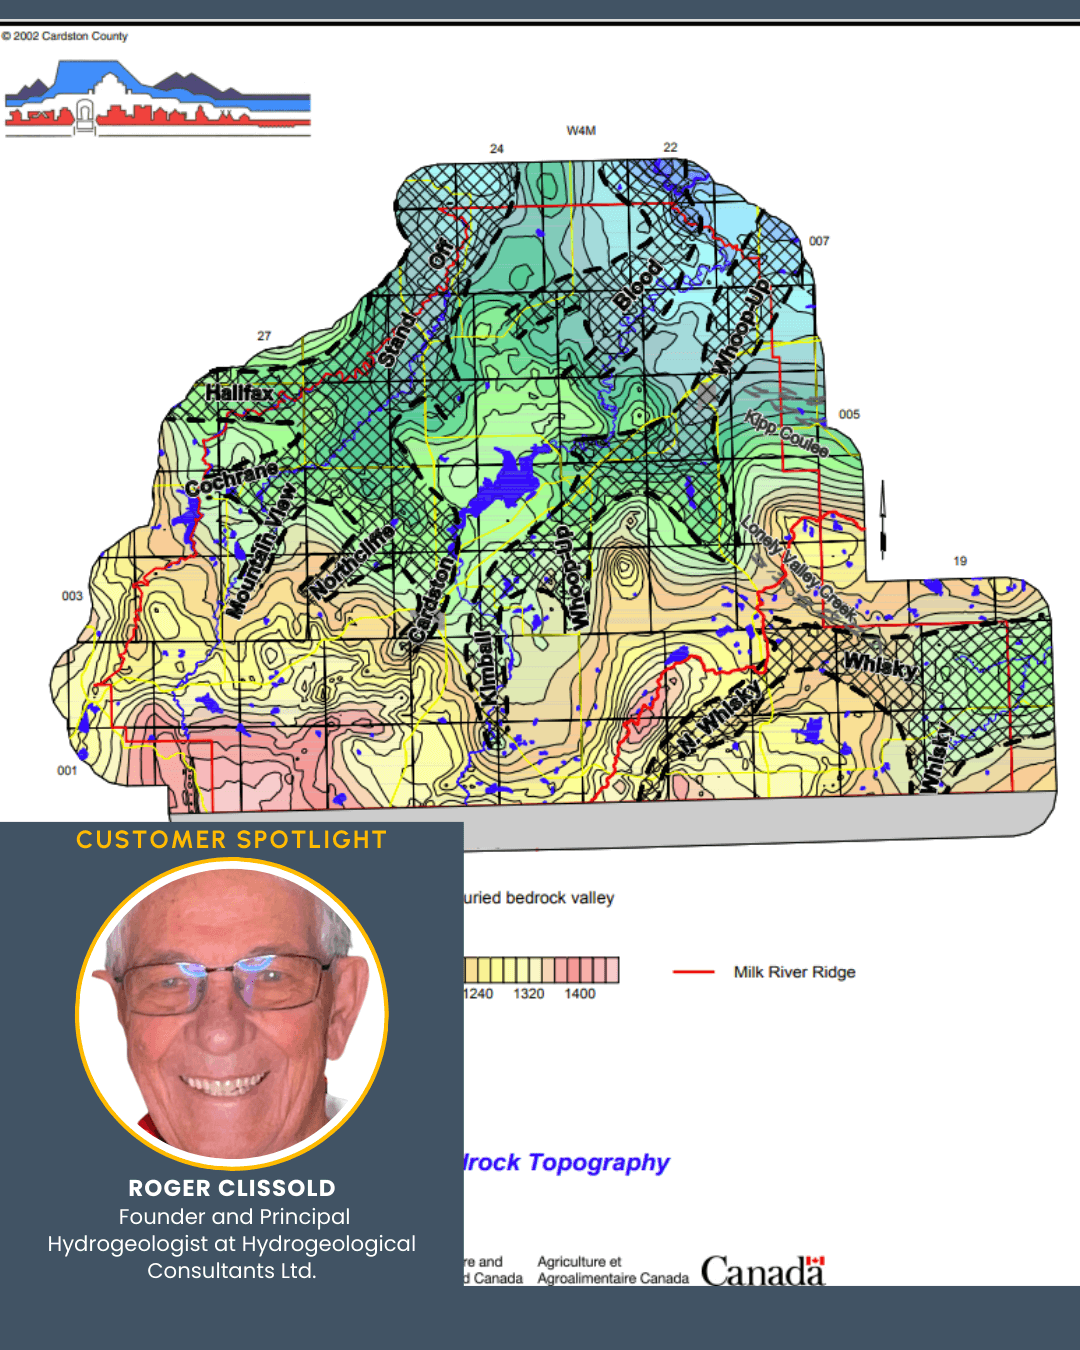
Gridding methods such as Kriging helped Hydrogeological Consultants Ltd. map groundwater resources for 40% of Alberta, Canada. Learn more.
- Dec 4, 2025|Gabbie Rhodes|5 min read
John Andersen is a Senior Geologist with O’Chiese Energy LP. He helps guide drilling decisions using subsurface data. Learn how.

Announcements
- Mar 10, 2026|Gabbie Rhodes|7 min read
The latest version of Surfer is available and packed with features to boost the clarity of your visuals and communication, while enhancing efficiency.
- Feb 25, 2026|Gabbie Rhodes|9 min read
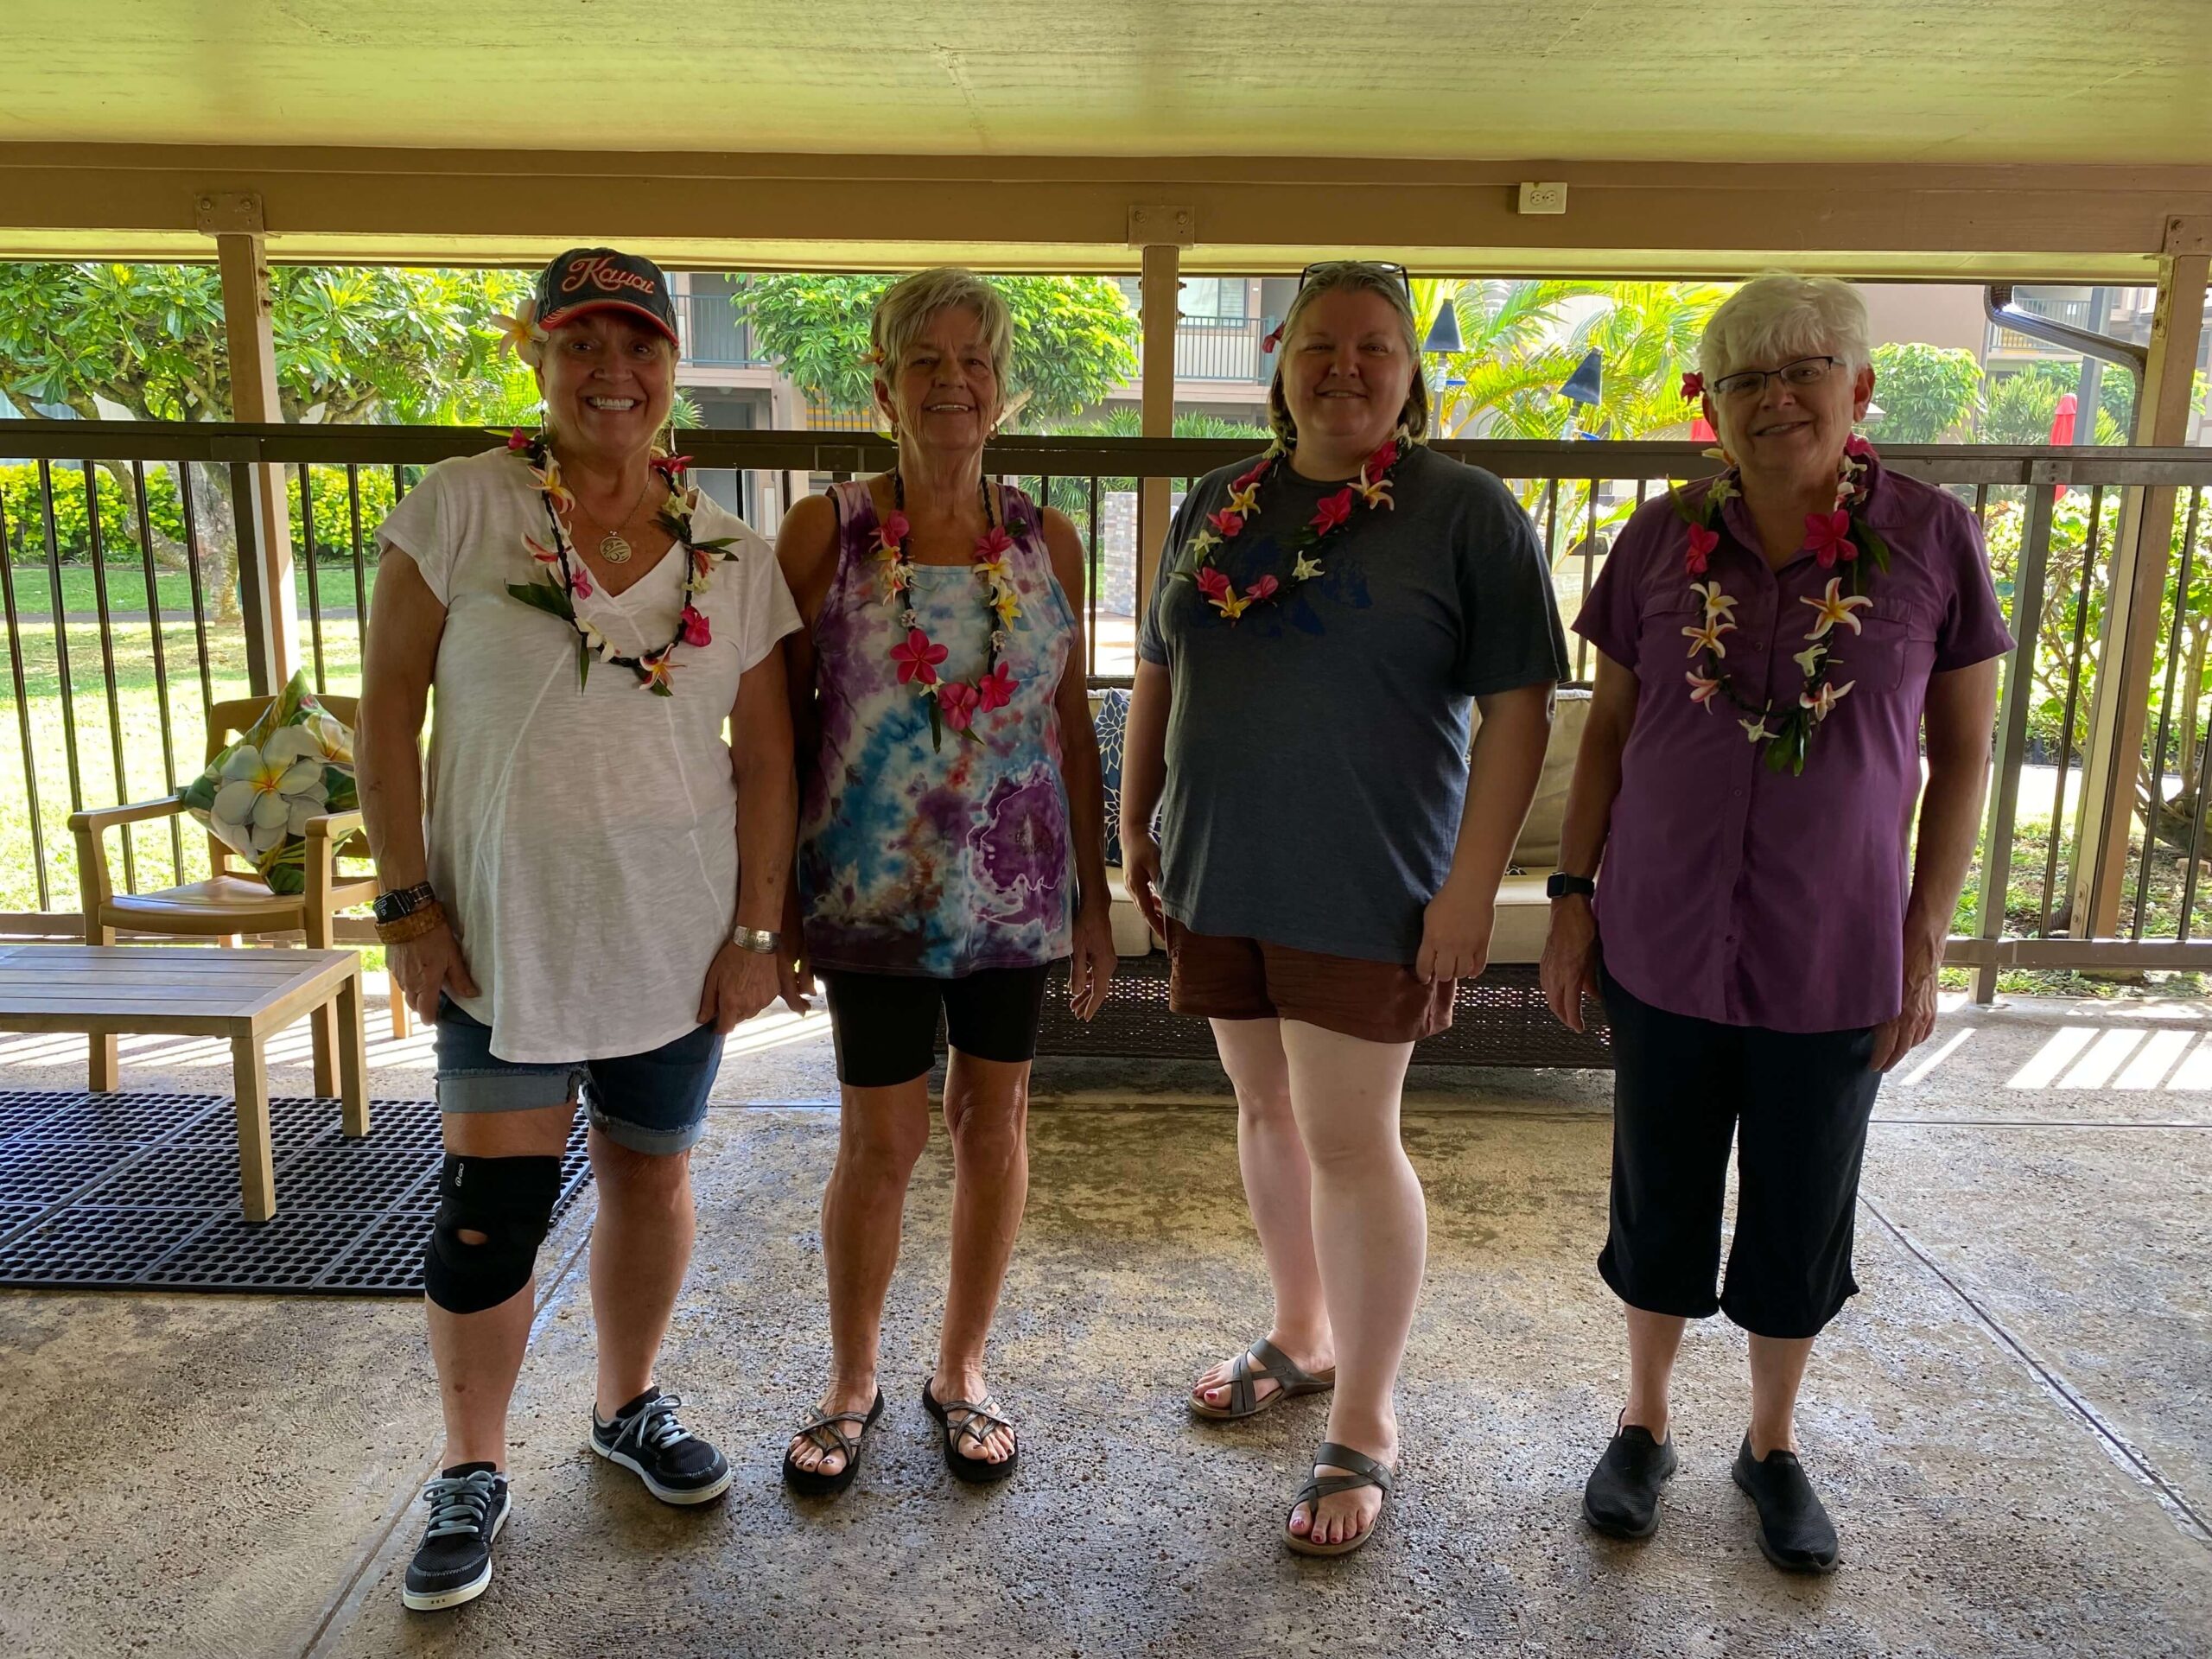
Golden Software's Customer Support Team Lead, Katie Yoder, recently took a trip to Kauai, Hawaii. Discover her favorite parts of the journey.
Resource Exploration
- Sep 24, 2025|Gabbie Rhodes|5 min
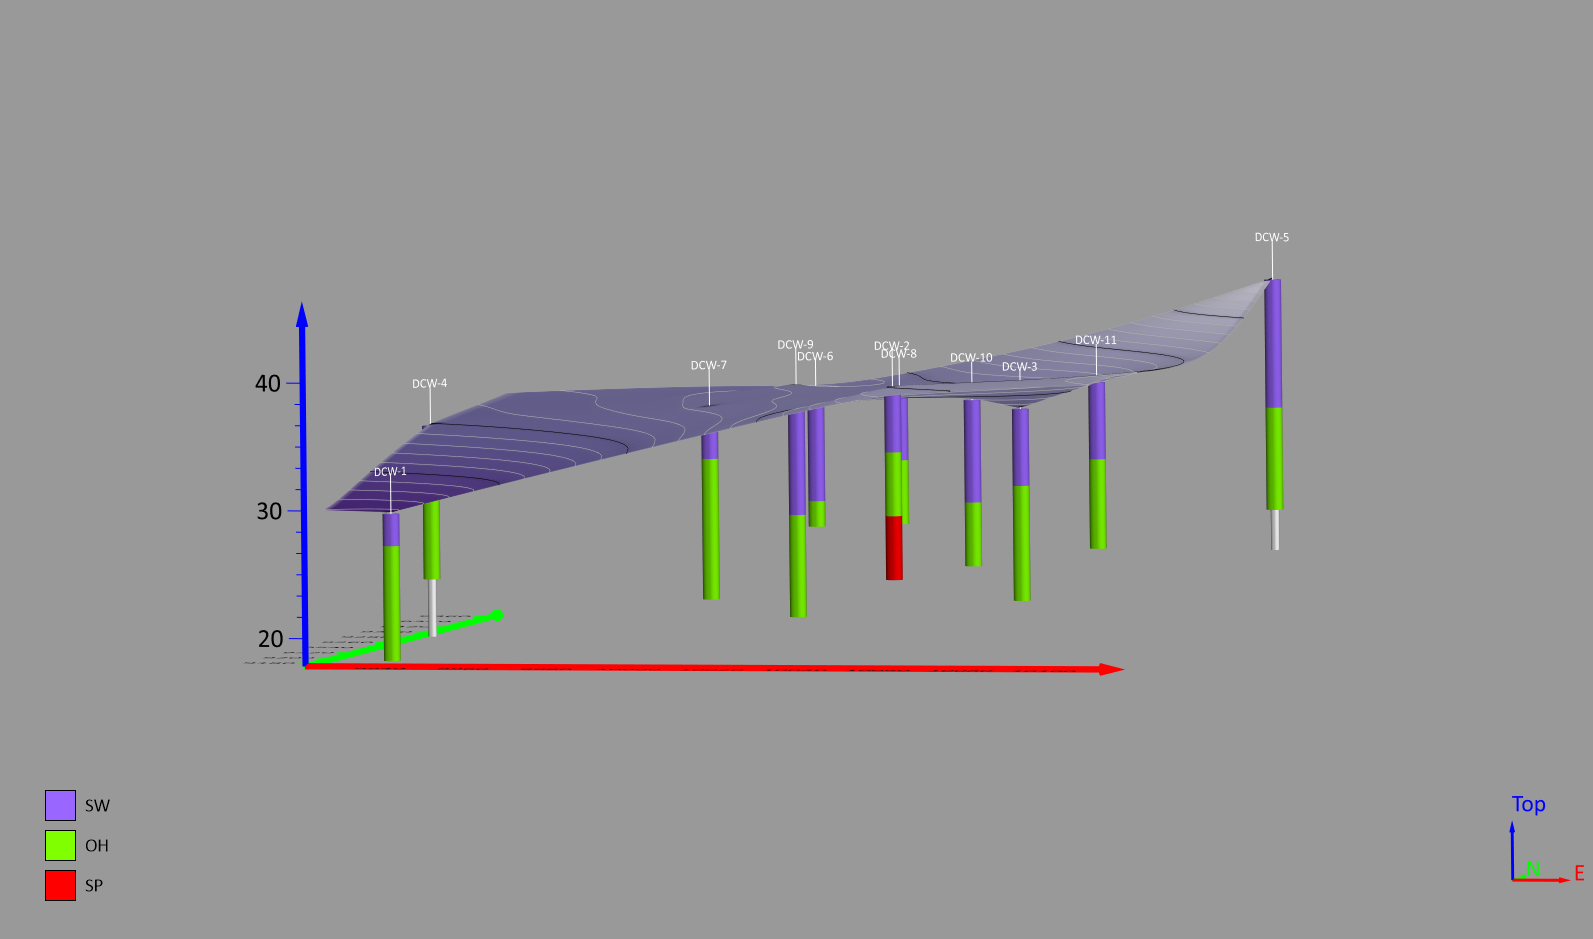
Do you want to showcase underground feature with clarity and precision? Create contact drillhole contacts and surfaces show lithologies & more.
- Apr 23, 2025|Gabbie Rhodes|7 min
Do you want give stakeholders more insight into the subsurface? There's a specialized map type you should consider using: drillhole maps!
- Mar 13, 2025|Gabbie Rhodes|4 min
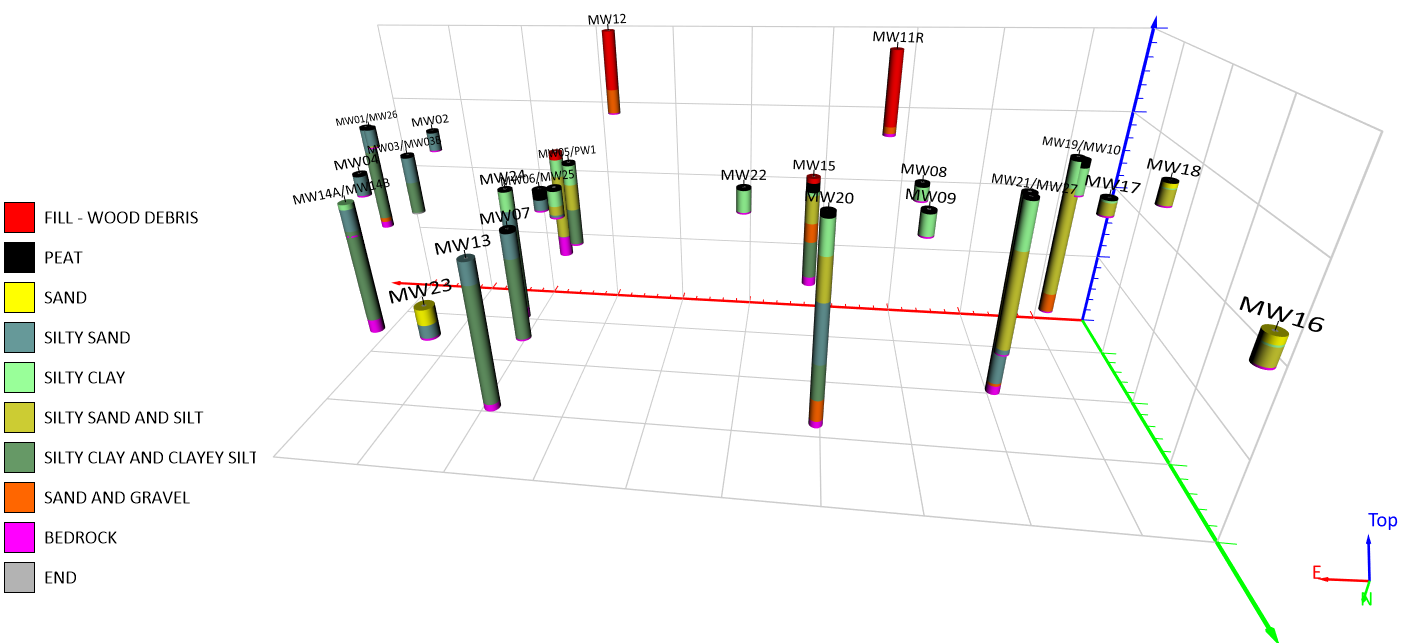
It's critical to clearly label and highlight the geology in your 3D drillholes when your work involves the subsurface. Luckily, Surfer makes it easy.
- Aug 14, 2024|Drew Dudley|5 min
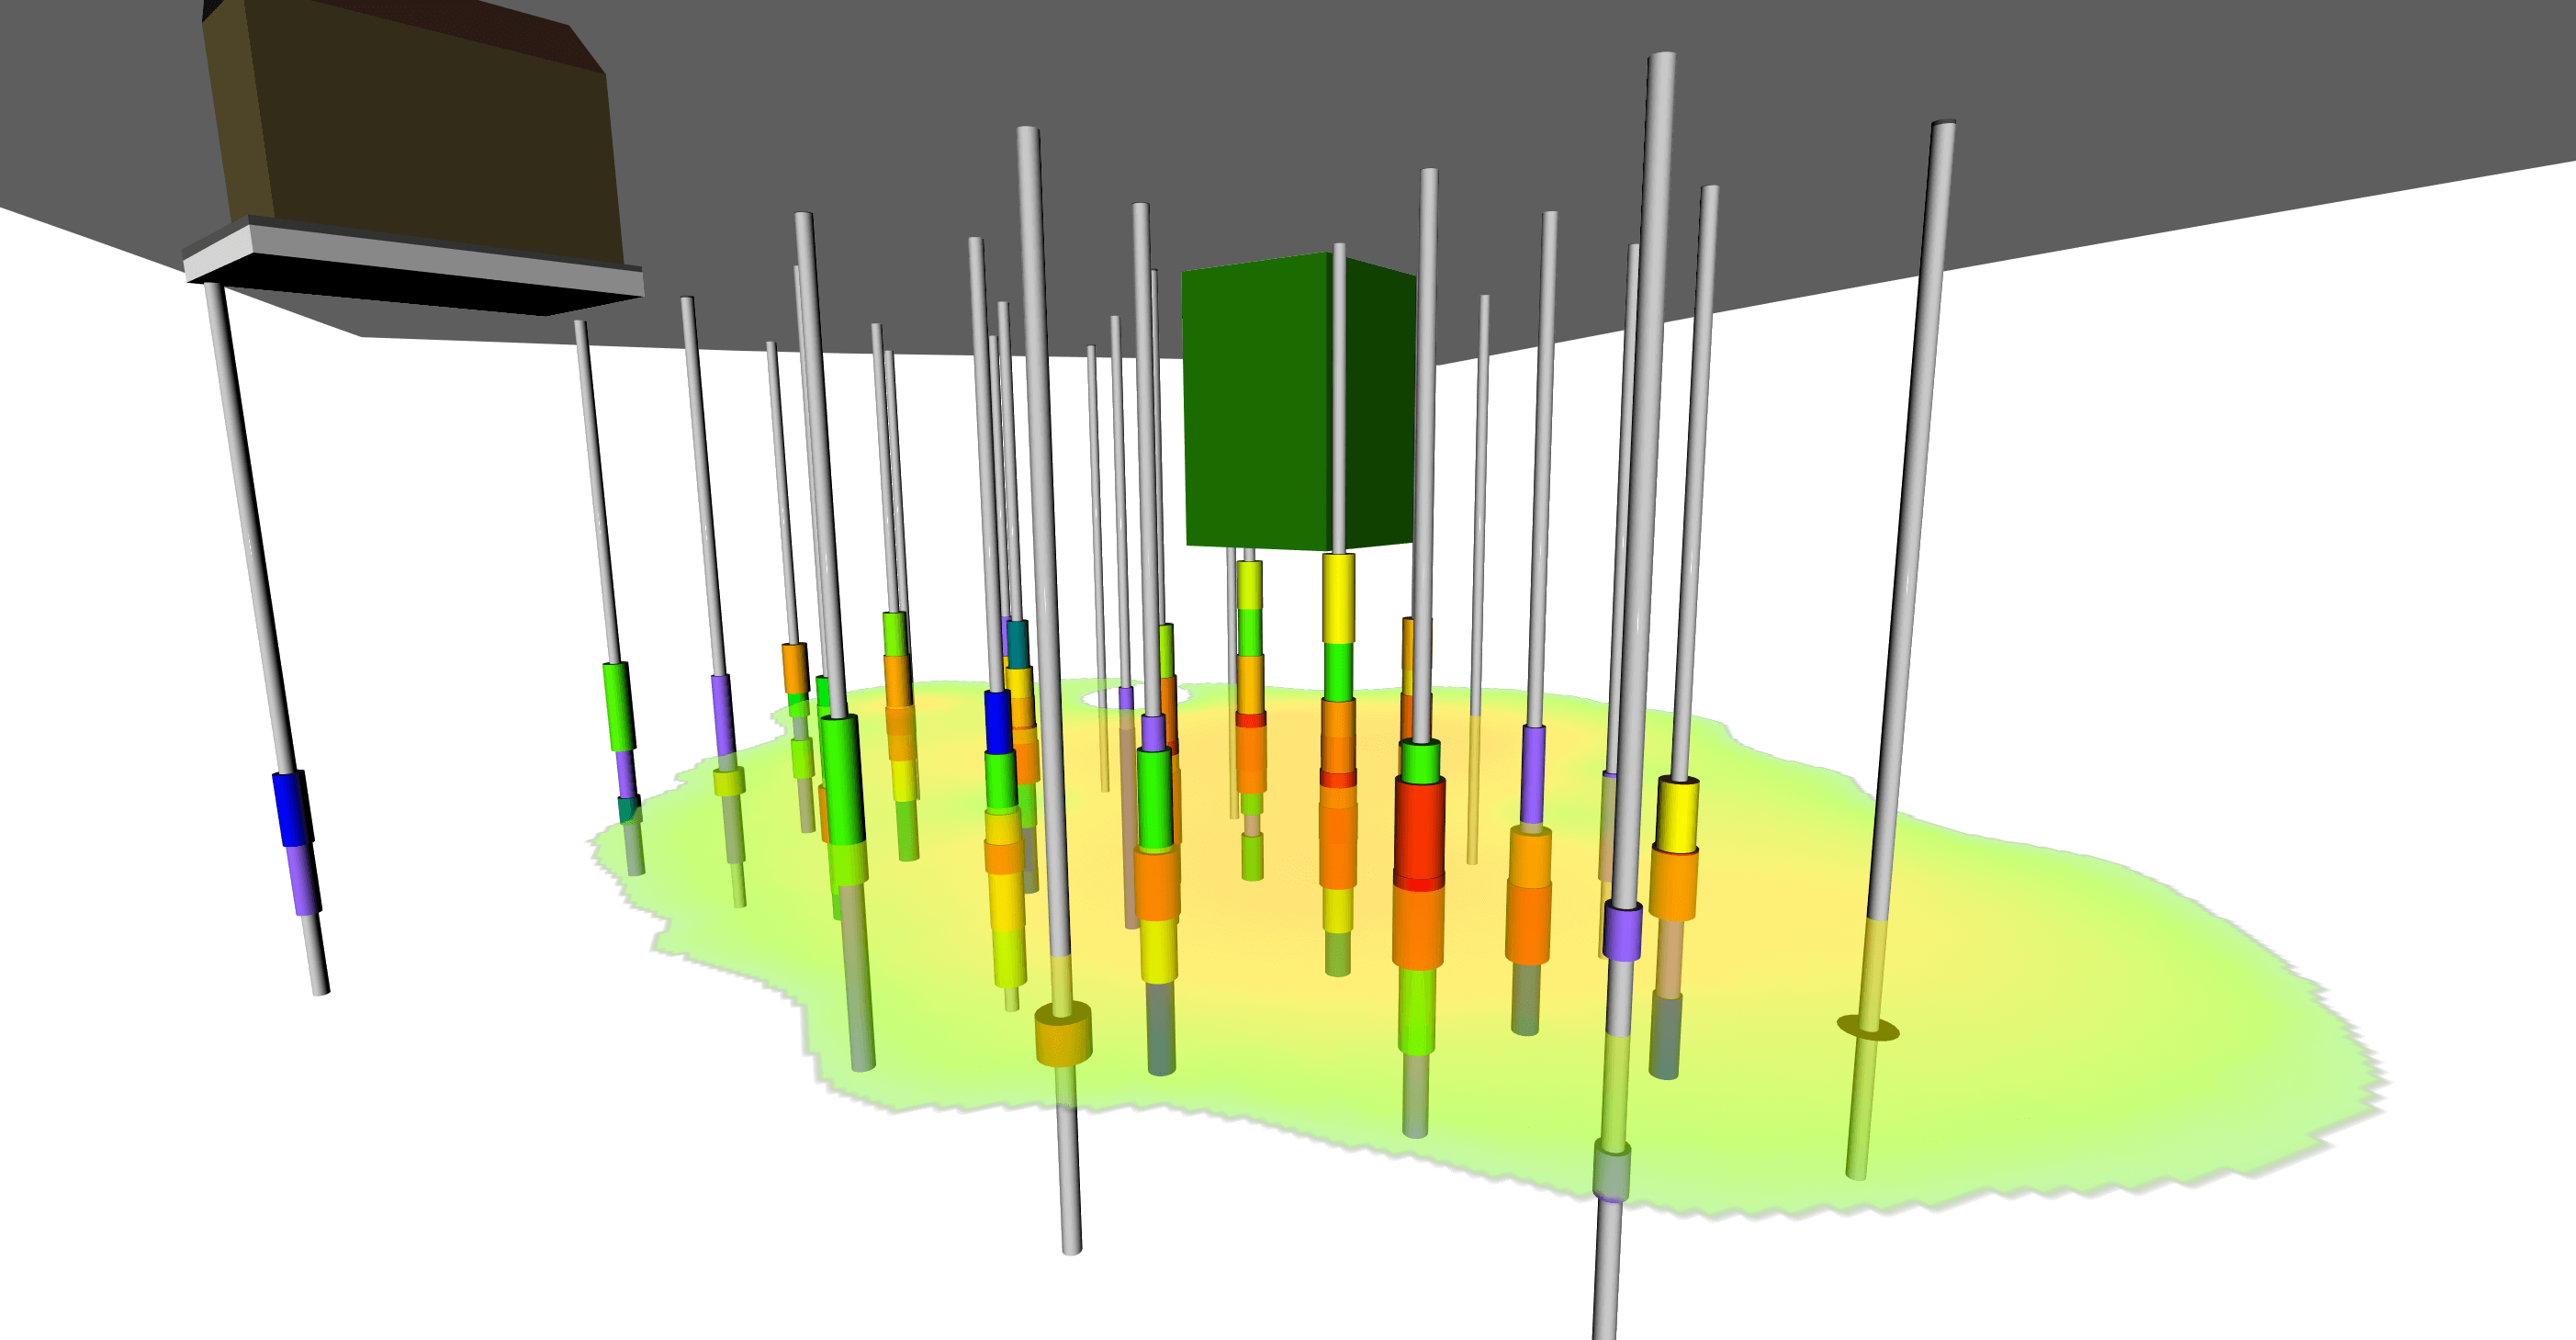
Gridding 3D drillhole data comes with some unique challenges that can be overcome by using these four best practices!