Water Resources
Transform Hydrologic Data into Actionable Insights

Protect Your Community’s Water Resources
The water resources management landscape is constantly evolving. In the face of urbanization, changing climate patterns, and policy constraints, Golden Software stands as a champion for hydrologists striving to forge a sustainable future.
Our visualization software empowers hydrologists to model watersheds with unparalleled precision, unraveling the complexities of water flow and distribution. You can feel confident performing comprehensive water quality analysis and calculations that lead to informed decision-making, ensuring that stakeholders have a clear understanding of environmental impacts.
With Surfer and Grapher, hydrologists can craft compelling presentations, translating data into actionable insights crucial for strategic planning. Golden Software is dedicated to supporting hydrologists in their mission to navigate the challenges of water resource management and contribute to the creation of a water-resilient world for stakeholders and communities alike.
Applications
Model Hydrologic Features
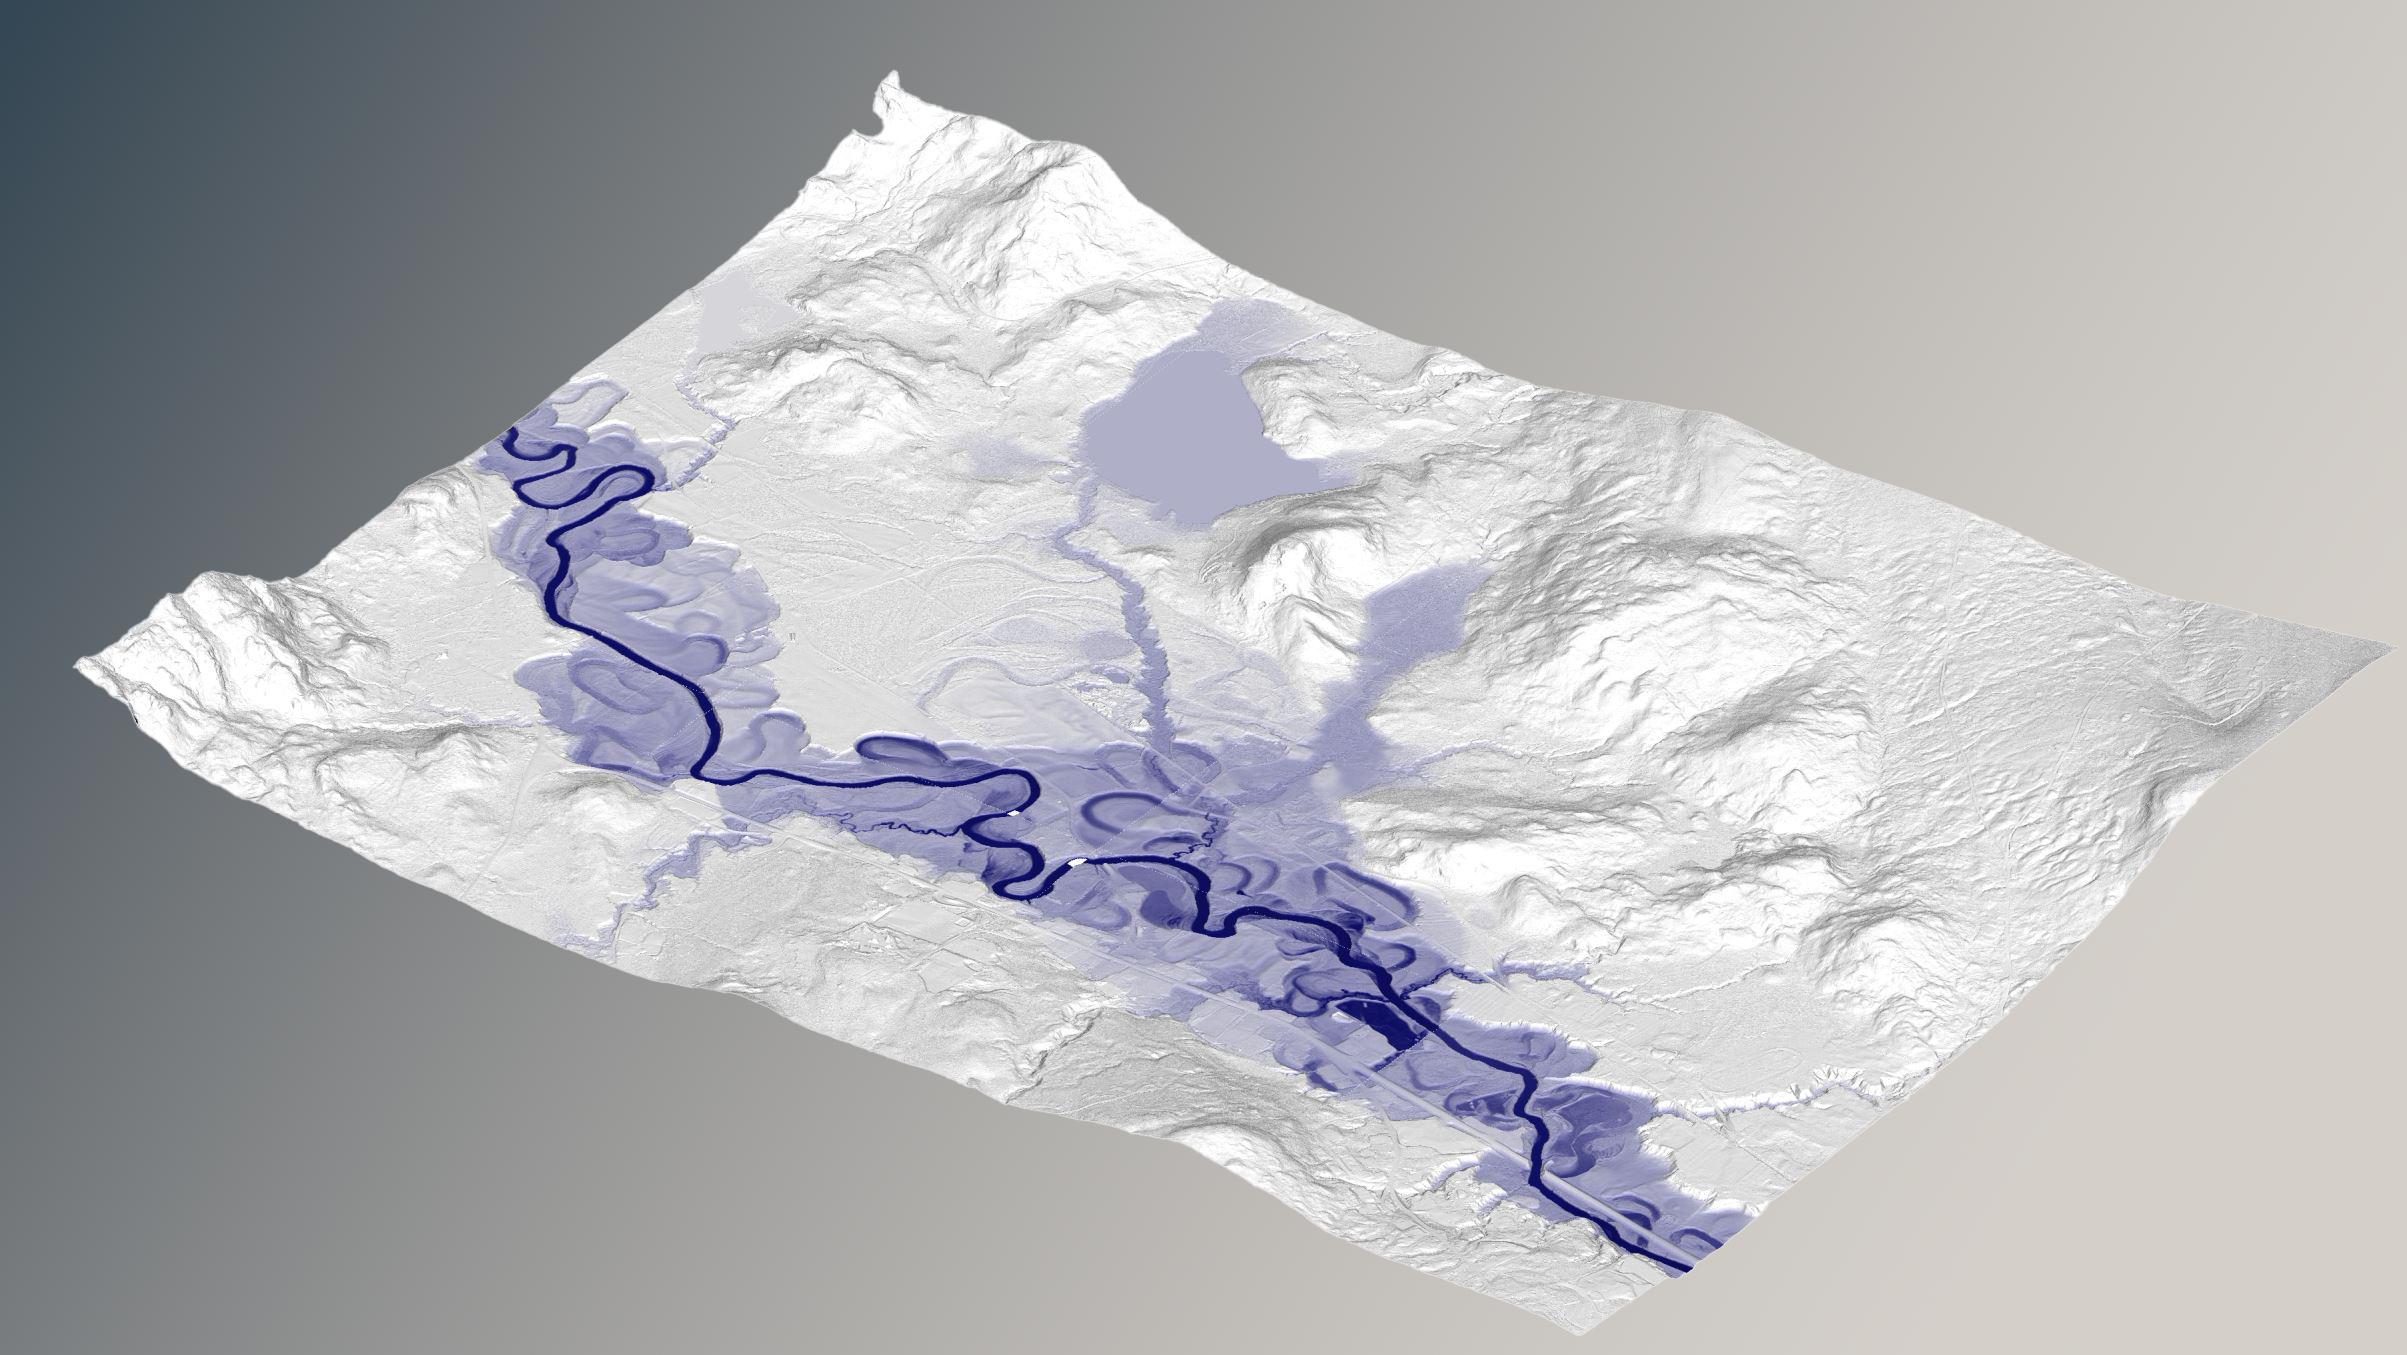
From its outset Surfer has been designed with hydrology professionals in mind. Streamline the modeling process for water resources management and create accurate, visually compelling representations of hydrologic data in both 2D & 3D.
Whether your modeling needs involve generating contours to depict groundwater elevation, mapping watershed boundaries, illustrating the flow of a river, or constructing a detailed 3D model of a reservoir, Surfer is your comprehensive solution. Elevate your hydrologic modeling with Surfer, where precision meets visualization.
Perform Water Quality Analysis
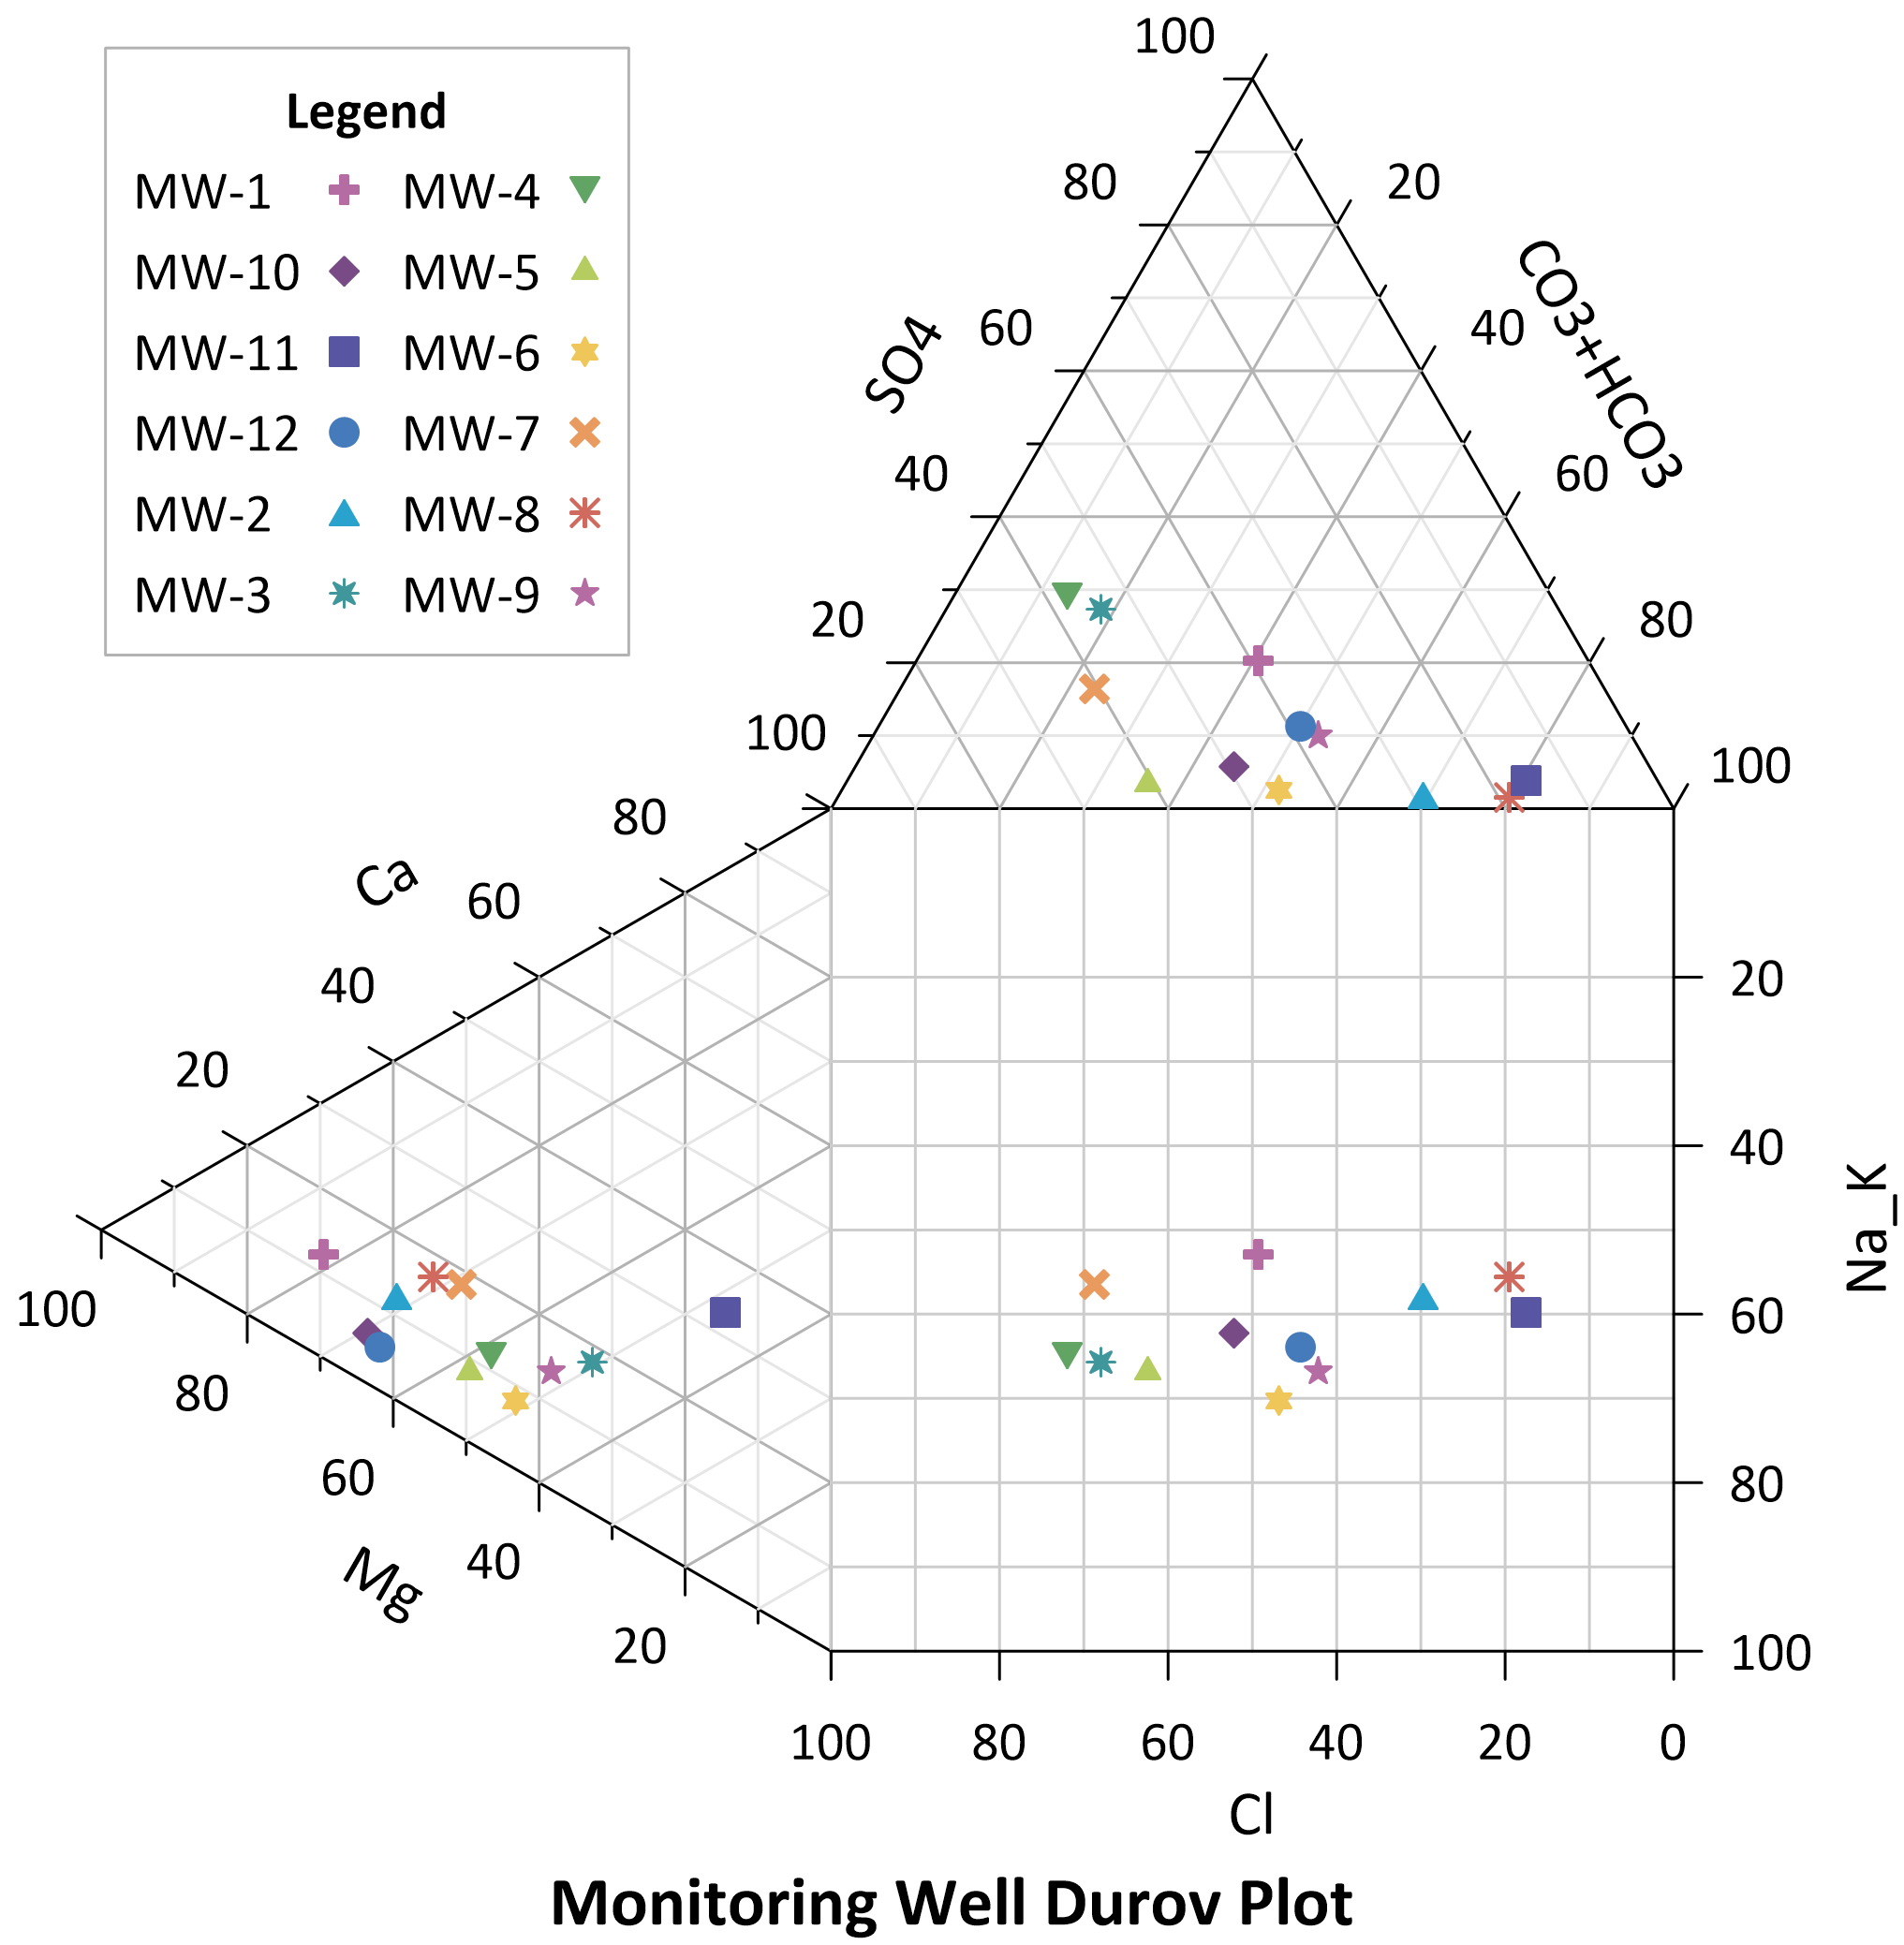
Perform your water quality assessment with one tool, Grapher! Grapher offers specialized water quality functionality such as trilinear, Piper, Durov, and Stiff diagrams.
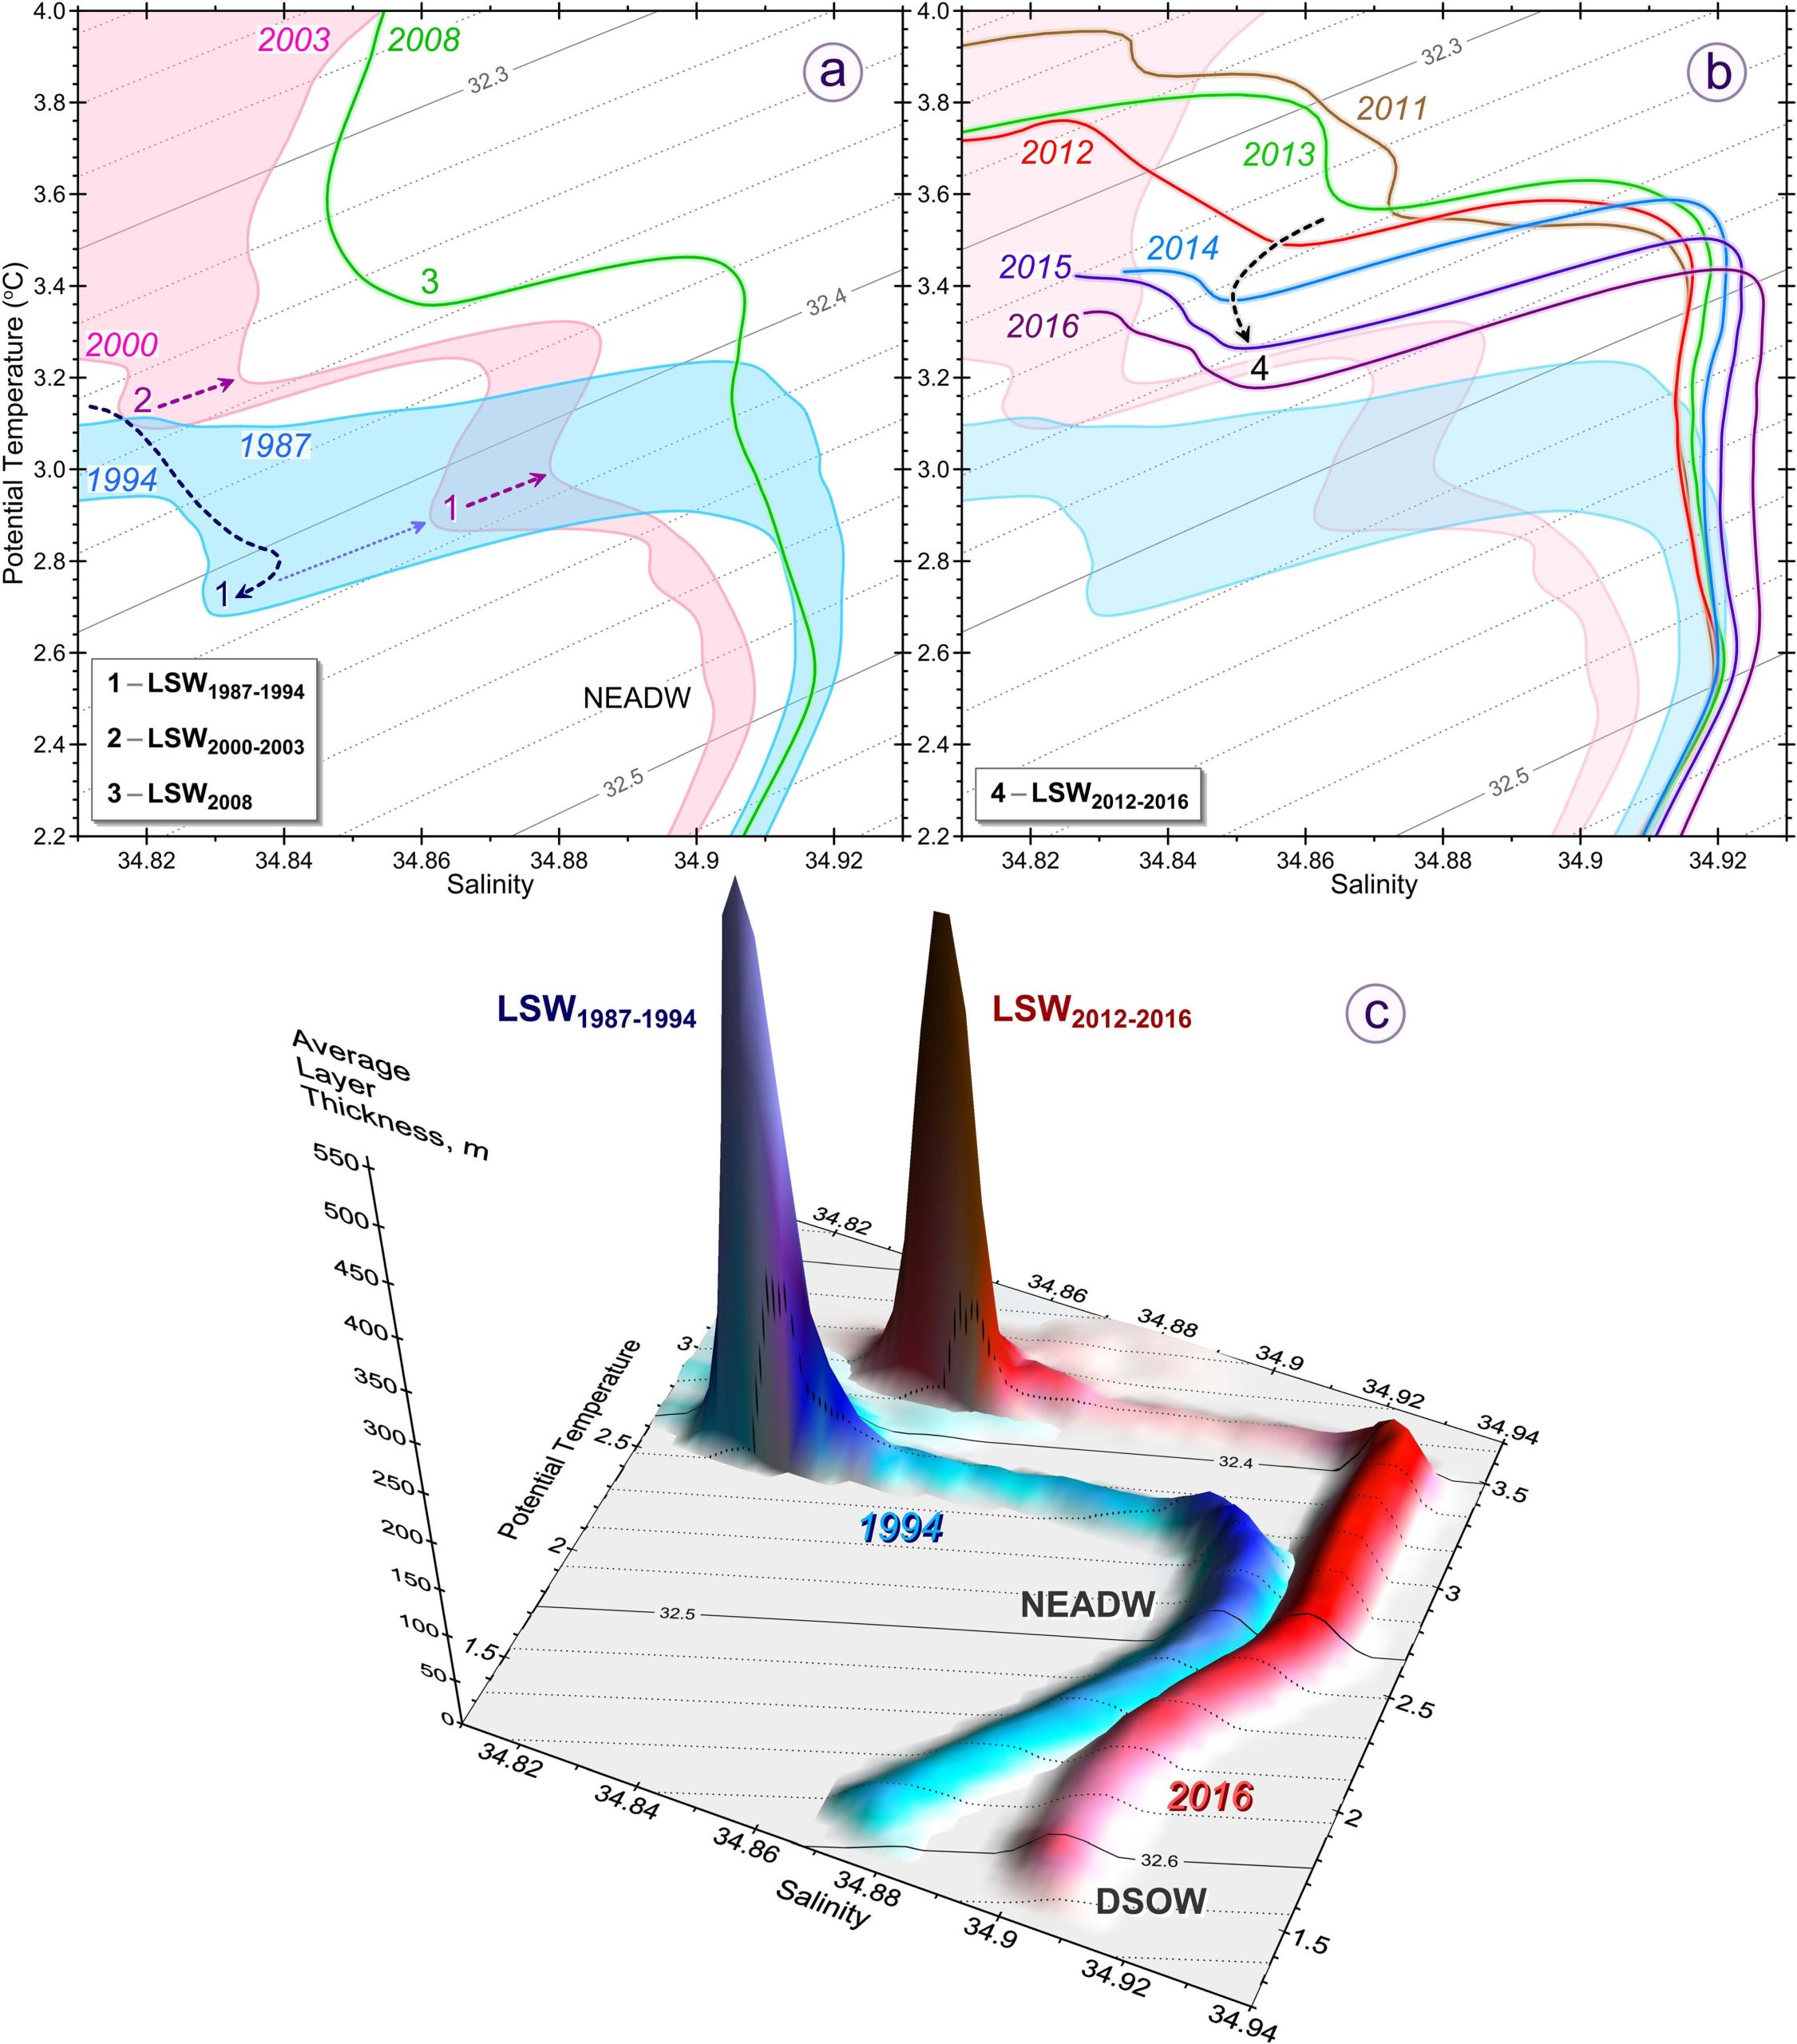
Grapher’s comprehensive suite of features allow water resources experts to visually represent and analyze complex water chemistry data over time with unparalleled precision. You can feel confident presenting the full story of a reservoir by examining the distribution of major ions, delineating water types, and assessing mineral saturation with Grapher.
Plan For a Sustainable Future
One of the greatest challenges in water resources management is communicating complex hydrologic concepts to the public and policymakers. An engaging graphic can go a long way in bridging the gap between public understanding and the potential impact of your findings.
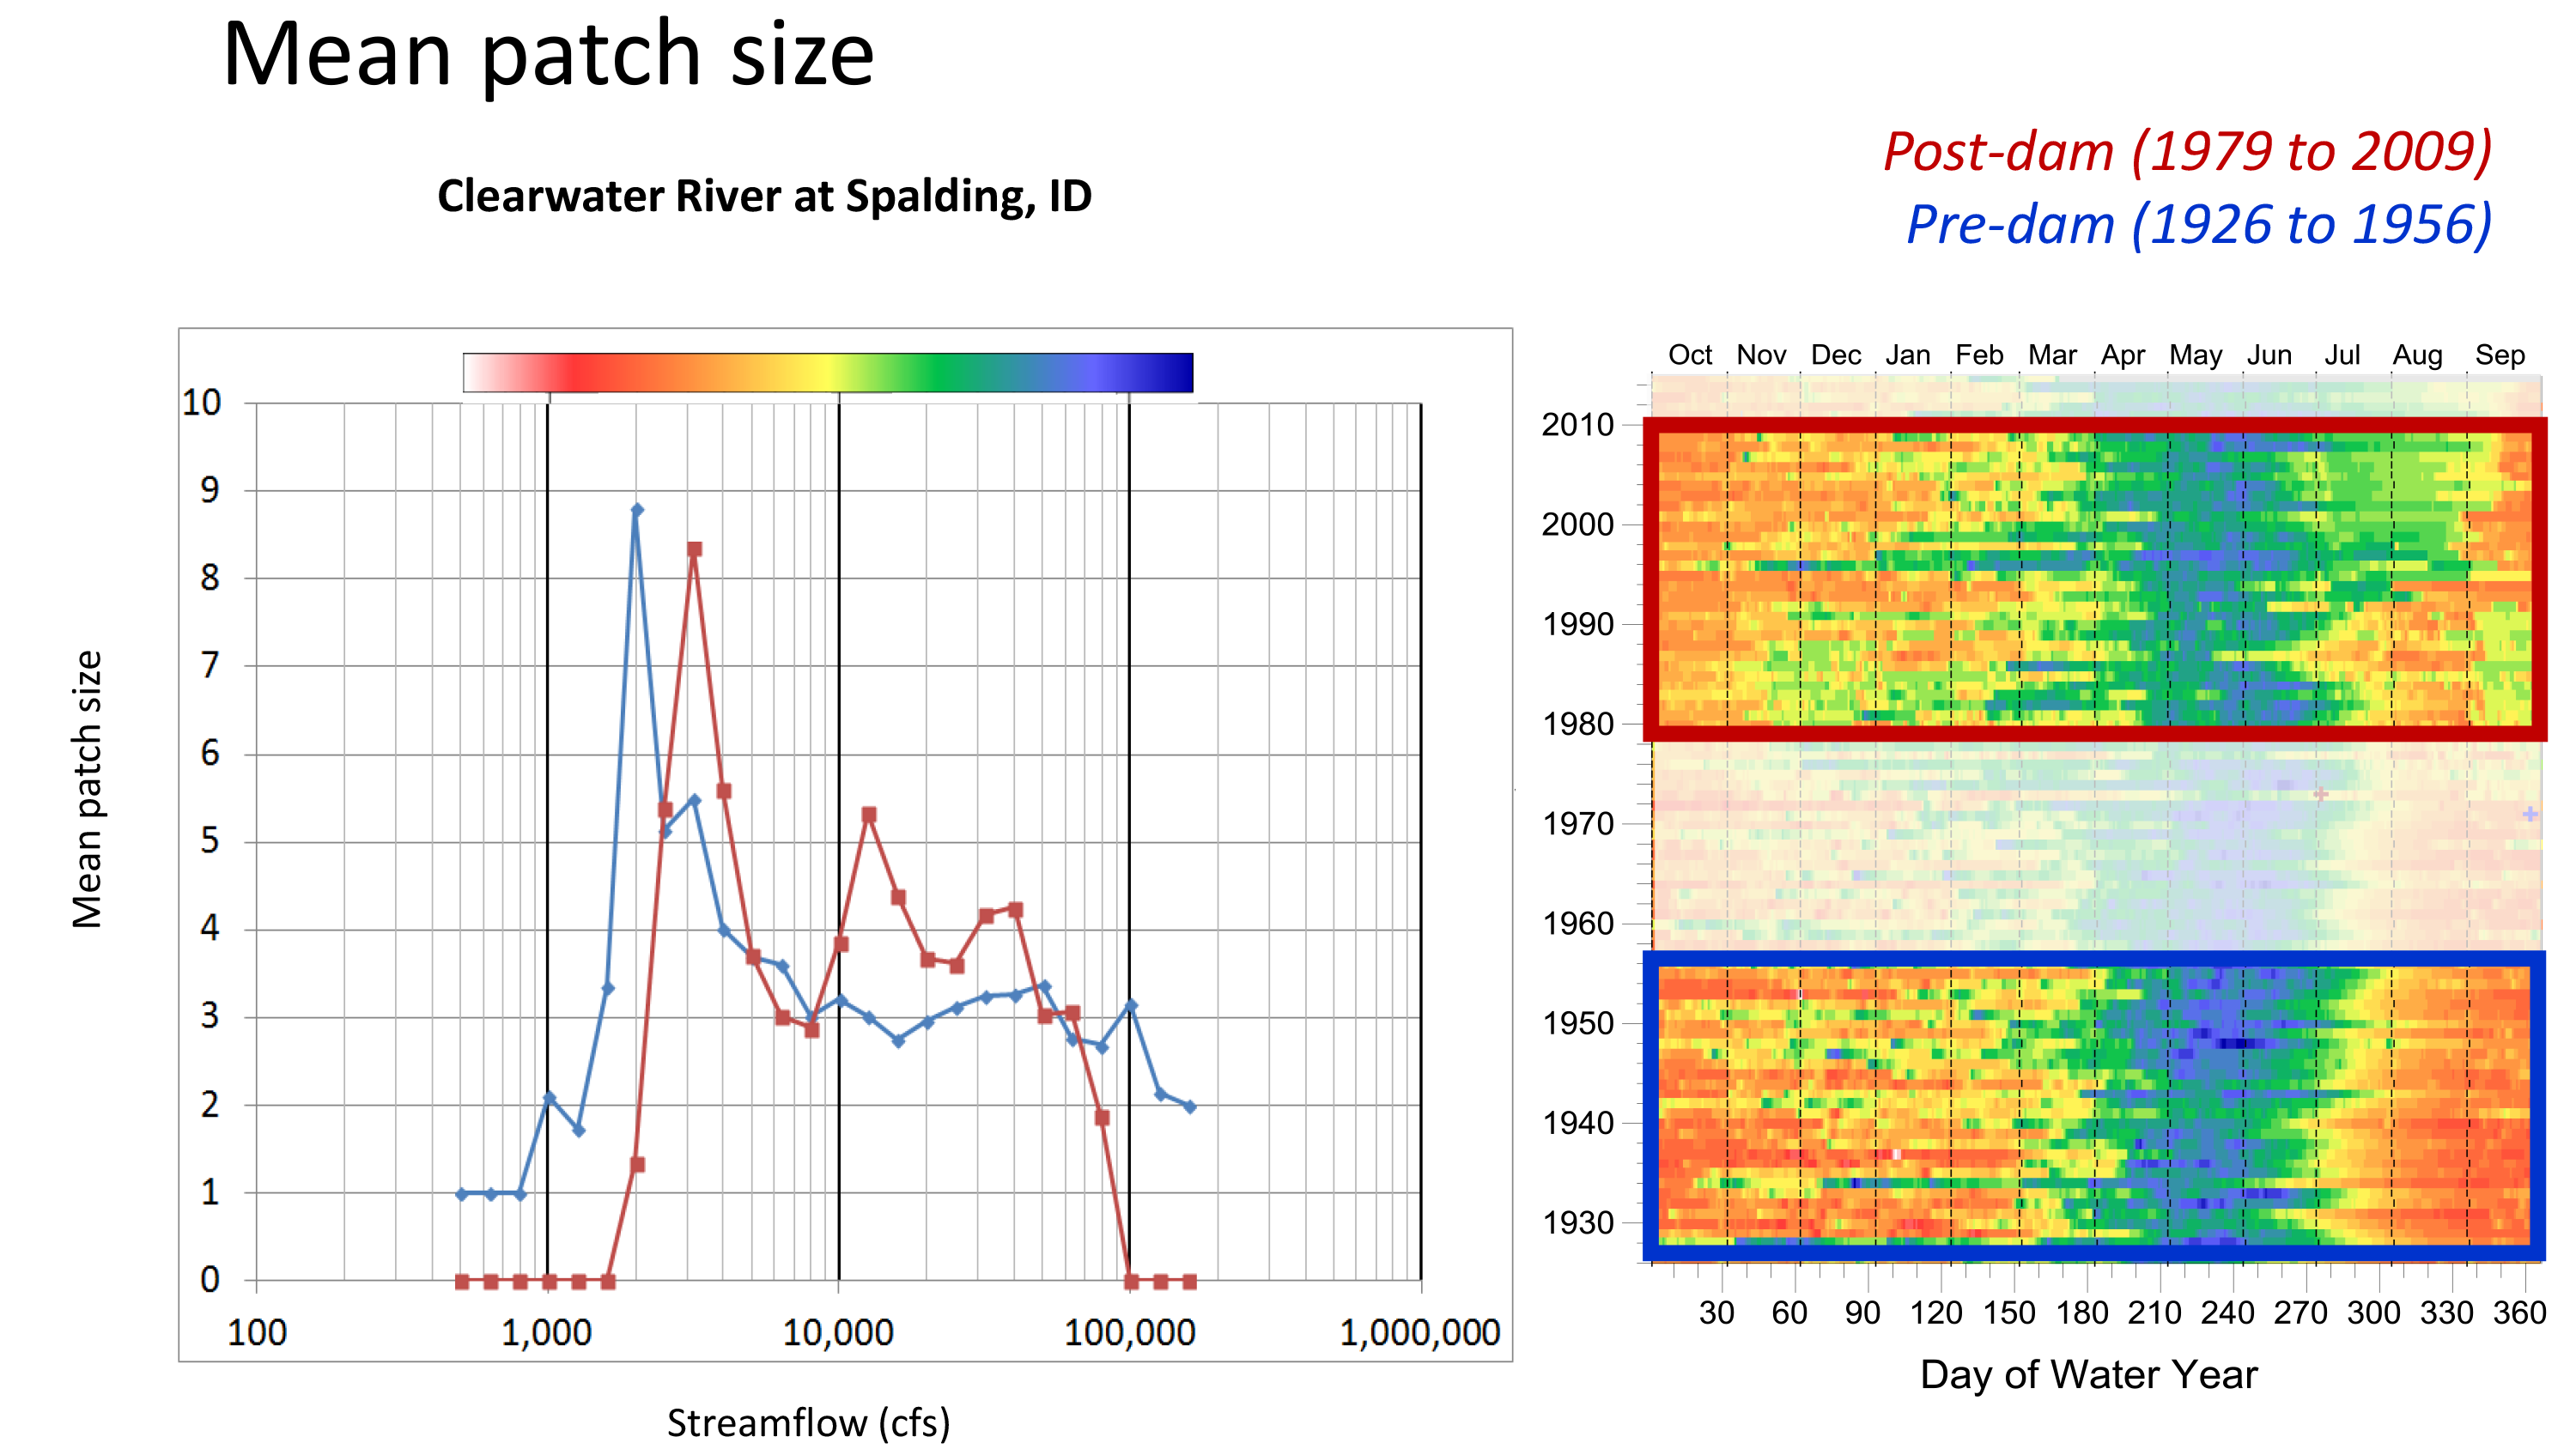
With Surfer & Grapher, hydrologists can not only effortlessly import data reflecting a multitude of water variables and update long-term monitoring plots. But, our software includes in-depth customization options that can assist you in creating the figure you need. Enabling you to identify and communicate important hydrological findings that lead to informed decisions regarding usage, remediation, and sustainability.
Real World Water Resources Results


Golden Guarantee
100% Satisfaction Guaranteed or 100% of Your Money Back
We know Surfer and Grapher’s visualization capabilities will help you stand out from the crowd, WOW clients, and leave a lasting impression!
But… we realize you don’t know this yet. And you won’t until you experience our products for yourself.
This is why we provide this guarantee. This is the distillation of a 40+ year adventure designing, developing, and honing powerful visualization and analysis features as requested by scientists and engineers like you.
Our products can produce results far beyond its license fees. We are assuming all your risk, so you have none.
TESTIMONIALS
Hear what other scientists & engineers have to say!
Golden Software is like a close family. Your team is always ready to answer questions, to solve problems, your products are of fine quality, low prices for updates.
Thierry Hatt
Historical GIS Cartographer Université de Strasbourg, France
We have been Golden Software clients for 35 years and have never been disappointed. For us, it’s the premier data presentation package.
Felicia Bechtel
Senior Geophysical Advisor
I’ve used Surfer for many years. It helps me tell my data’s story which allows me to clearly communicate important information with clients.
Richard Koehler, PhD
PH Founder, Visual Data Analytics, LLC
The wide variety and functionality of the interpolation/extrapolation algorithms, as well as the geostatistical functionality, is simply awesome!
Grant van Heerden, MAIG
Mine Geotechnical Engineer / Engineering Geologist
As an author, I make beautiful maps of the ground surface from LiDAR data. Surfer allows me to tease out subtle features. It is a delight to use and the tools are there, no matter what function I wish to apply.
Peter Hatherly
Geophysicist
Golden Software products are the most intuitive of any software I've ever used.
Anna Klene, PhD
Professor
Surfer is the best GIS software I have ever used…better than AutoCAD and ArcGIS … I love it!
Liliana Cecan, PhD, PE
Senior Project Manager
Surfer appears to have been designed by people who really understand what scientists like myself want to do. This allows me to look at data and ask questions without being concerned at the technicalities of how to load, manipulate and map data.
Barry Gardiner
Senior Scientist