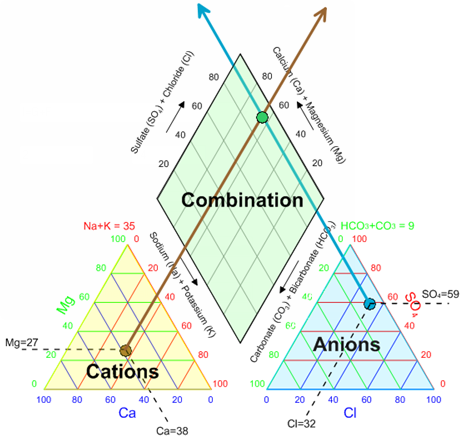
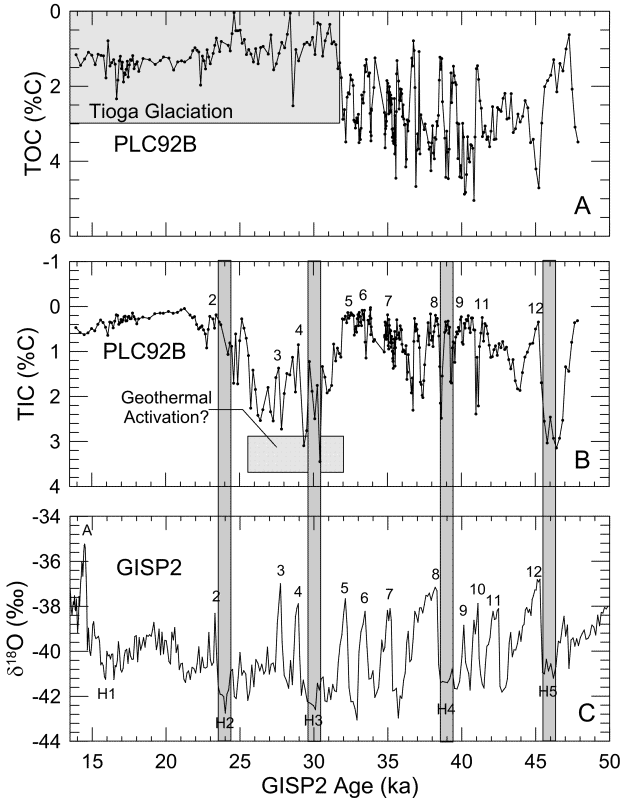
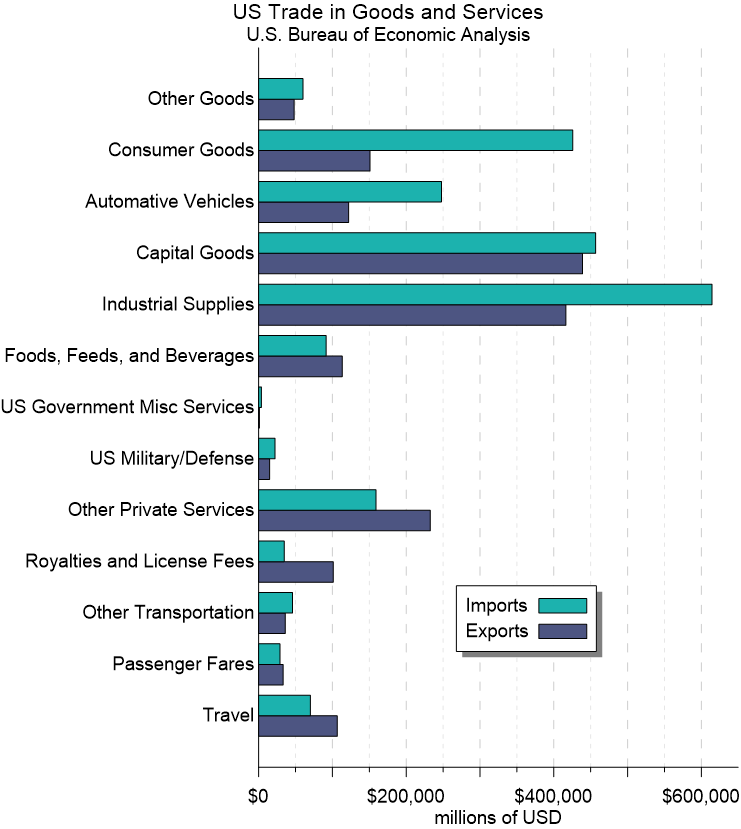
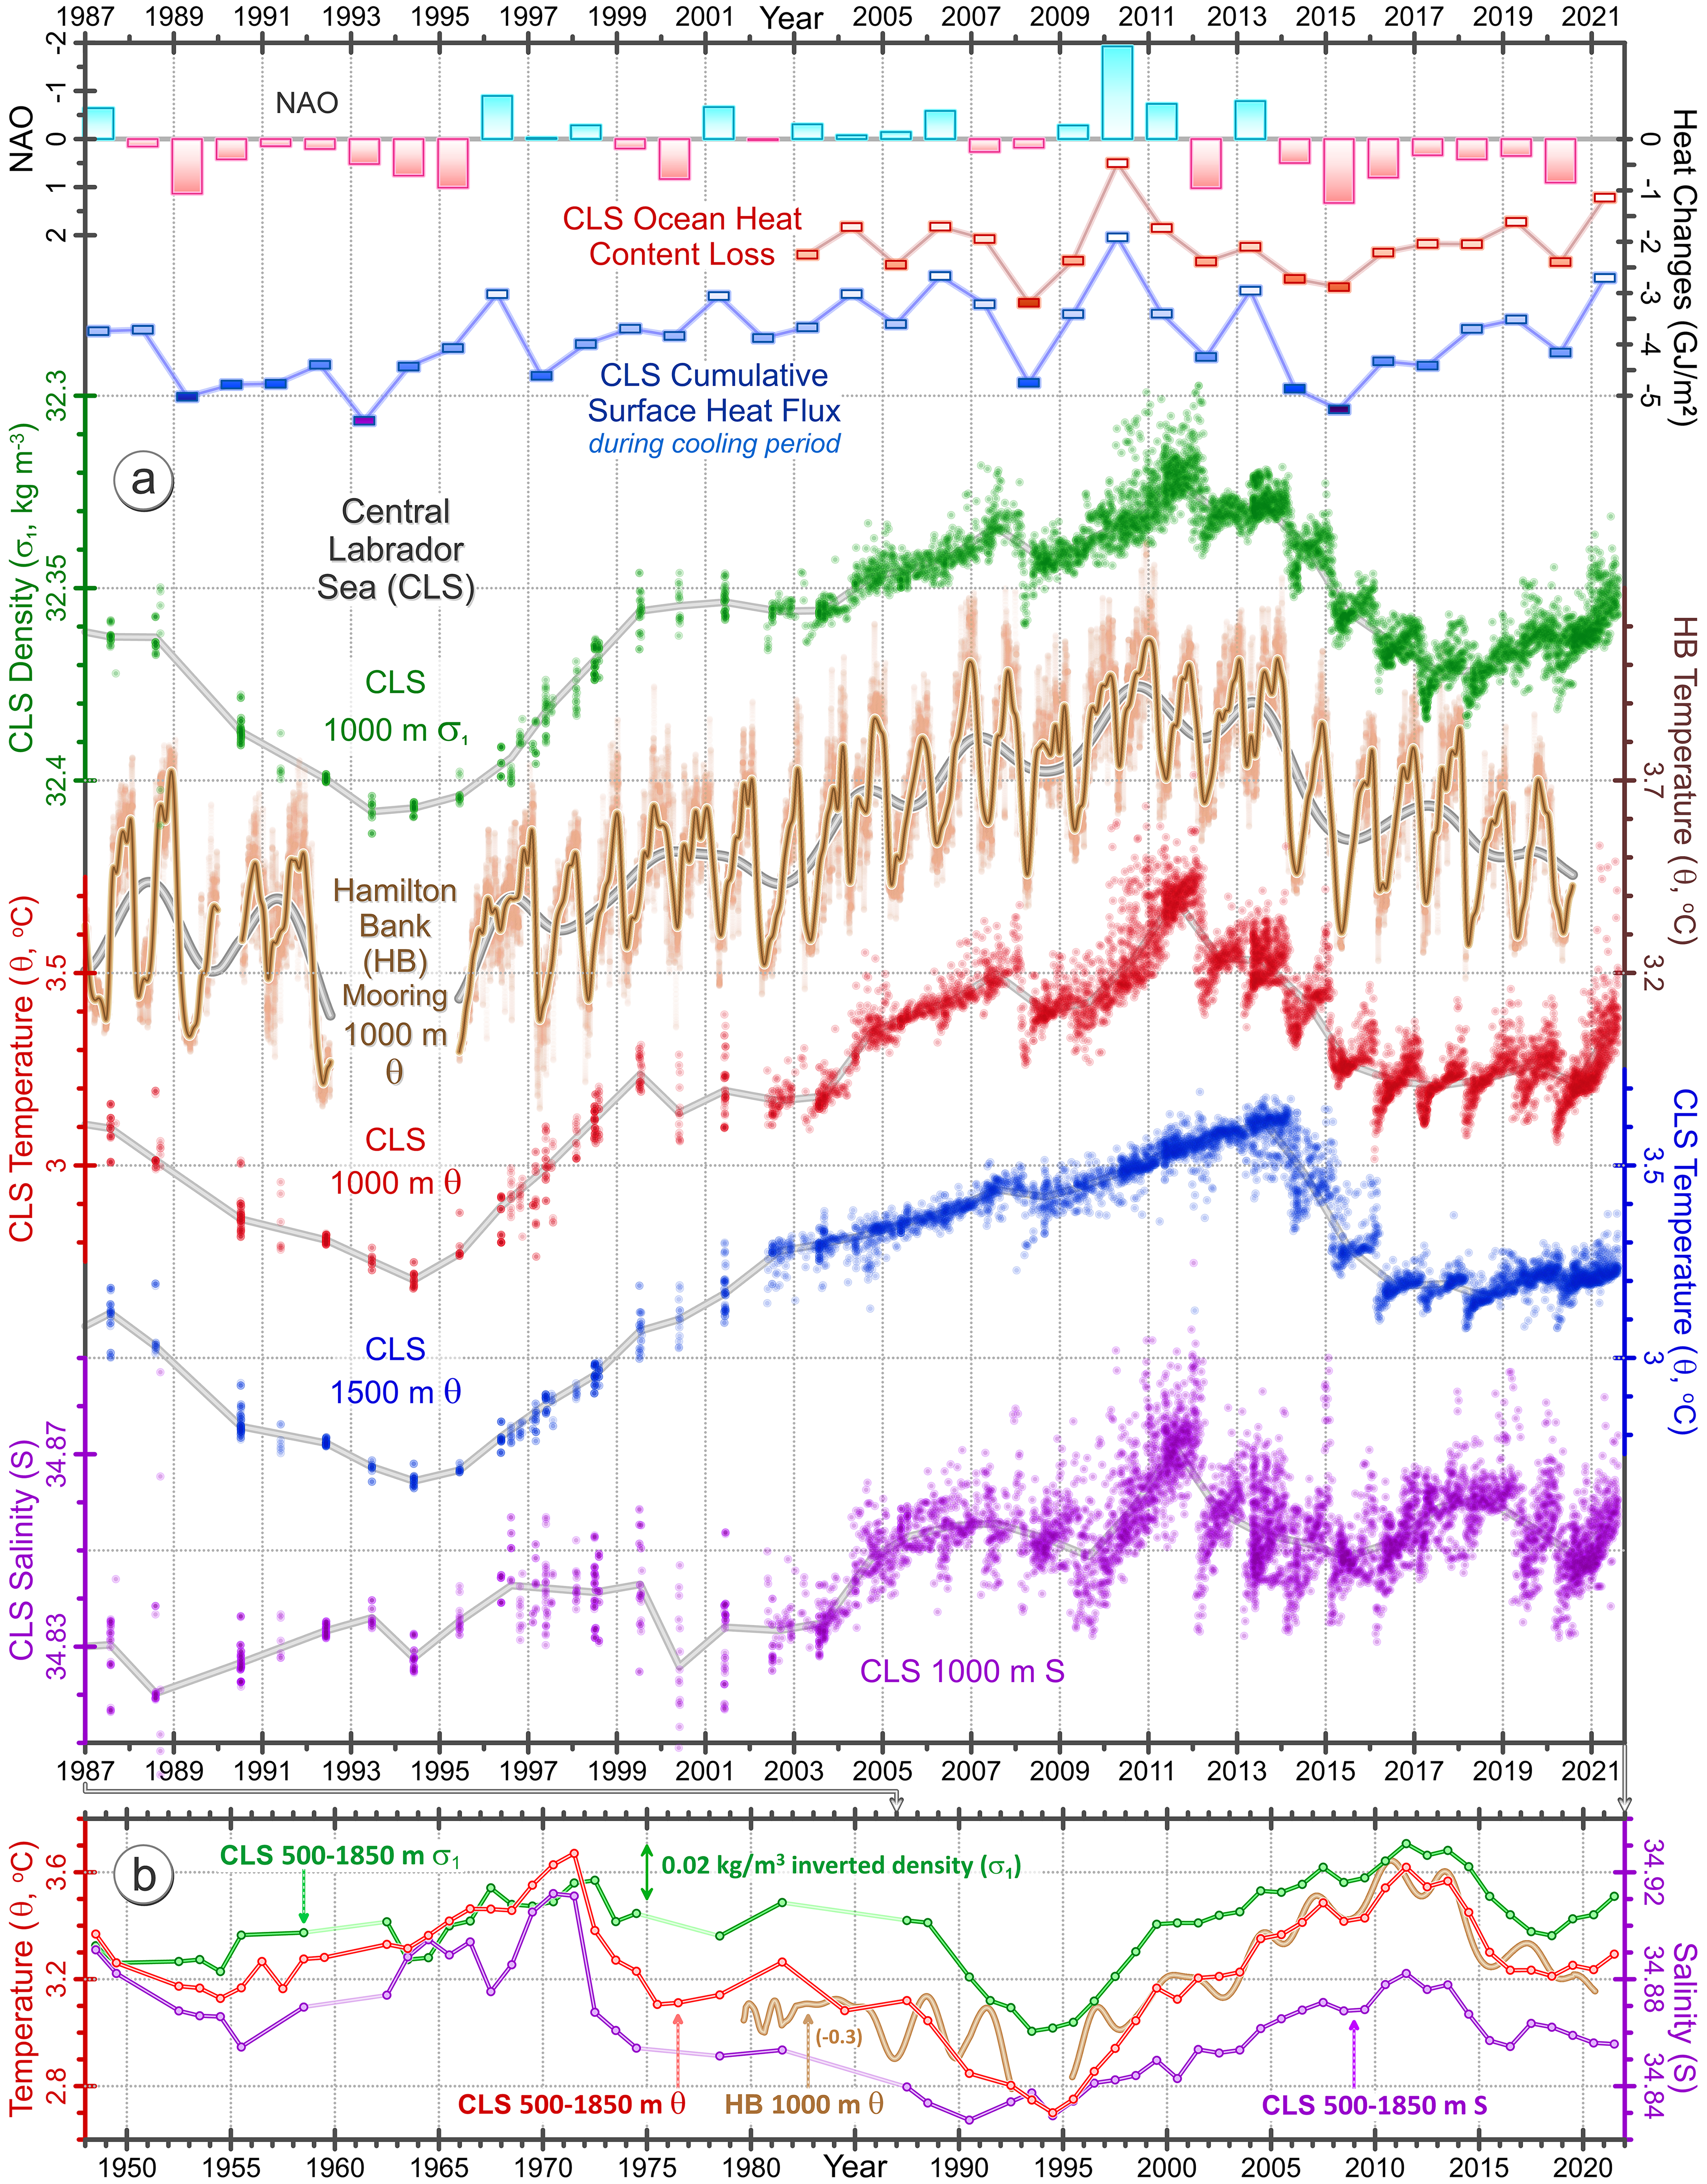
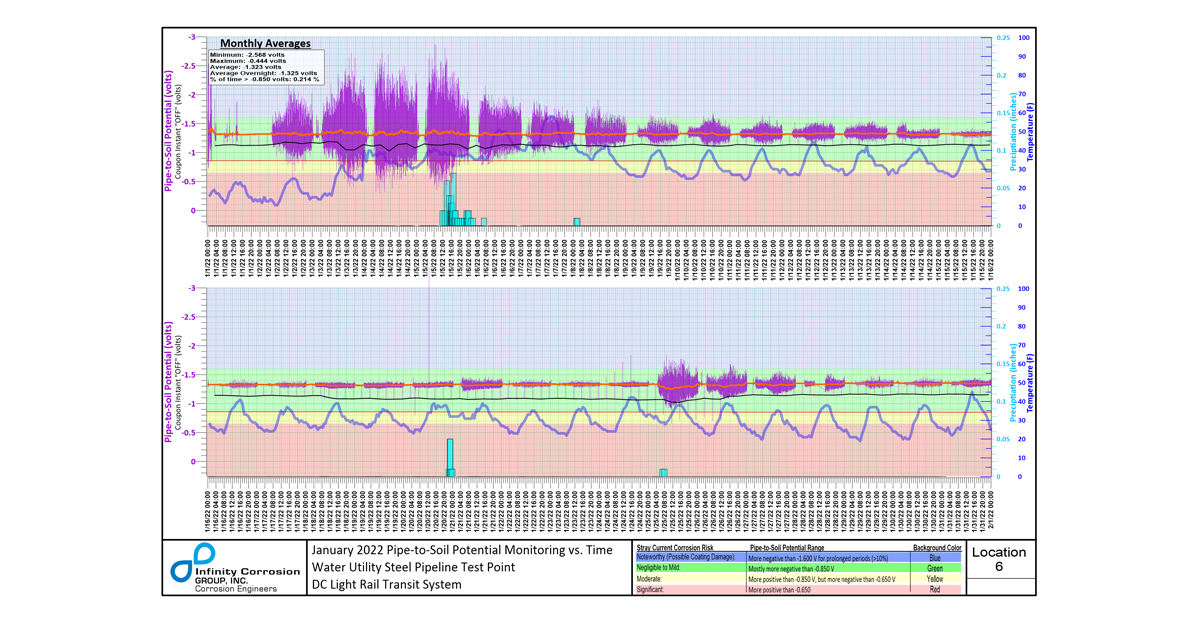
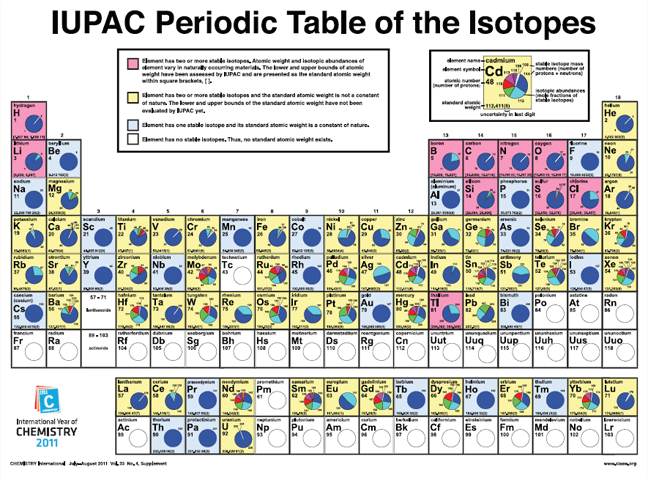
Grapher empowers engineers and scientists streamline their data visualization to clearly communicate complex datasets to a range of audiences with unparalleled speed and accuracy.
Visualize Complex Data with Ease
Making sense of complex datasets can be a challenge. Grapher meets this challenge head-on, offering an intuitive platform for creating stunning graphical representations. With Grapher, you have the power to simplify complex datasets, making them accessible and understandable.
Whether you’re generating plots for an industry presentation, updating quarterly reports for a client’s decommission project, or analyzing the environmental impact over time, Grapher not only conveys complex information clearly, it helps you do it with accuracy and elegance.
Your expertise deserves nothing less than the best in visualization.
Clearly Communicate Results to All Audiences
Your expertise is invaluable, but the true test is in communicating your results. Grapher bridges the gap between data and decision-makers, enabling you to present your findings in a manner that resonates with both technical and non-technical audiences alike.
From raw data to stunning visuals, your data is brought to life with Grapher.
Create Meaningful Graphs with Unparalleled Speed
In today’s fast-paced environment, efficiency is key. Grapher accelerates your data visualization process, allowing you to convert datasets into insightful graphs quickly. Embrace the power of rapid visualization to meet deadlines without sacrificing quality.
Automate Tedious Workflows, Maximize Your Impact
Data visualization often involves tedious processes that can bog down even the most seasoned professionals. Grapher empowers you with cutting-edge tools that streamline the painstaking aspects of data visualization, allowing you to focus on more complex, creative, and impactful endeavors.
Adopt a smarter, more efficient approach to data visualization.
Extend Your Team With Expert Support!
You love solving complex problems. So do we.
You’re pressed for time with demanding clients, budget pressures, and an ever growing to-do list.
We’re here to answer your questions quickly and unleash time-saving techniques tailored to your needs, empowering you to impress stakeholders and win clients.
We are the company you WANT to contact, and we are excited to hear from you.
| Comprehensive Library Of Scripts, Sample Files, & KBs
Starting from scratch can be daunting. Dive into Grapher’s extensive resource library for inspiration, guidance, and tools to kickstart your projects. From beginner to advanced, our resources are designed to elevate your visualization skills. |
Quickly Access Technical Reference Info From Anywhere
Whether you’re in the office or the field, Grapher’s online knowledge base and in-app help are at your fingertips. Find answers to your questions, learn new techniques, and discover best practices to enhance your modeling capabilities. |
Useful Information
The most recent version of Grapher is 25.1.247 released May 13, 2025.
Packed with new features and improvements, these updates are available to users with an active software subscription or software maintenance.
Explore the latest release: New Features in Grapher?
The most recent version of Grapher Beta is 26.0.148 released May 13, 2025. Grapher Beta is available to users with an active software subscription or software maintenance.
We support only the current version of Grapher. Emergency fixes to previous versions are released at our discretion.
Grapher is a Windows based, desktop software.
For Mac, Linux, or Unix users, Grapher can be run using your preferred Windows emulator. We recommend testing the functionality with our trial version before purchasing.
System requirements
- Windows 10, 11, and higher
- 64-bit operating system support
- 1024 x 768 or higher monitor resolution with minimum 16-bit color depth
- At least 1GB free hard disk space. 500GB or larger hard drive with 25% disk space available recommended
- 2GB RAM minimum, 16GB RAM recommended
- .NET Framework 4.8
Single-user license: This license may be used by a single individual. They are ideal for a single user, an individual who needs access to Grapher at any point, or those who frequently visit client sites or are away from the office.
Concurrent-use license: Also called a “network” or “floating” license, is tied to a network and Grapher can be installed on as many client machines as desired. The number of users who can use Grapher at a given time is limited by the number of seats purchased.
Both license options are available in a subscription or perpetual plus maintenance model.
Subscription license: Access to the latest version of Grapher for either a monthly or annual term with automatic renewal.
Perpetual license: A one-time purchase that gives you lifelong access to Grapher. The first year of software maintenance is included and at the end of the year, you must renew software maintenance to continue receiving the latest Grapher releases.
For further information on licensing, review the Licensing articles or our End User License Agreement.
Golden Guarantee
100% Satisfaction Guaranteed or 100% of Your Money Back
We know Surfer and Grapher’s visualization capabilities will help you stand out from the crowd, WOW clients, and leave a lasting impression!
But… we realize you don’t know this yet. And you won’t until you experience our products for yourself.
This is why we provide this guarantee. This is the distillation of a 40+ year adventure designing, developing, and honing powerful visualization and analysis features as requested by scientists and engineers like you.
Our products can produce results far beyond its license fees. We are assuming all your risk, so you have none.
TESTIMONIALS
Hear what other scientists & engineers have to say!
Golden Software is like a close family. Your team is always ready to answer questions, to solve problems, your products are of fine quality, low prices for updates.
Thierry Hatt
Historical GIS Cartographer Université de Strasbourg, France
We have been Golden Software clients for 35 years and have never been disappointed. For us, it’s the premier data presentation package.
Felicia Bechtel
Senior Geophysical Advisor
Golden Software products are the most intuitive of any software I've ever used.
Anna Klene, PhD
Professor
