Environmental Insights: An Expert’s Approach to Modeling Geophysical Survey Data in Surfer
Join Golden Software for an exclusive webinar featuring John Vanderlaan, owner of Prism GeoImaging, as he demonstrates how geophysical survey data is transformed into actionable subsurface insights using Surfer.
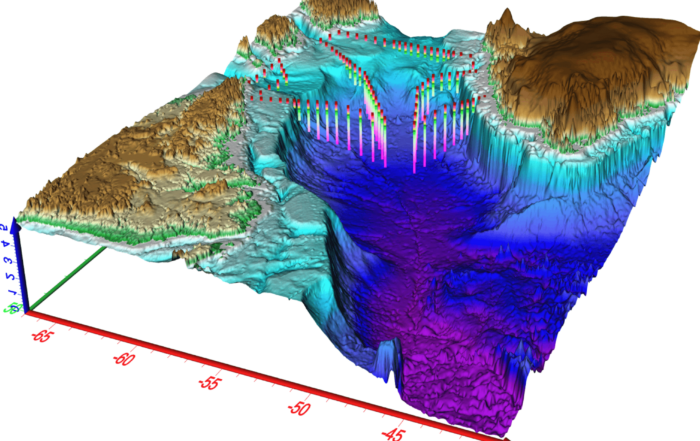
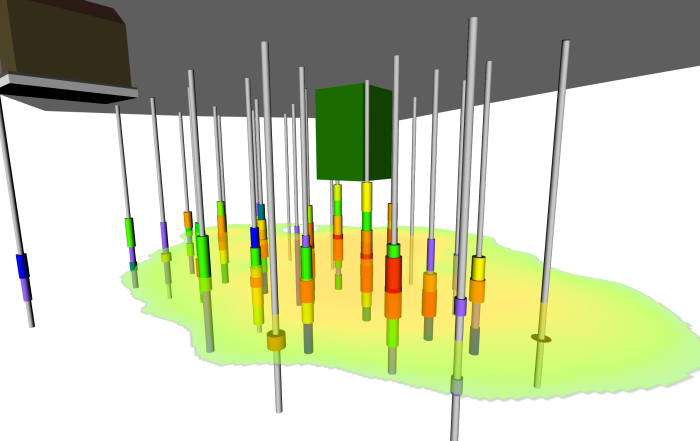
In this session, John will walk through the workflow his team uses on real-world projects to characterize subsurface conditions and support informed engineering and environmental decisions. Alongside Drew from Golden Software, you’ll see how geophysical survey data is integrated into Surfer to create detailed 3D visualizations of site geology, identify the top of the bedrock surface, and communicate findings through professional-quality report figures.
The webinar concludes with a look at the final deliverables provided to the client and the recommendations that were made based on the completed Surfer model.
In this webinar, you’ll learn how to:
- Understand the geophysical survey methods used by Prism GeoImaging to investigate subsurface conditions
- Visualize geophysical data in Surfer to build an accurate 3D site characterization
- Select appropriate geophysical survey techniques based on project objectives and site conditions
- Model the extent and elevation of the subsurface bedrock surface
- Create presentation-ready figures and communicate results that support client recommendations and project decisions
This webinar is ideal for anyone looking to improve mapping accuracy and confidence in their spatial data workflows, including:
- Environmental professionals
- Hydrogeologists
- Remediation specialists
- Engineers
- Geologists
- Geophysicists

Past Webinars
Master Coordinate Systems and Map Projections in Surfer
What’s New in Surfer 31 Webinar
From Borehole Logs to 3D Models: A Smarter Subsurface Workflow
Tackling the PFAS Crisis with Surfer