More from Katie Yoder:
- Sep 10, 2024|Katie Yoder|5 min
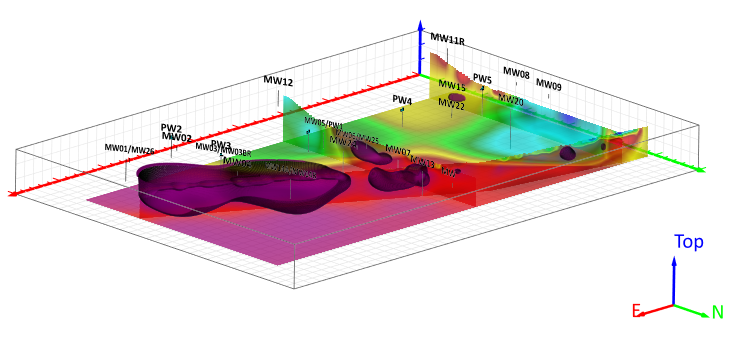
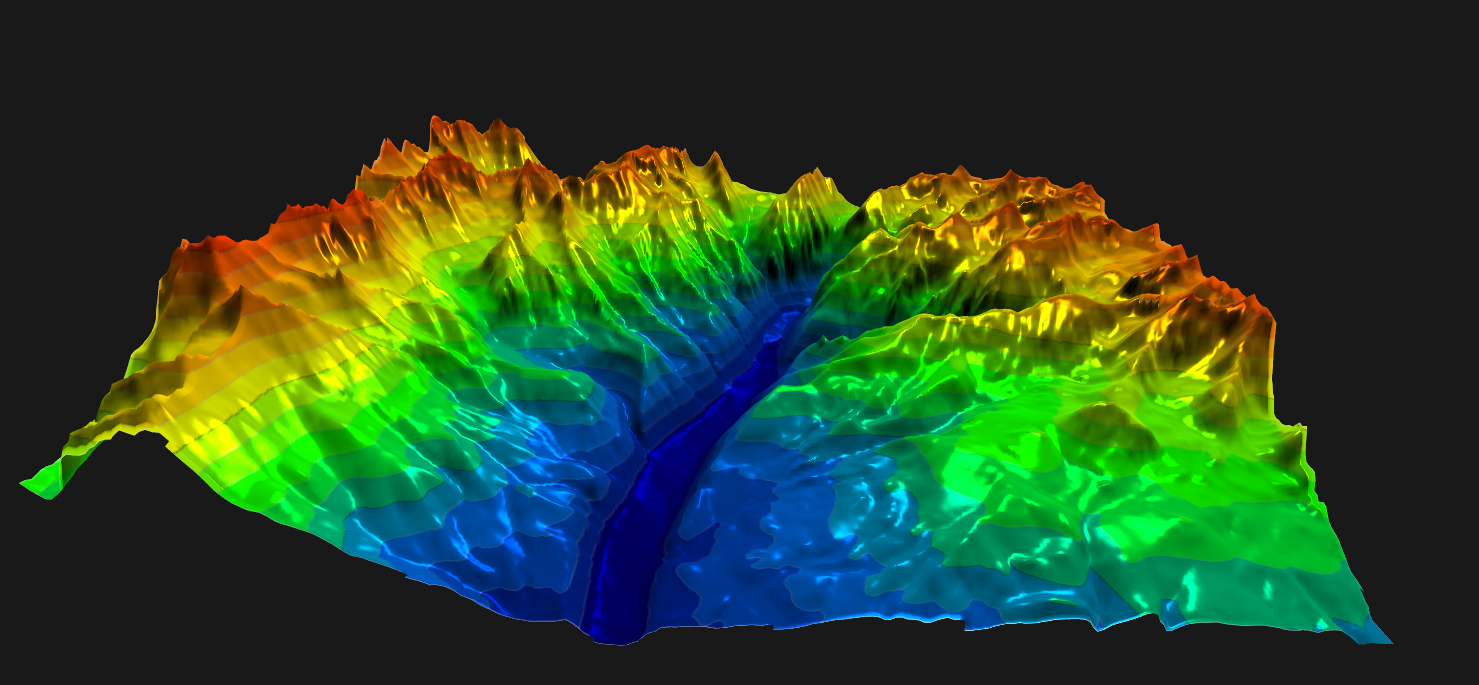
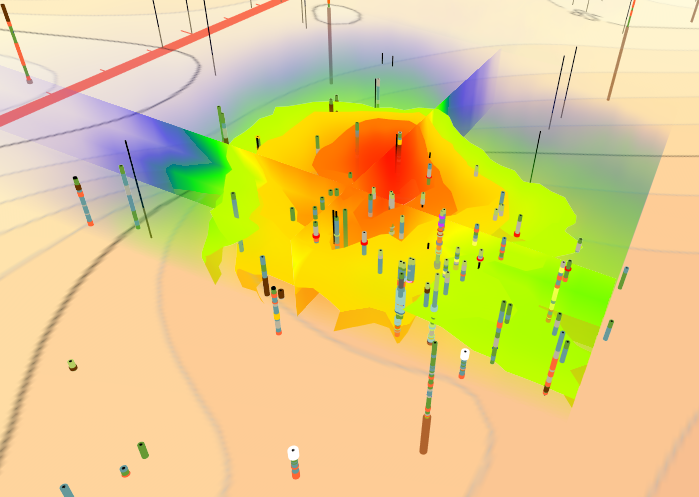
The latest version of Surfer adds 3D modeling functionality that include dynamic visualization tools and improved export and collaboration options.
- Sep 4, 2024|Katie Yoder|4 min
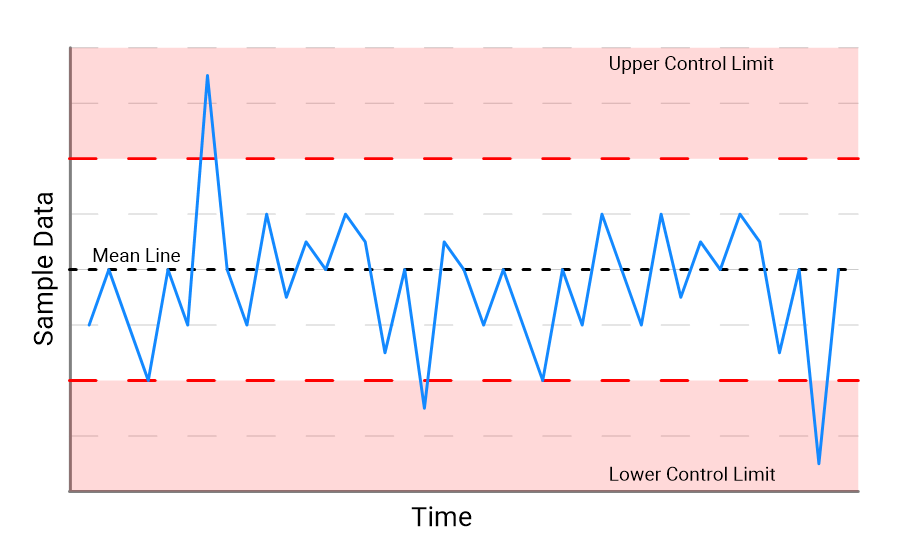
SPC charts are a powerful asset and are widely used across various industries for monitoring, controlling, and enhancing processes.
- Aug 1, 2024|Katie Yoder|4 min
Surfer and Grapher frame templates are designed to help you quickly create professional reports so you can spend more time doing what you love.
- Jul 25, 2024|Katie Yoder|7 min
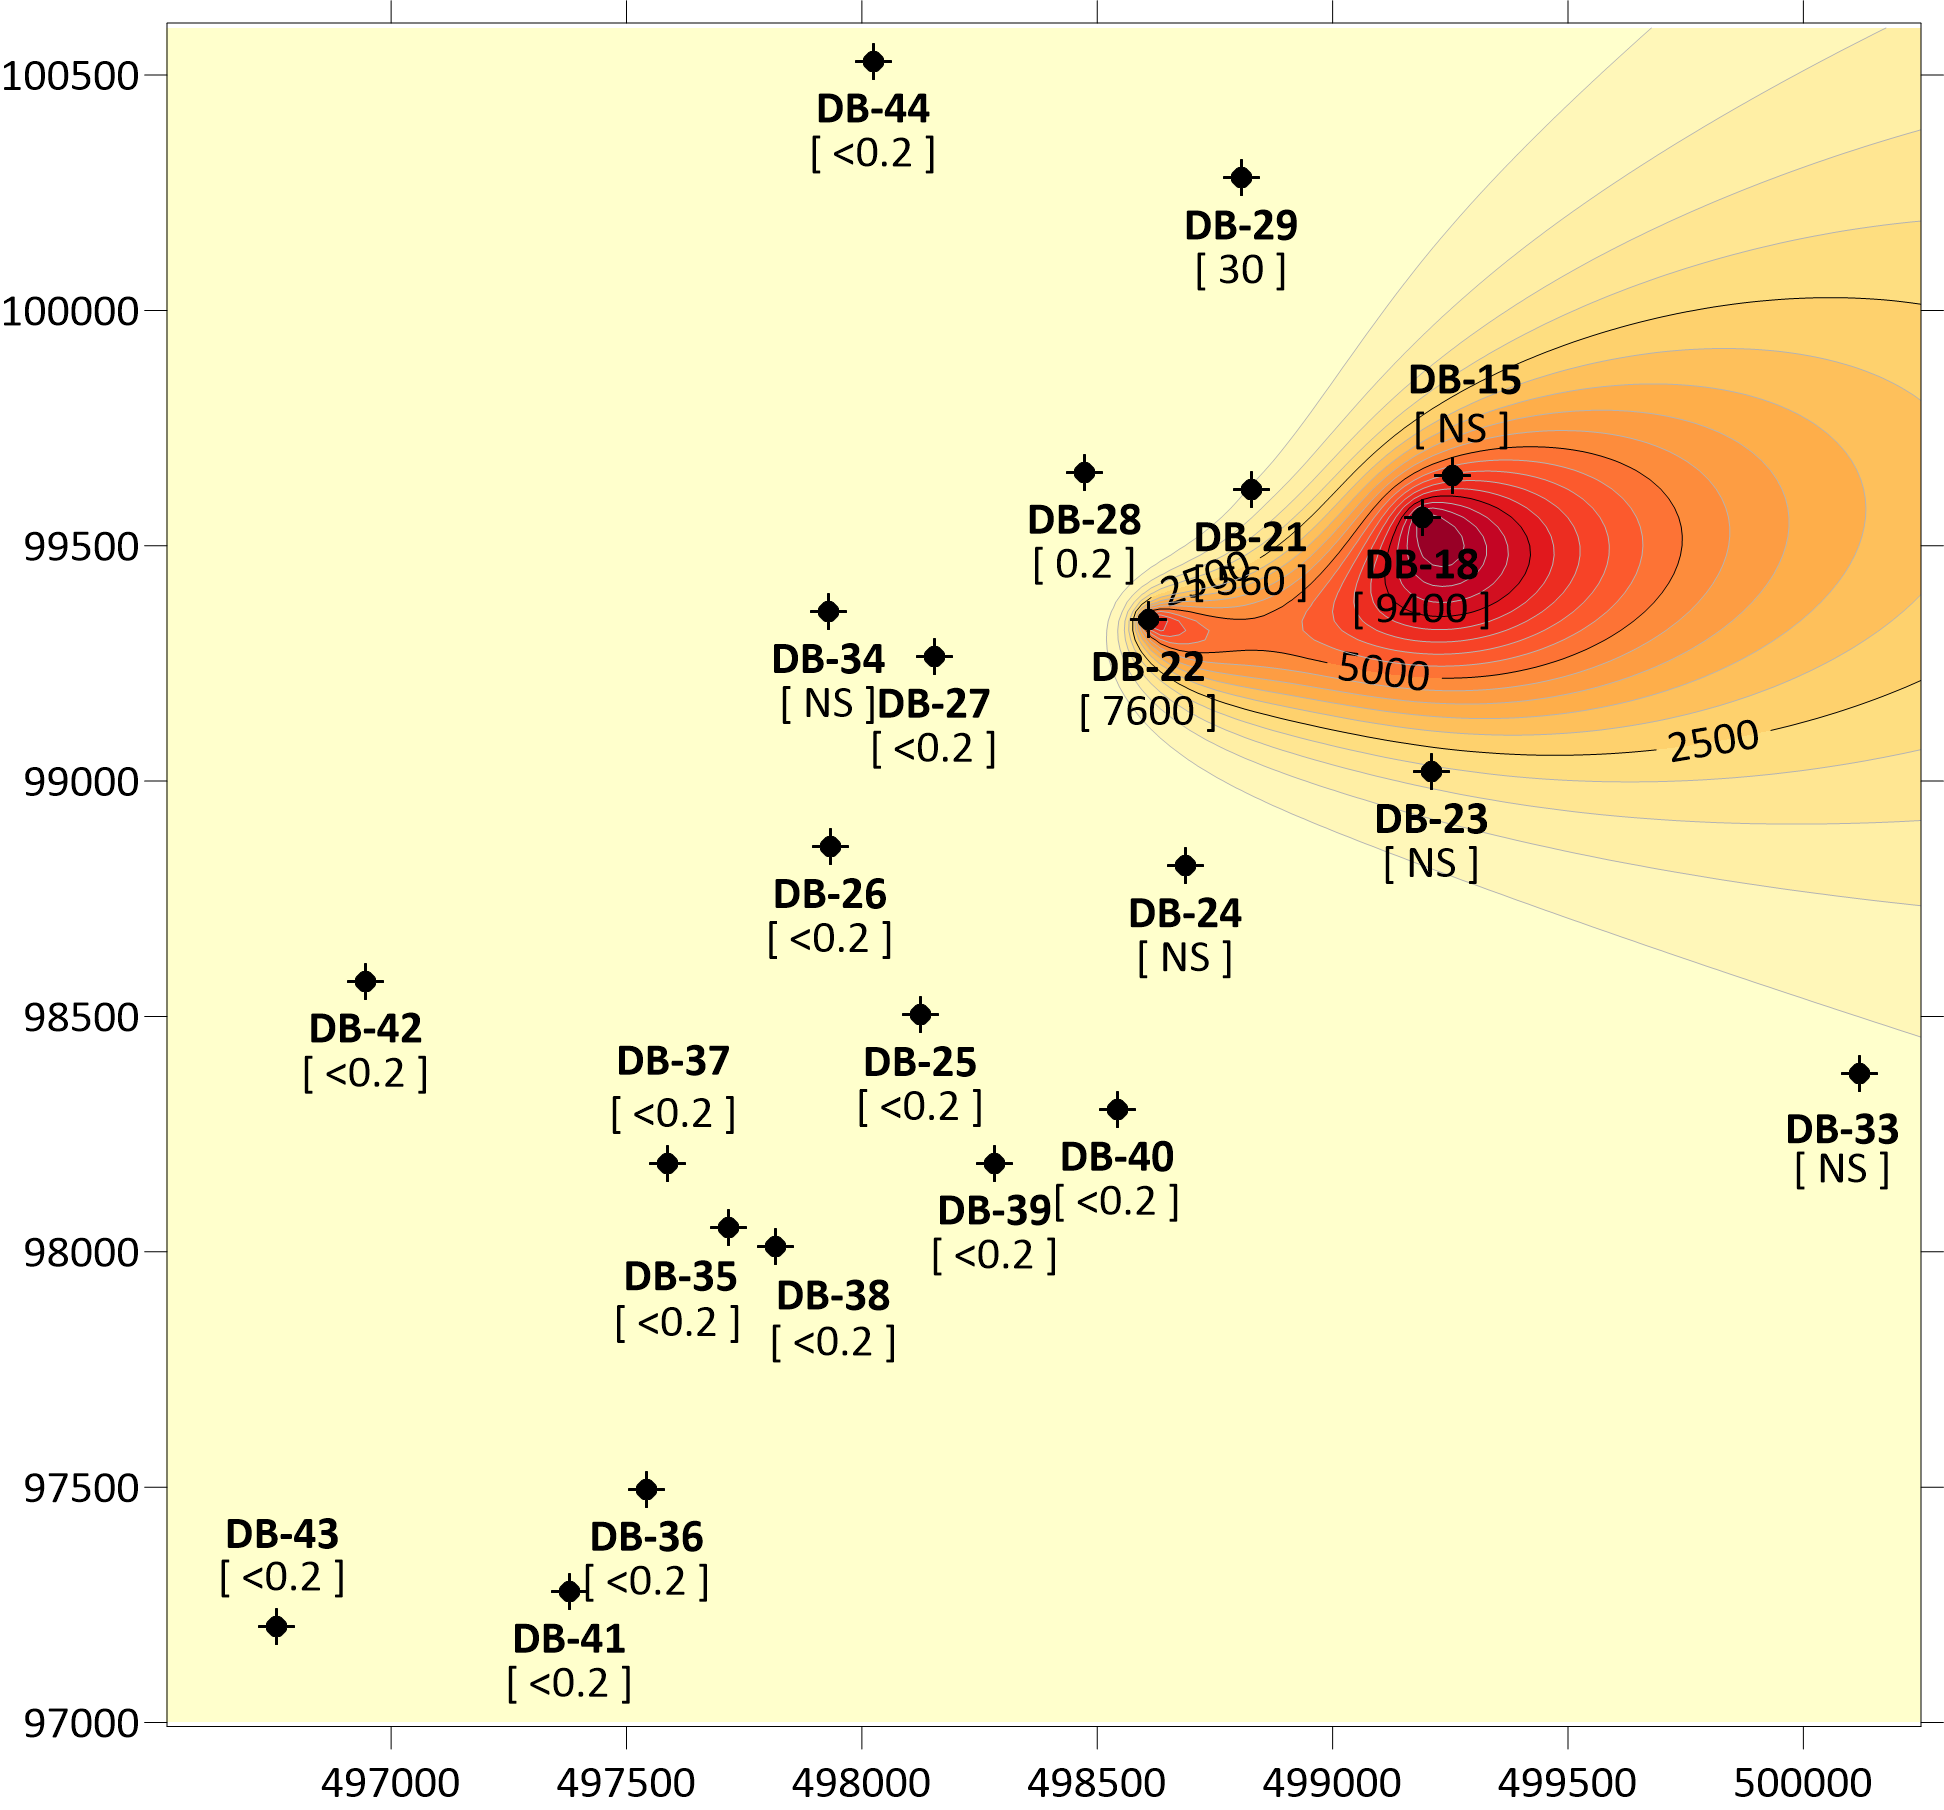
Gridding concentration data comes with some unique challenges that can be overcome by using these five best practices!
- Jun 13, 2024|Katie Yoder|6 min
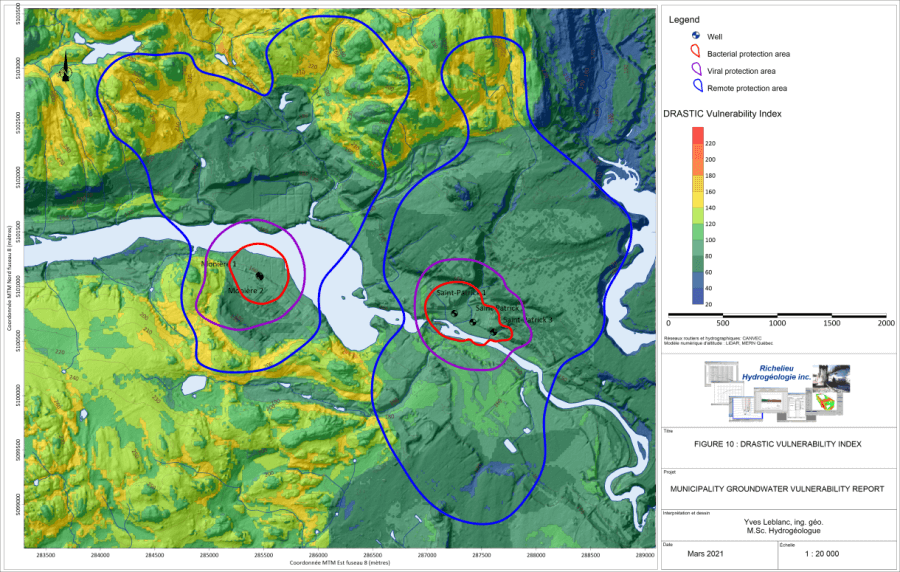
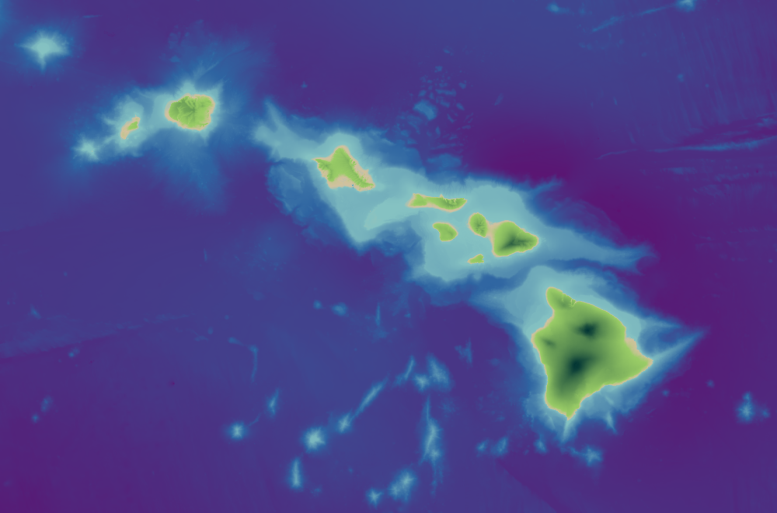
Imagine transforming a sea of numbers and charts into a captivating visual story. That's the power of effective color mapping in data visualization.
- May 30, 2024|Katie Yoder|3 min
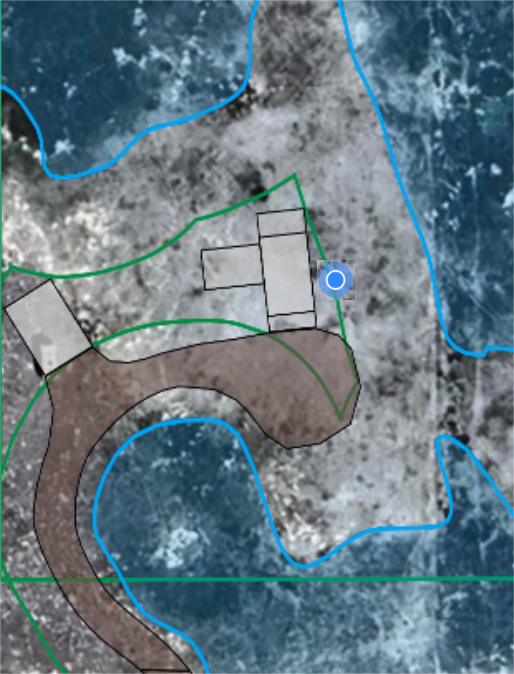
Use Google Earth and a KML version of your site map to see exactly where you are on the site, add points of interest, take photos, and add notes.
- May 23, 2024|Katie Yoder|2 min
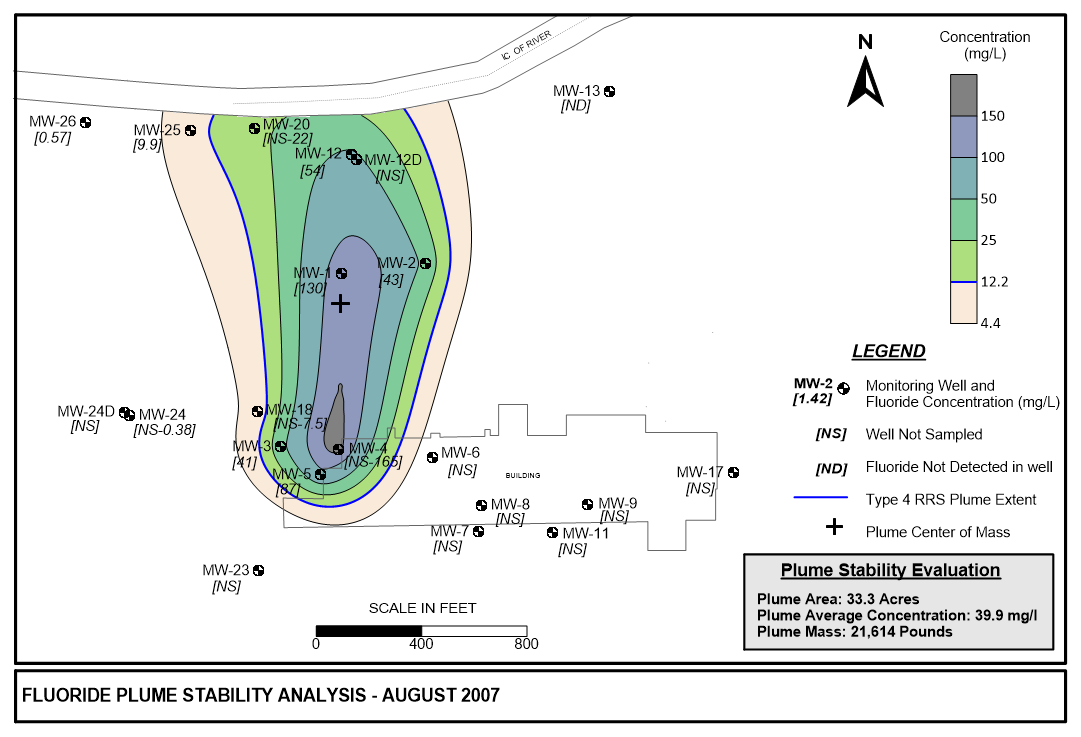
The Ricker Method for plume stability analysis helps engineers communicate meaningful patterns in environmental data
- Feb 27, 2024|Katie Yoder|3 min
The latest version of Surfer adds 3D modeling functionality that include dynamic visualization tools and improved export and collaboration options.
- Feb 9, 2024|Katie Yoder|3 min
Zach Dickson, principal hydrogeologist, recently shared how he uses Surfer to model his site characterization and forensic analysis data.