- Jul 8, 2026|Gabbie Rhodes|14 min read
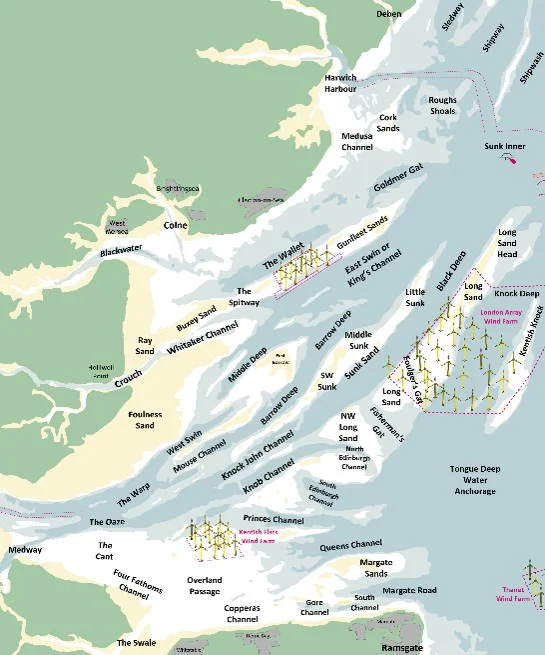
Roger creates passage and tide tables that help mariners understand when and how they can move through the Thames Estuary’s swatchways.
About Golden Software
Since 1983, Golden Software has been at the forefront of scientific data visualization.
Today, we empower professionals to solve real-world problems by transforming complex data into clear, impactful visual stories through our industry-leading software and legendary customer support.
Surfer – Create an Immersive 2D/3D Model in Under 2 Minutes!
Grapher – If You Can Imagine It, You Can Graph It!
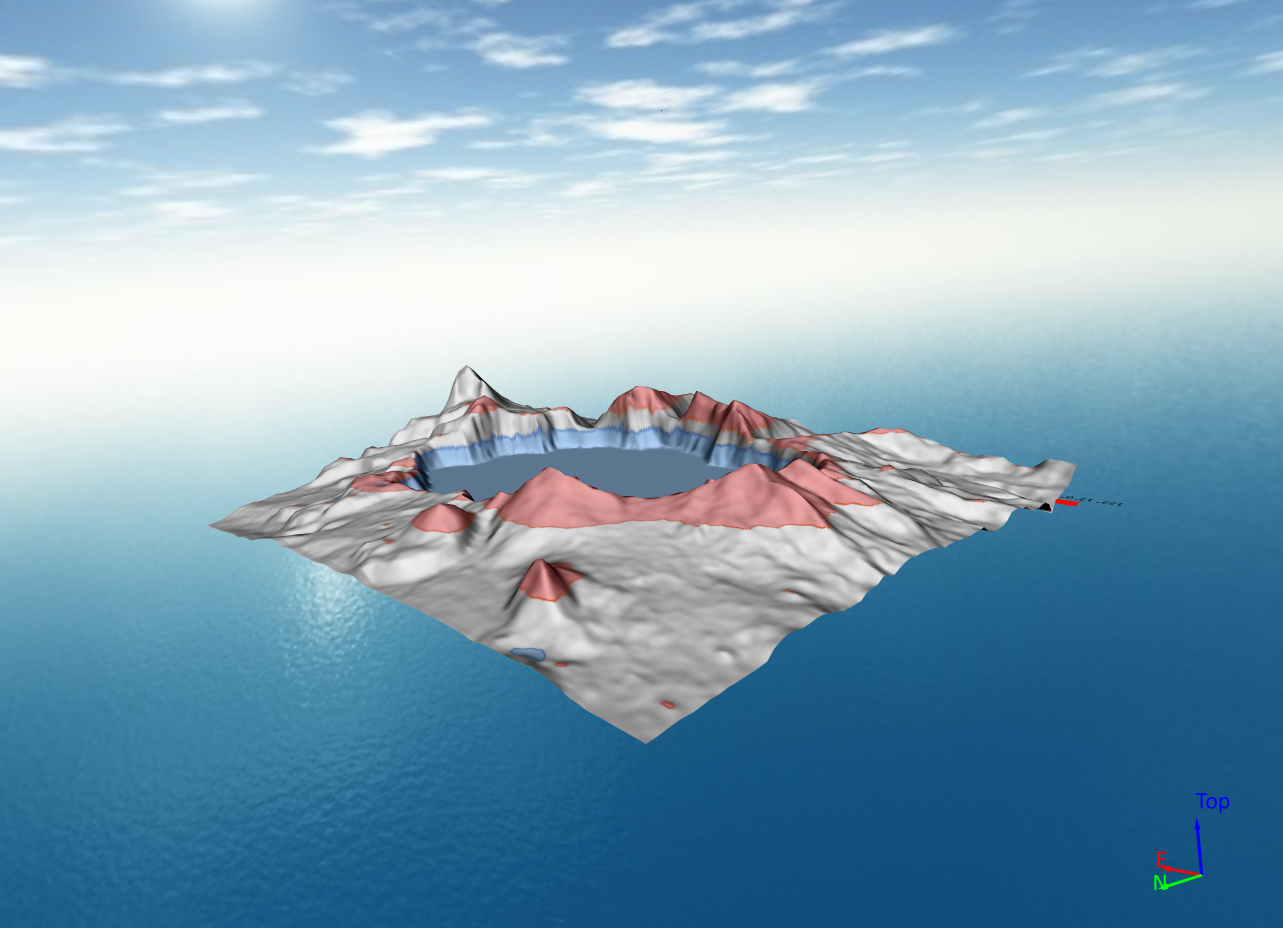
- Jan 14, 2026|Gabbie Rhodes|4 min
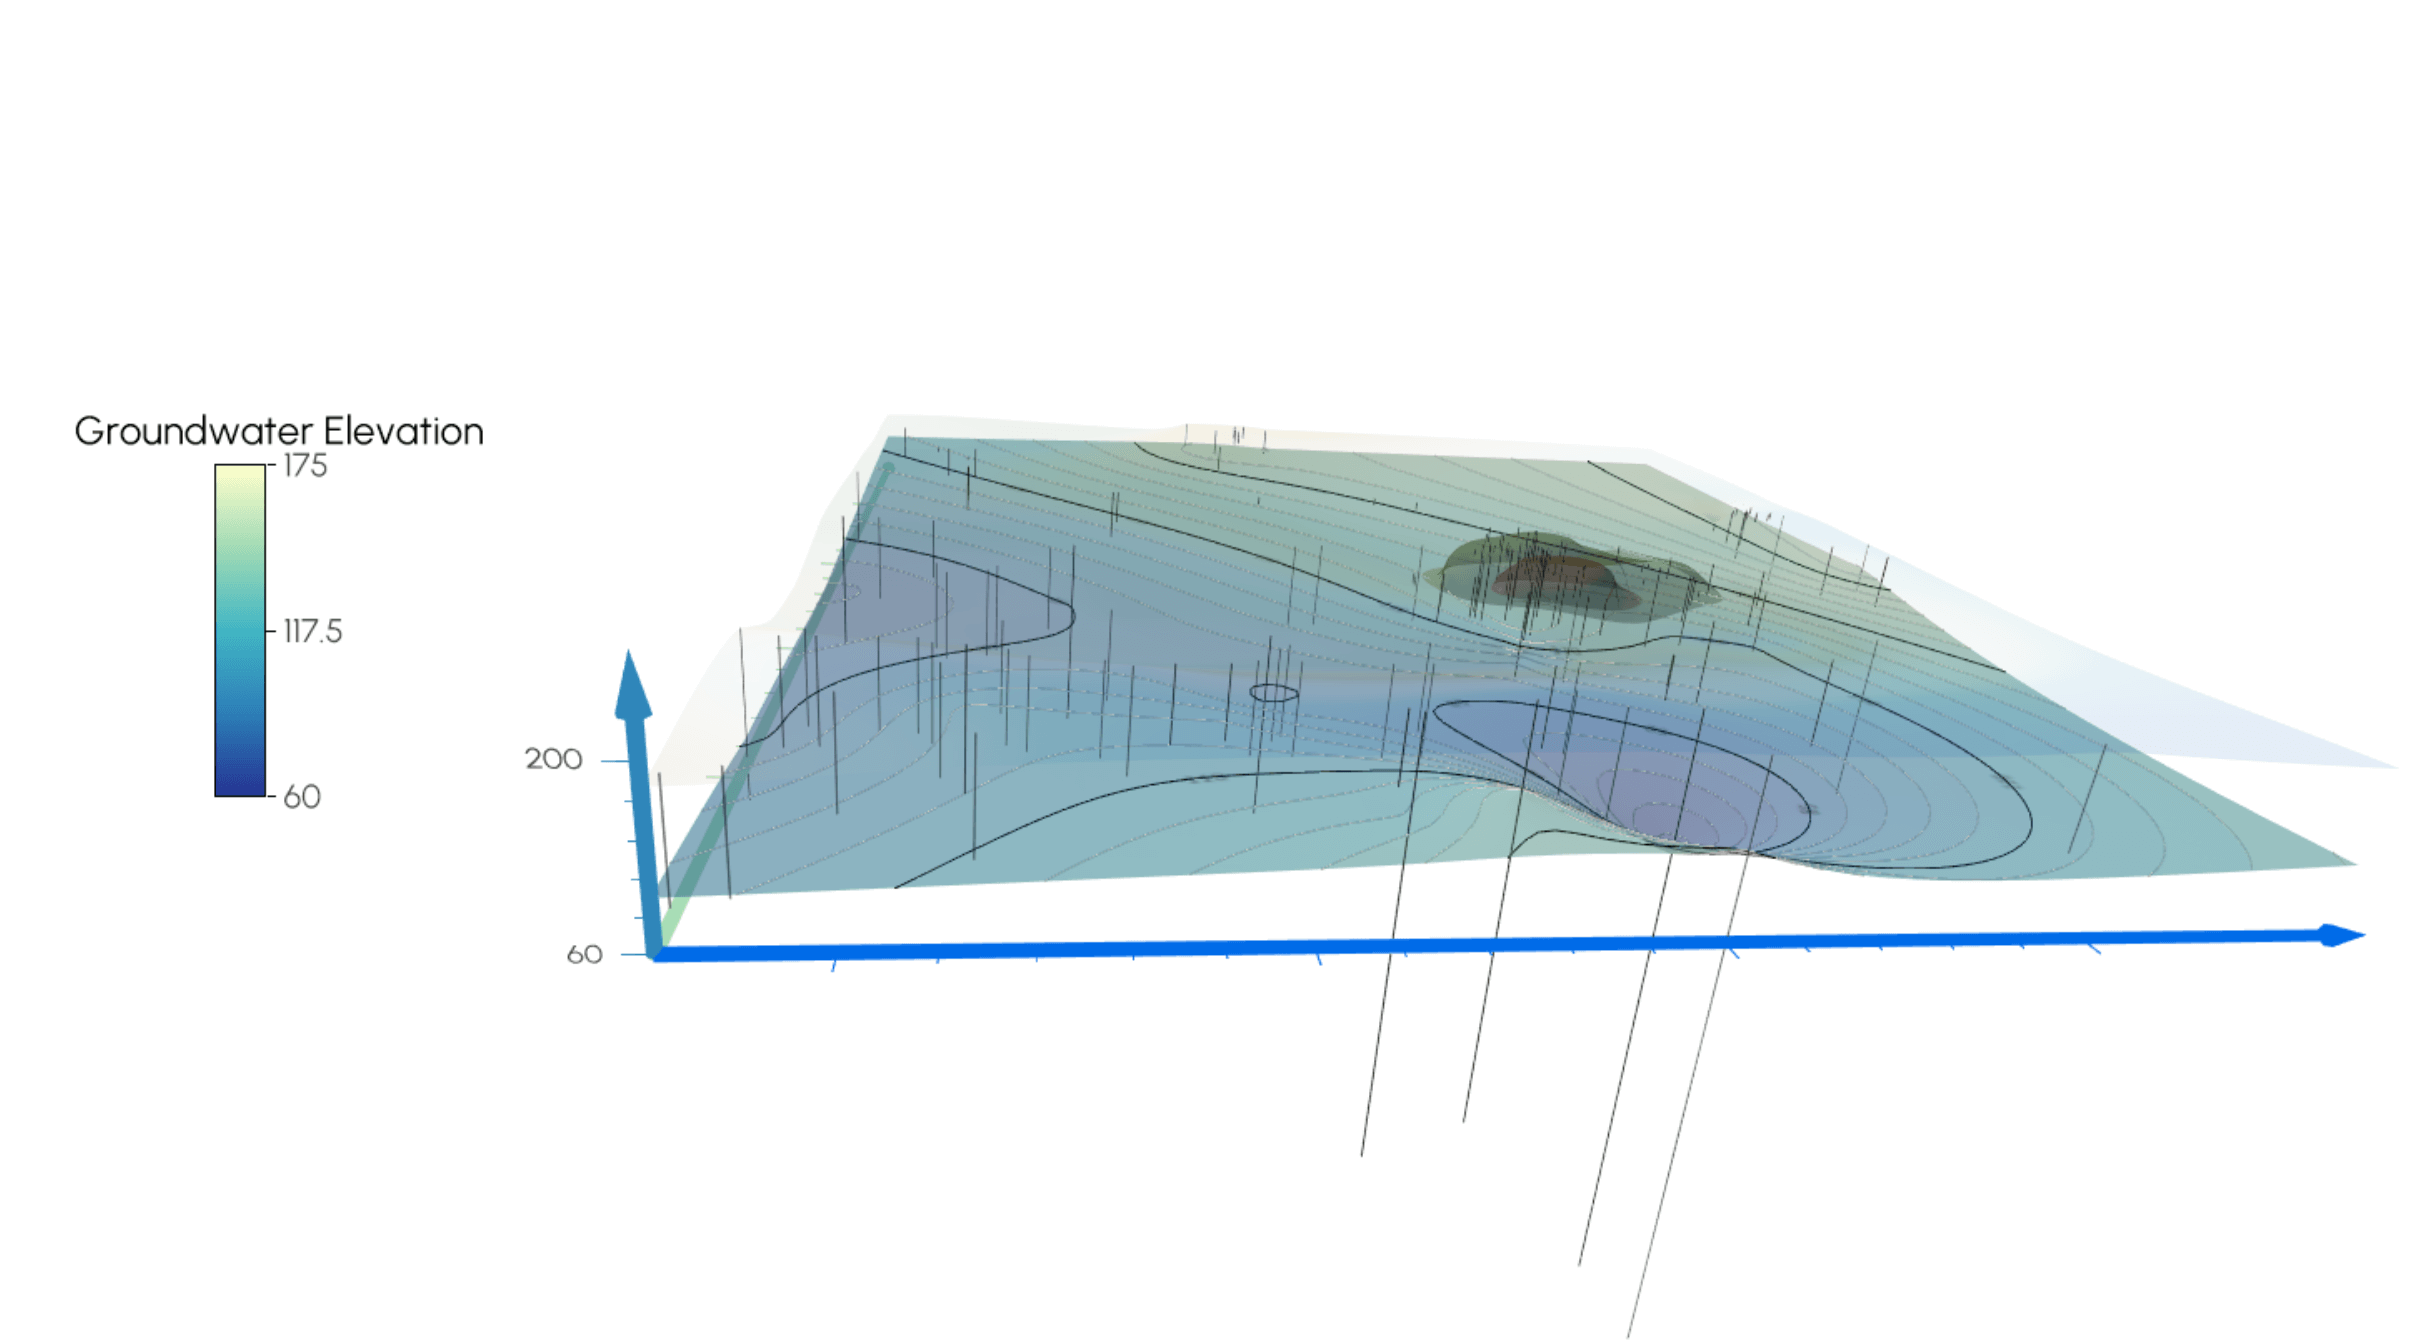
3D data visualization is innovating many industries, including water resource management. With 3D models, insights are easier to see. Learn more.
- Jan 6, 2026|Gabbie Rhodes|6 min
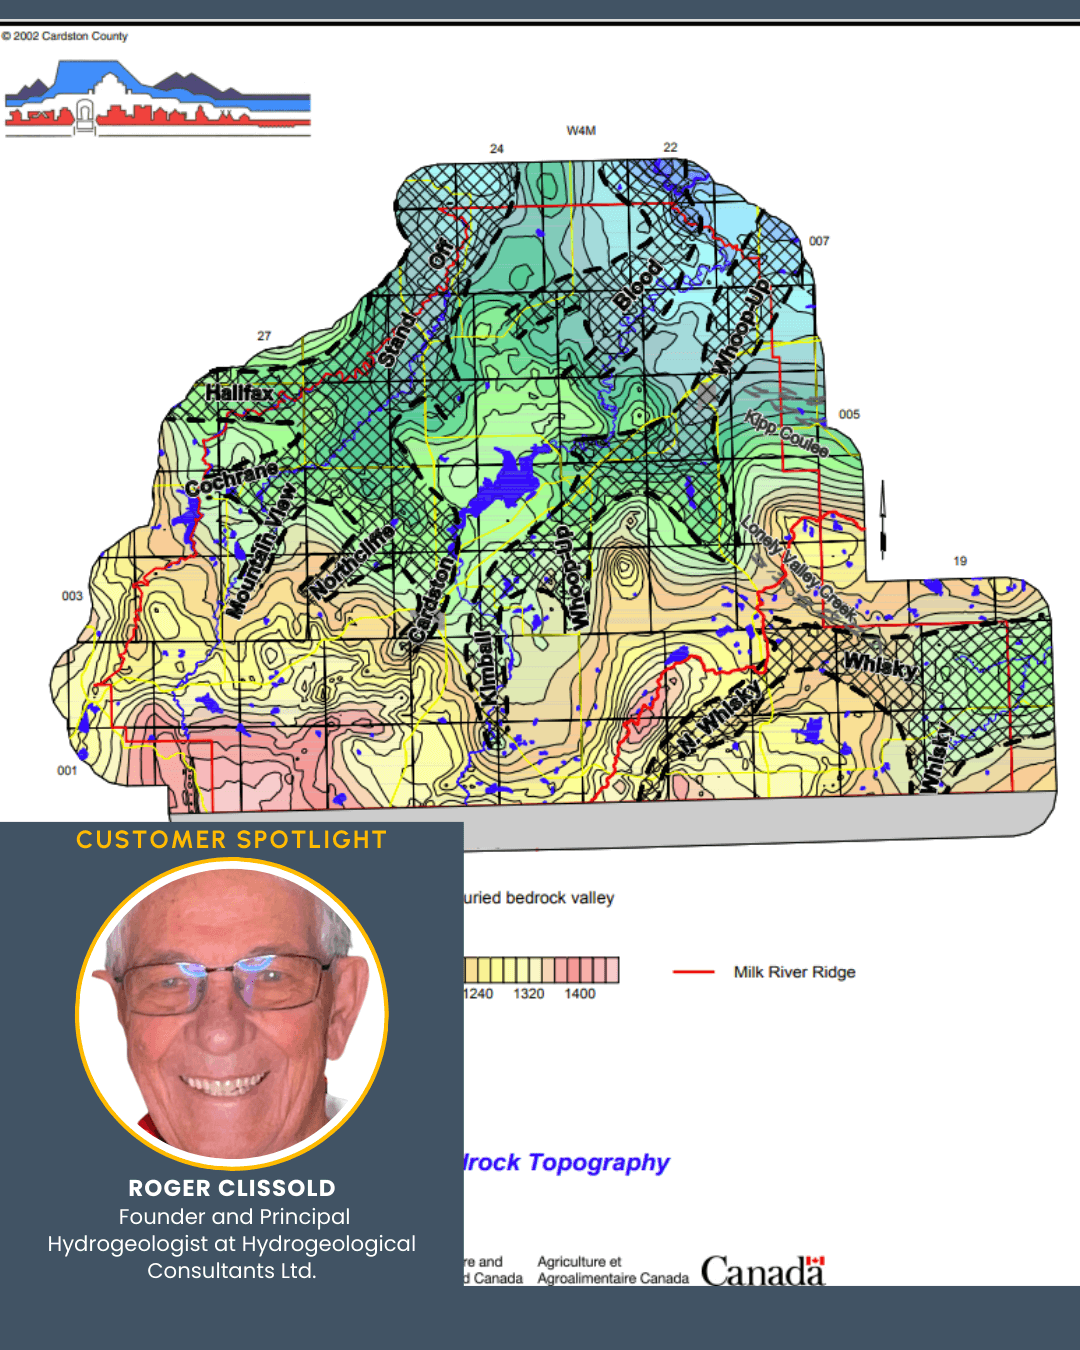
Gridding methods such as Kriging helped Hydrogeological Consultants Ltd. map groundwater resources for 40% of Alberta, Canada. Learn more.
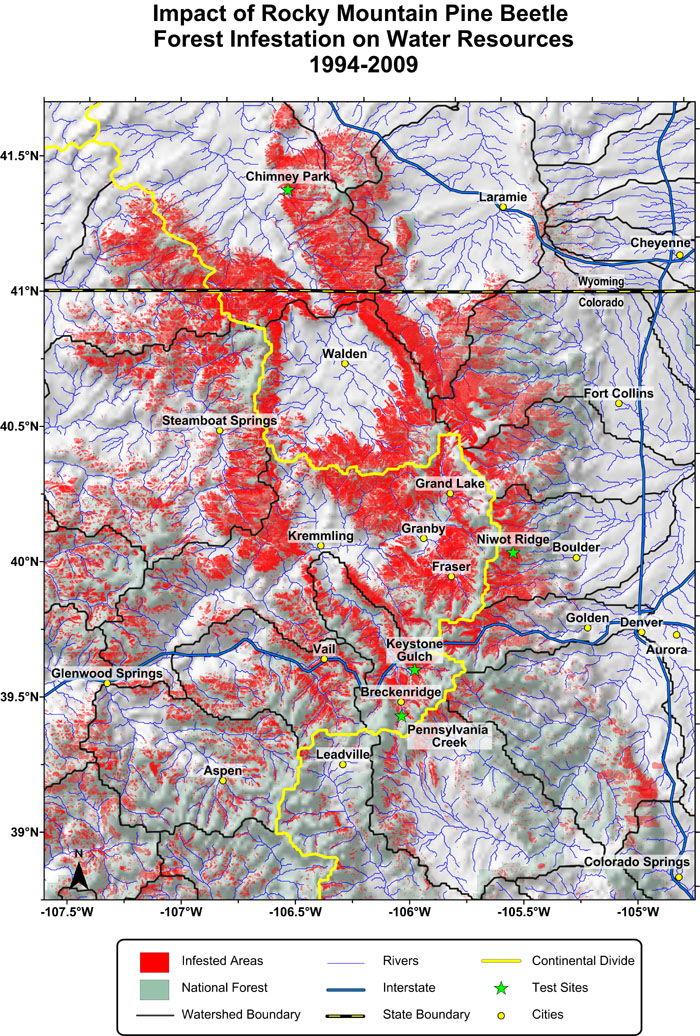
- Nov 26, 2025|Gabbie Rhodes|5 min
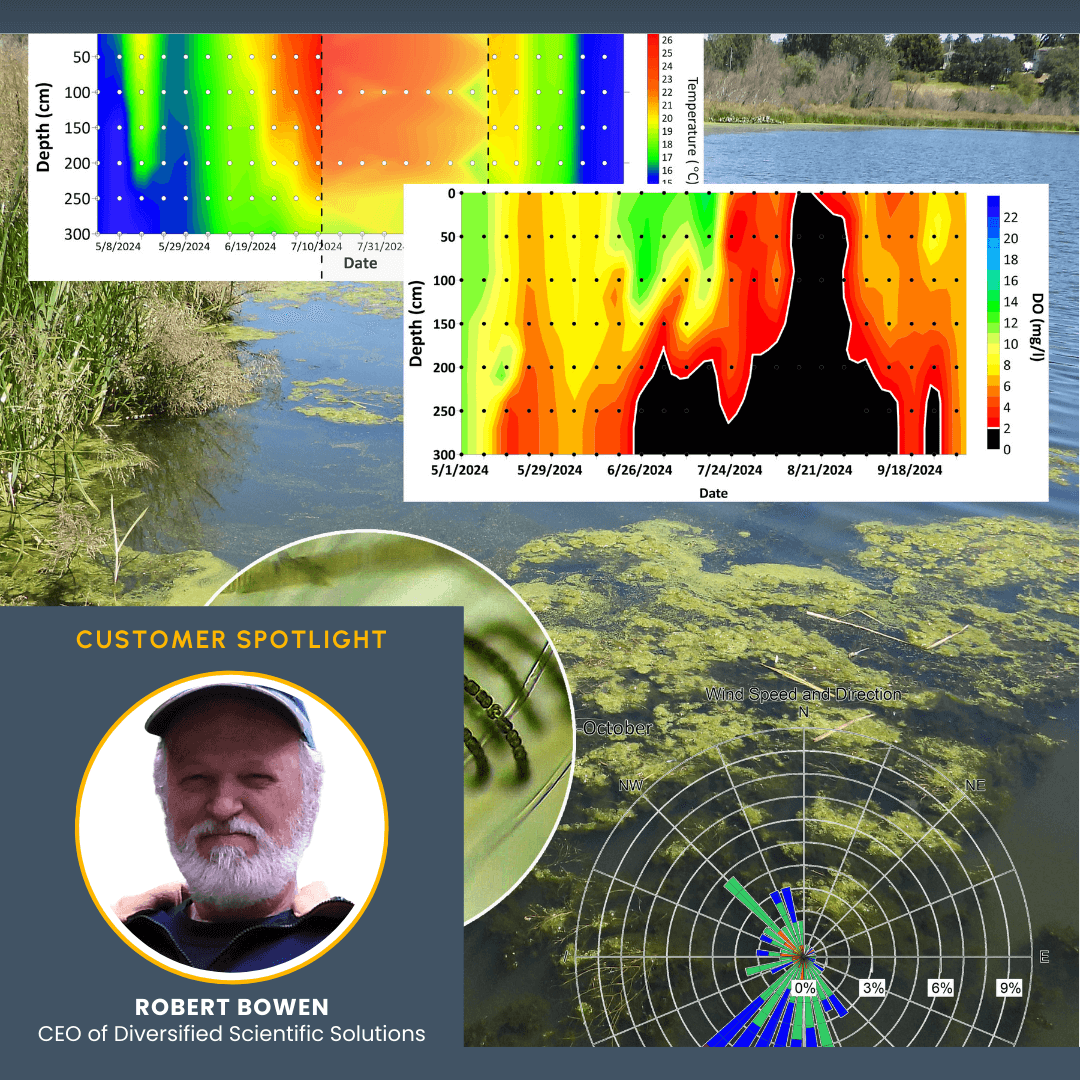
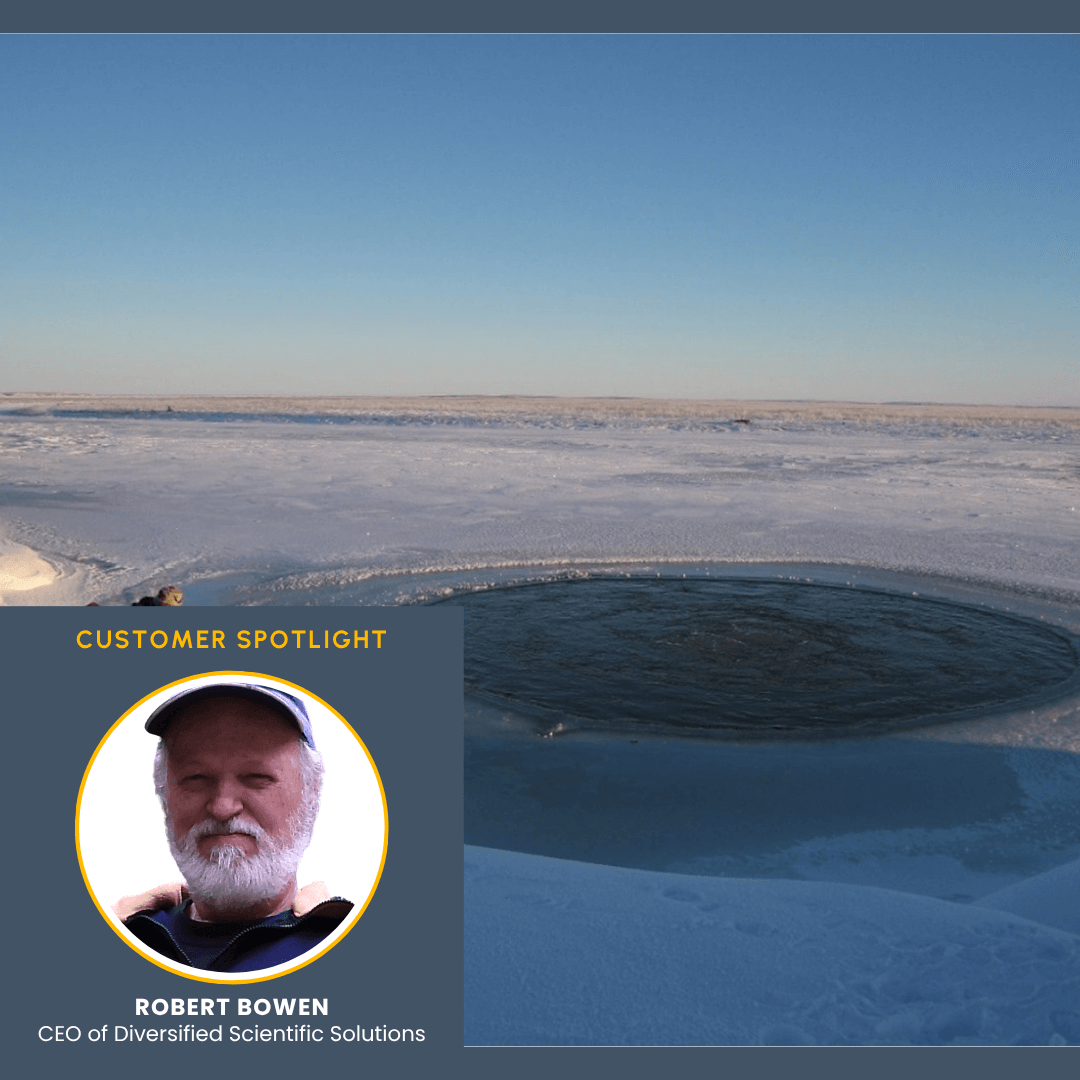
Robert Bowen, CEO of Diversified Scientific Solutions, has been returning to Swan Lake to better understand its health. Discover what he's learned.
- Oct 27, 2025|Gabbie Rhodes|4 min
Rob Bowen was tasked with quantifying greenhouse gas emissions from degrading permafrost in the Mackenzie Delta. Learn how he did it.
- Aug 28, 2025|Gabbie Rhodes|5 min
Do you regularly assess water quality for stakeholders? Then, you need to transform your water quality data into great visualizations.
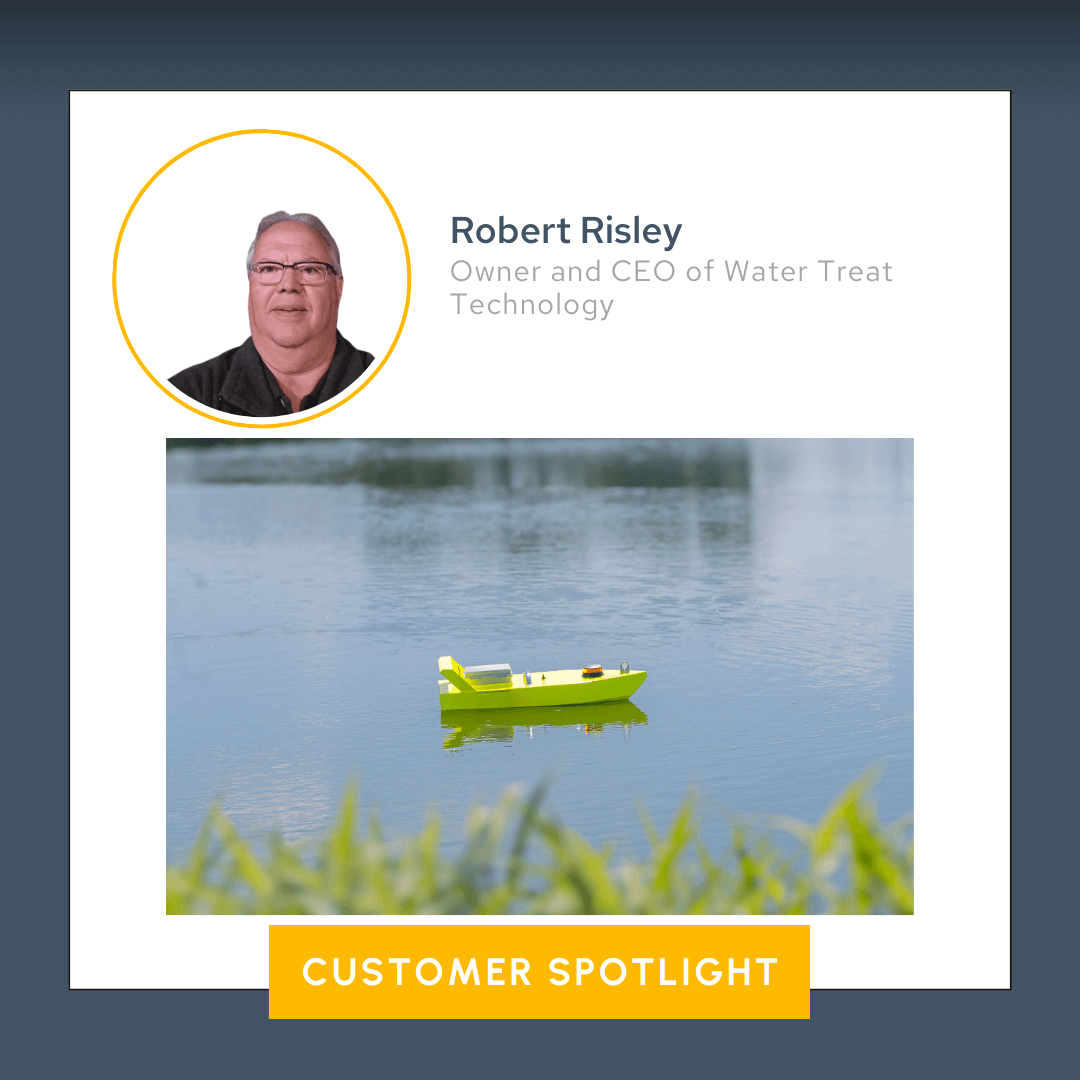
- Aug 20, 2025|Gabbie Rhodes|6 min
Water Treat Technology specializes in lagoon sludge surveys, helping manufacturers and municipalities see sludge buildup and when to remove it.
- Jul 9, 2025|Gabbie Rhodes|8 min
SisBaHiA models natural water bodies in Brazil and beyond, delivering key insights. It also integrates with Surfer and Grapher to get the job done.
- May 14, 2025|Gabbie Rhodes|6 min
Stakeholders need clear, compelling, and accurate data visualizations to manage water resources. Watershed maps help get the job done.
- May 7, 2025|Gabbie Rhodes|4 min
Water availability shifts due to precipitation, runoff, evaporation, and more. How can you visualize the changes? Enter peaks and depressions maps.
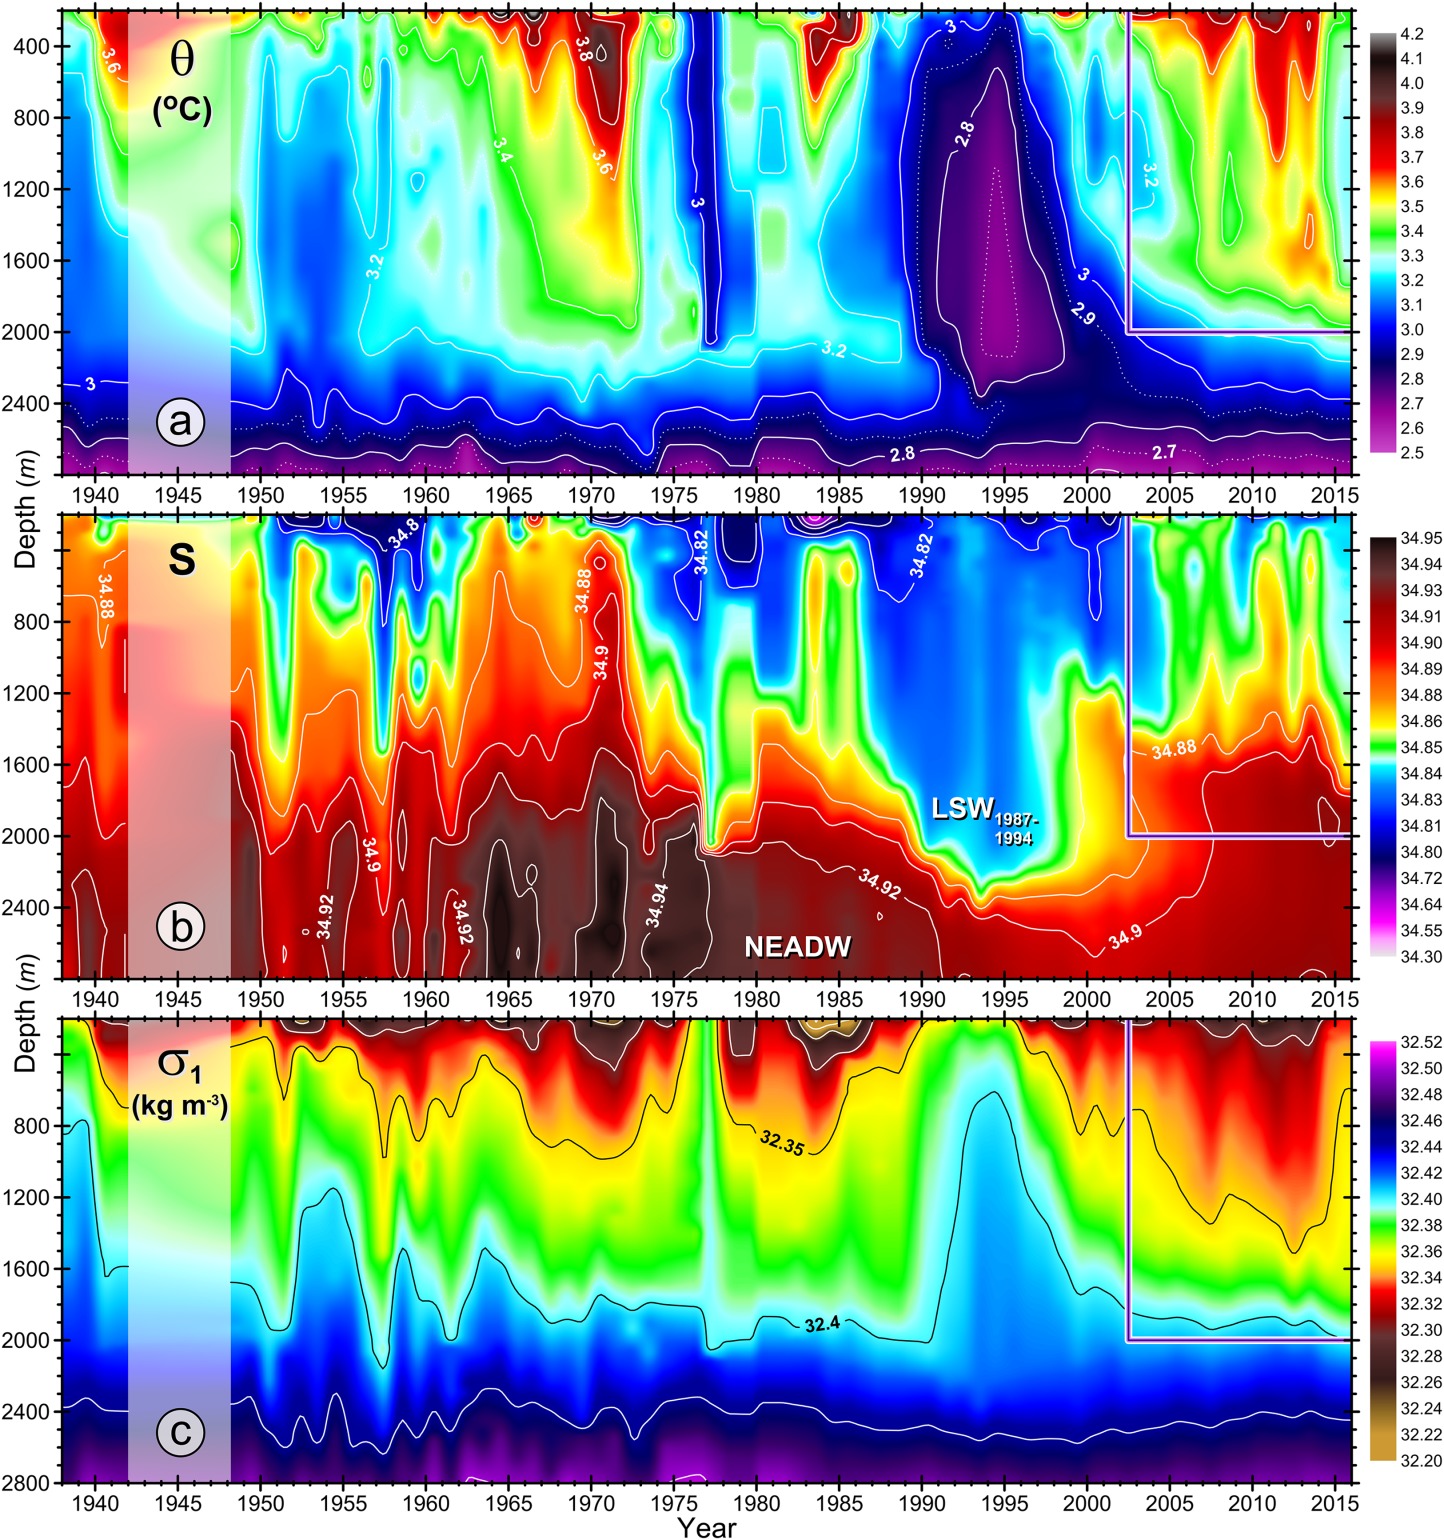
- Apr 23, 2025|Gabbie Rhodes|11 min
Some data visualizations are so good they stand the test of time. One is a high-profile plot that was created in Surfer and that's still relevant today.
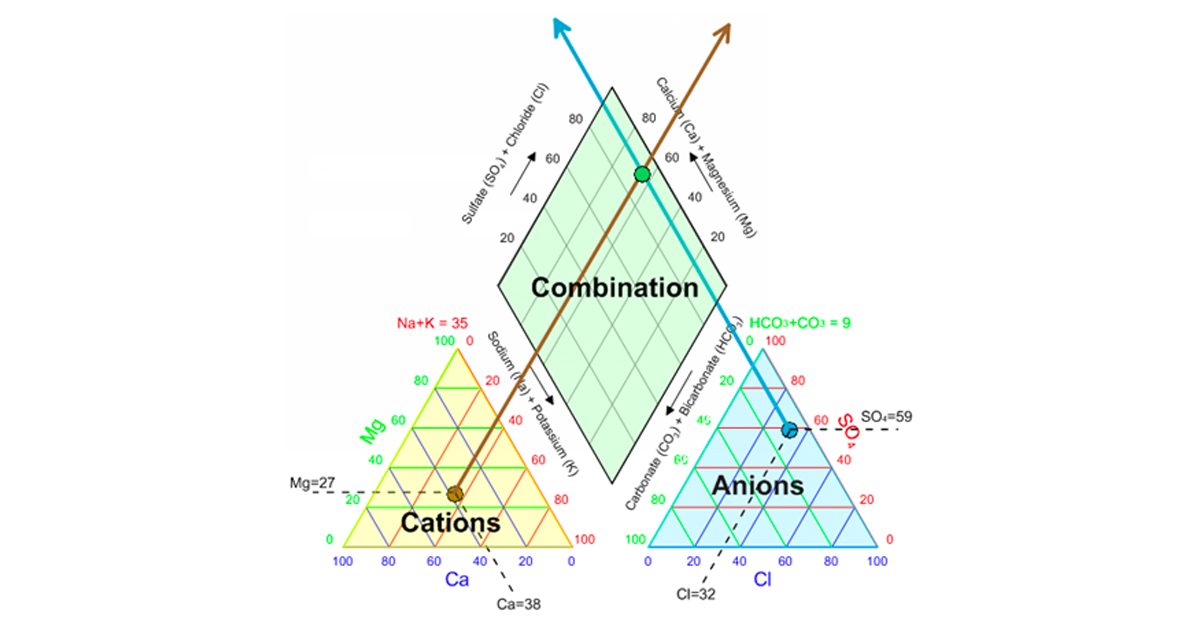
- Jun 23, 2023|Golden Software|5 min
Being able to communicate water quality data is a key responsibility for hydrogeologists. This blog describes diagrams used to present water quality.
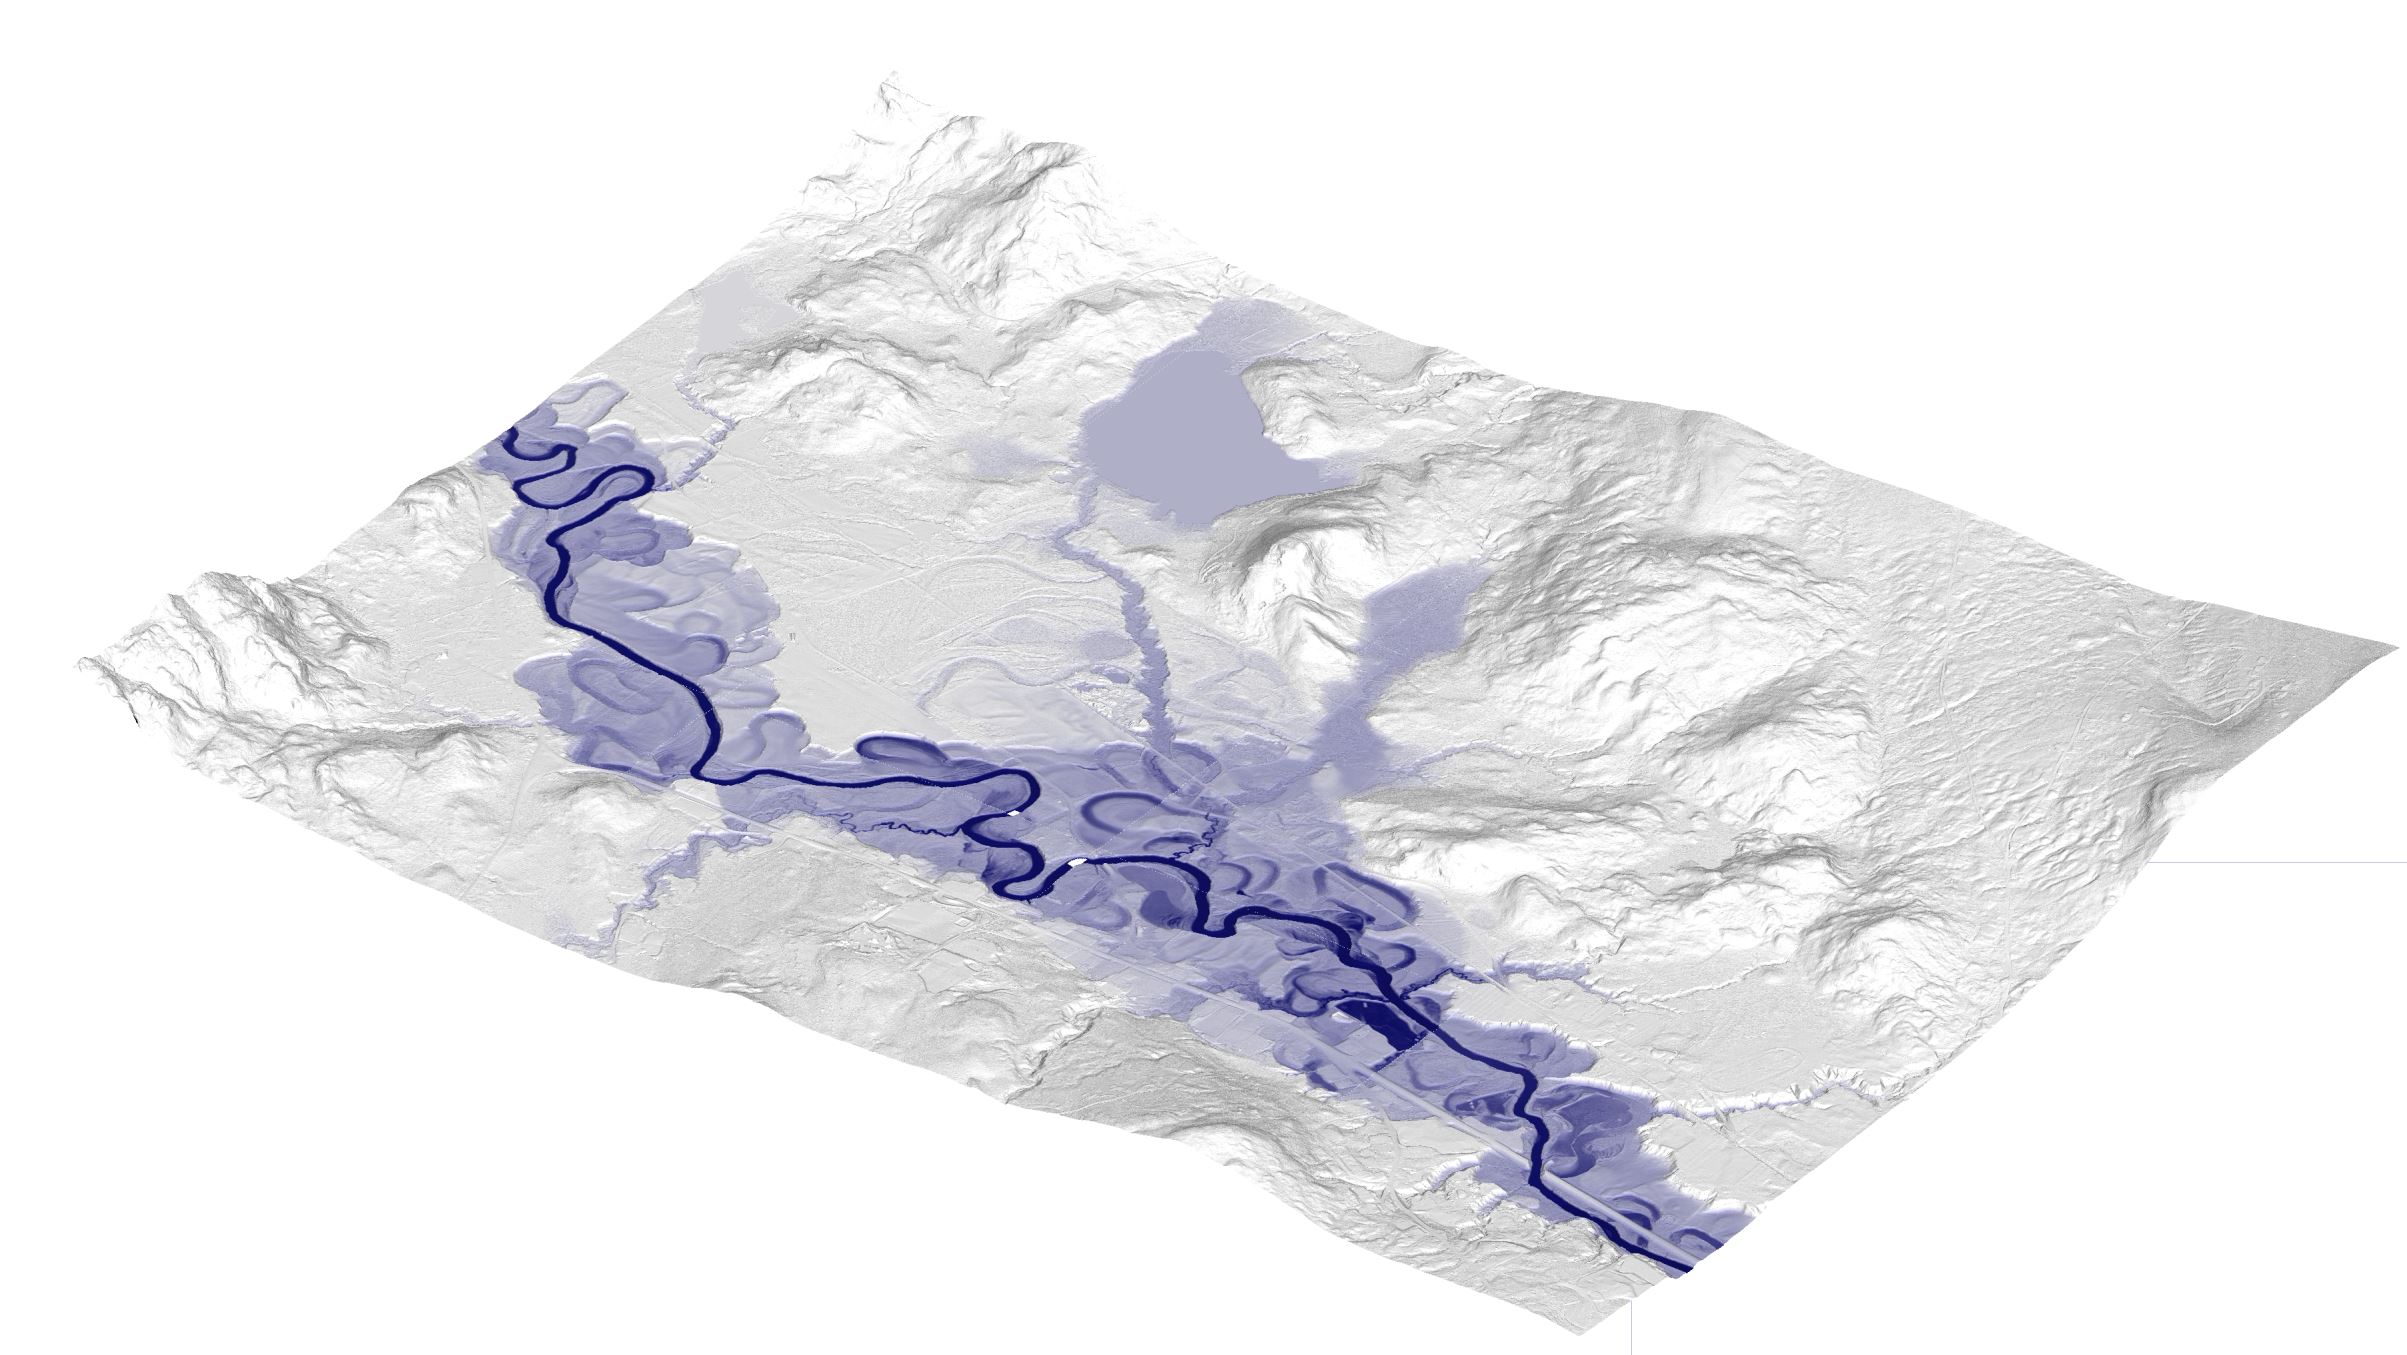
- Aug 9, 2021|Golden Software|3 min
The rivers of New England are prone to eroding into Oxbow lakes. This blog describes the depositional process and how it can be mapped in Surfer.