- Sep 29, 2026|Gabbie Rhodes|9 min read
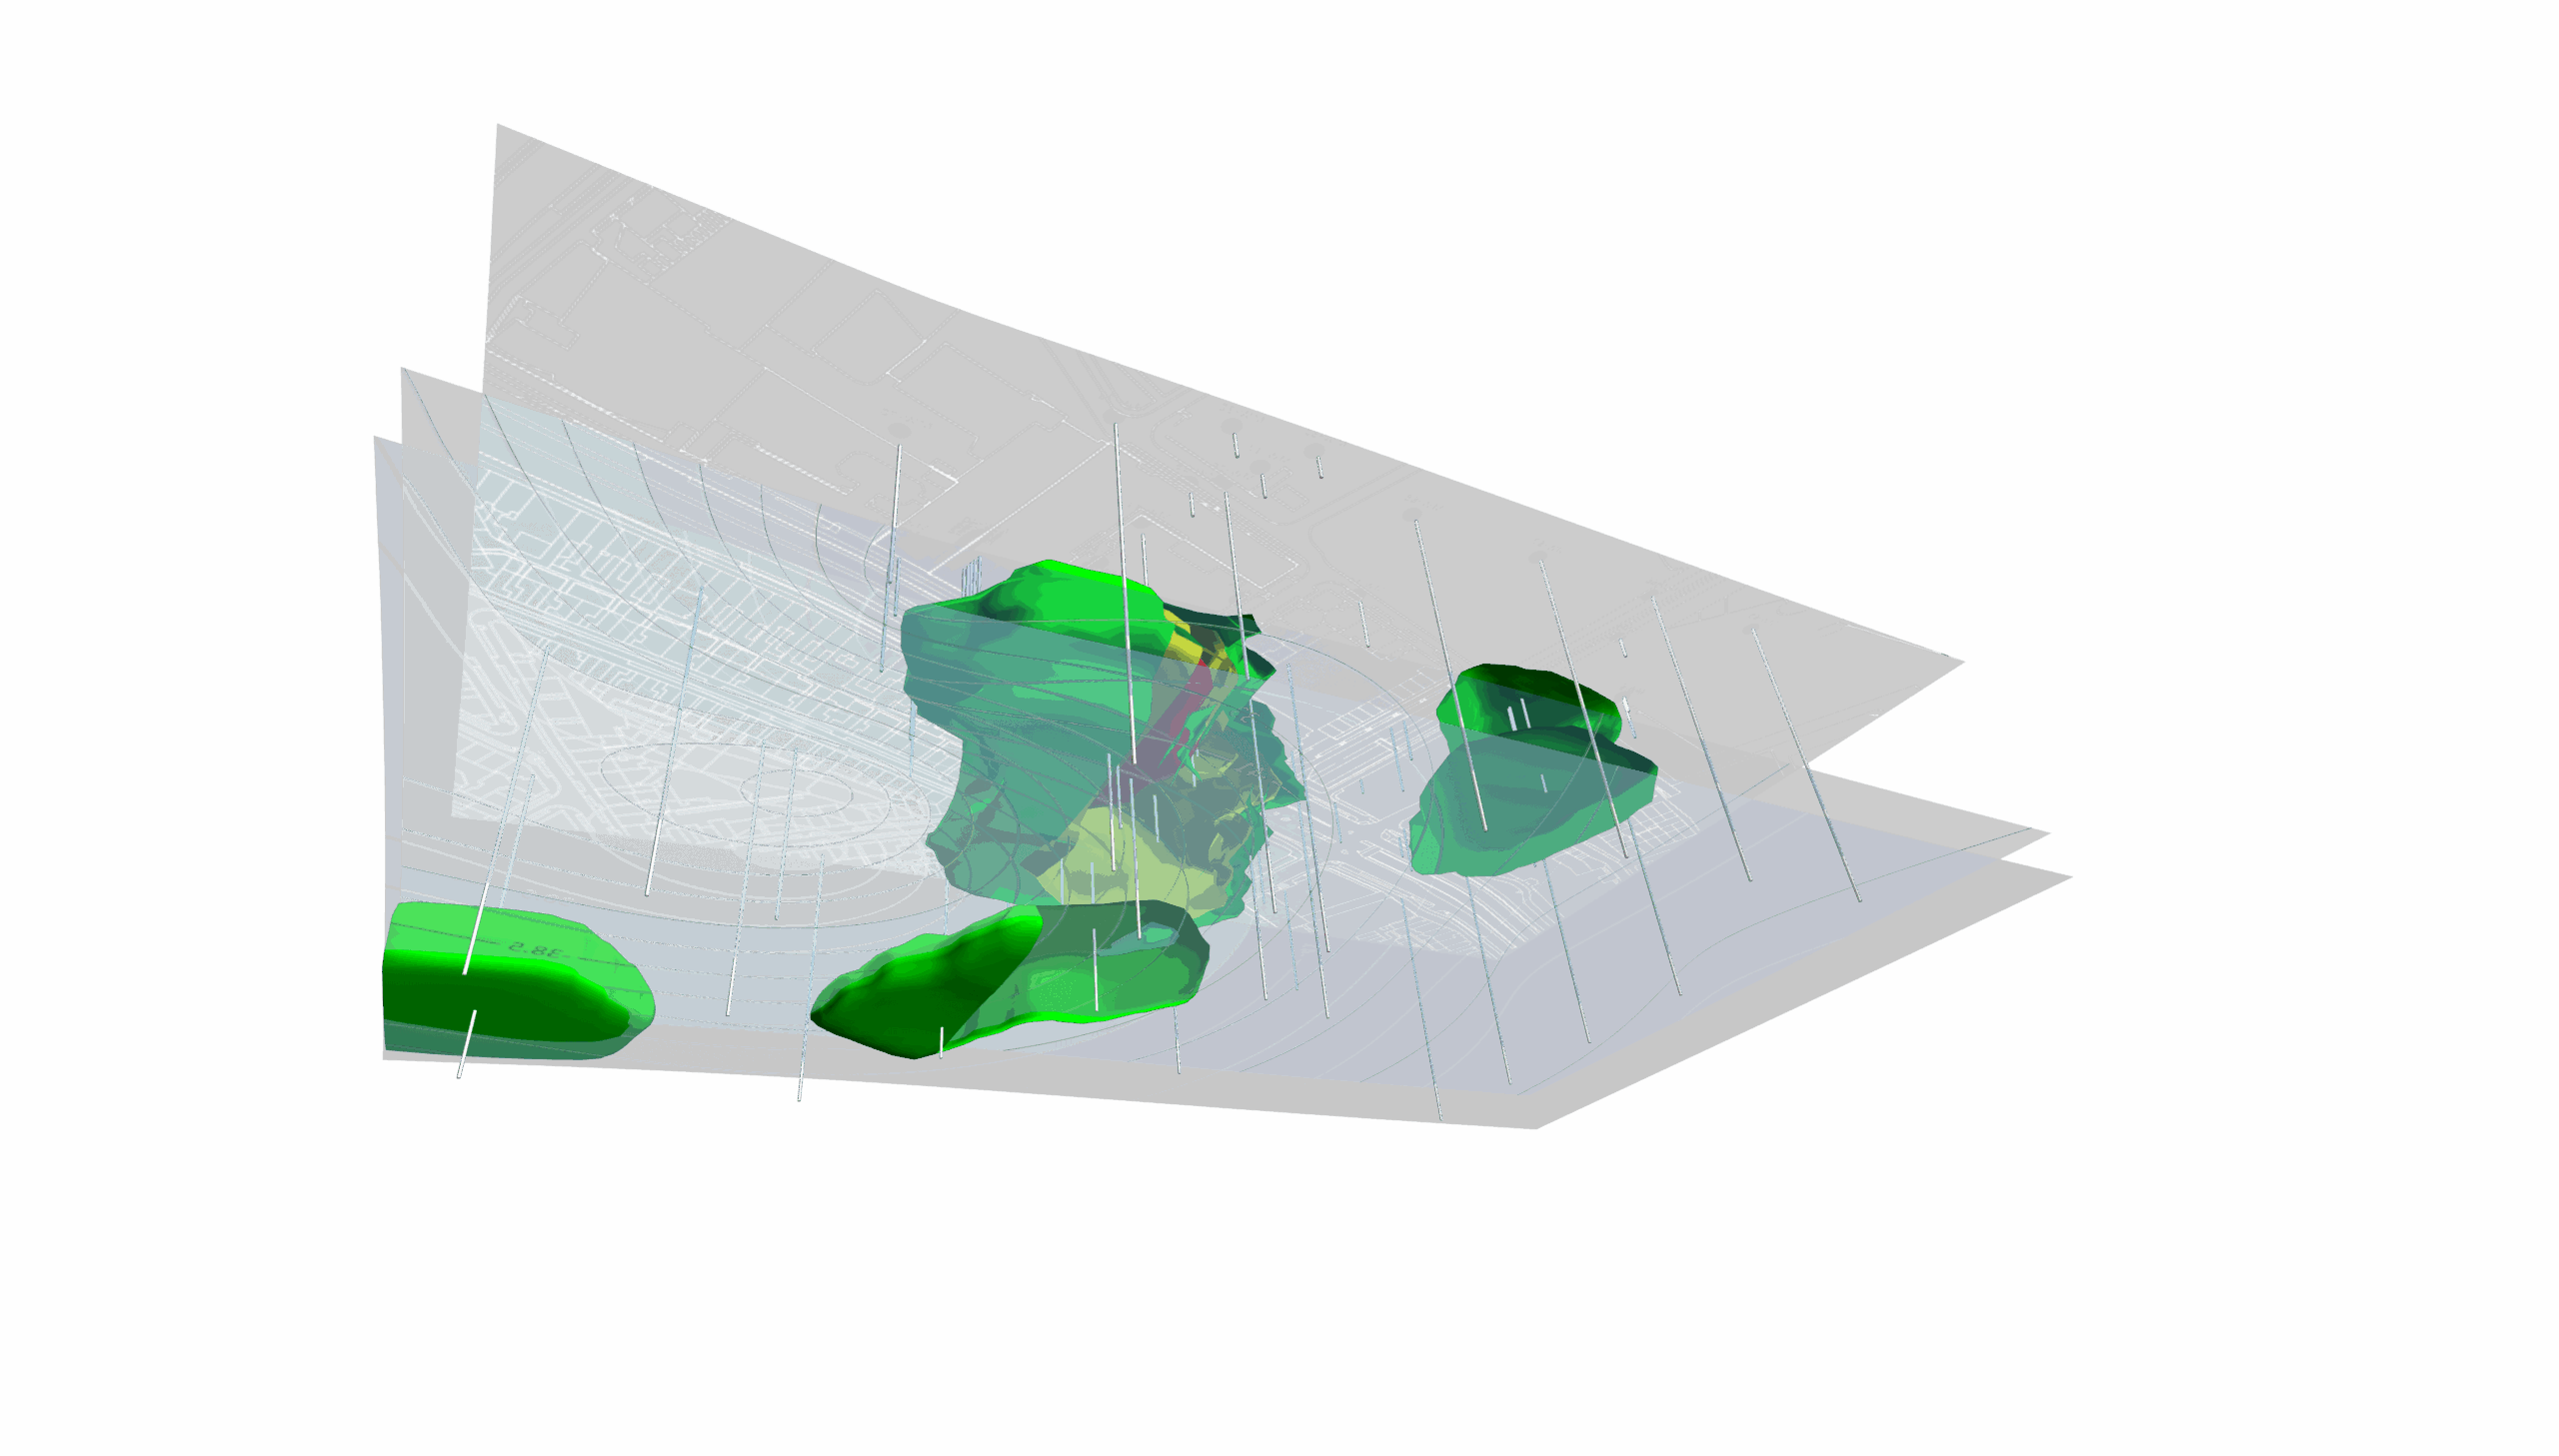
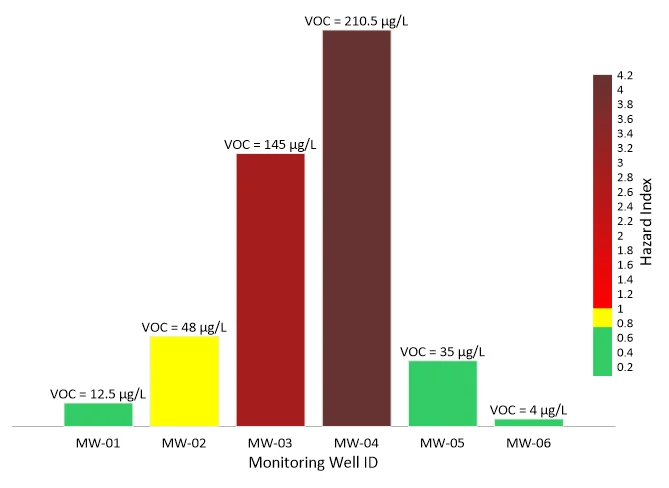
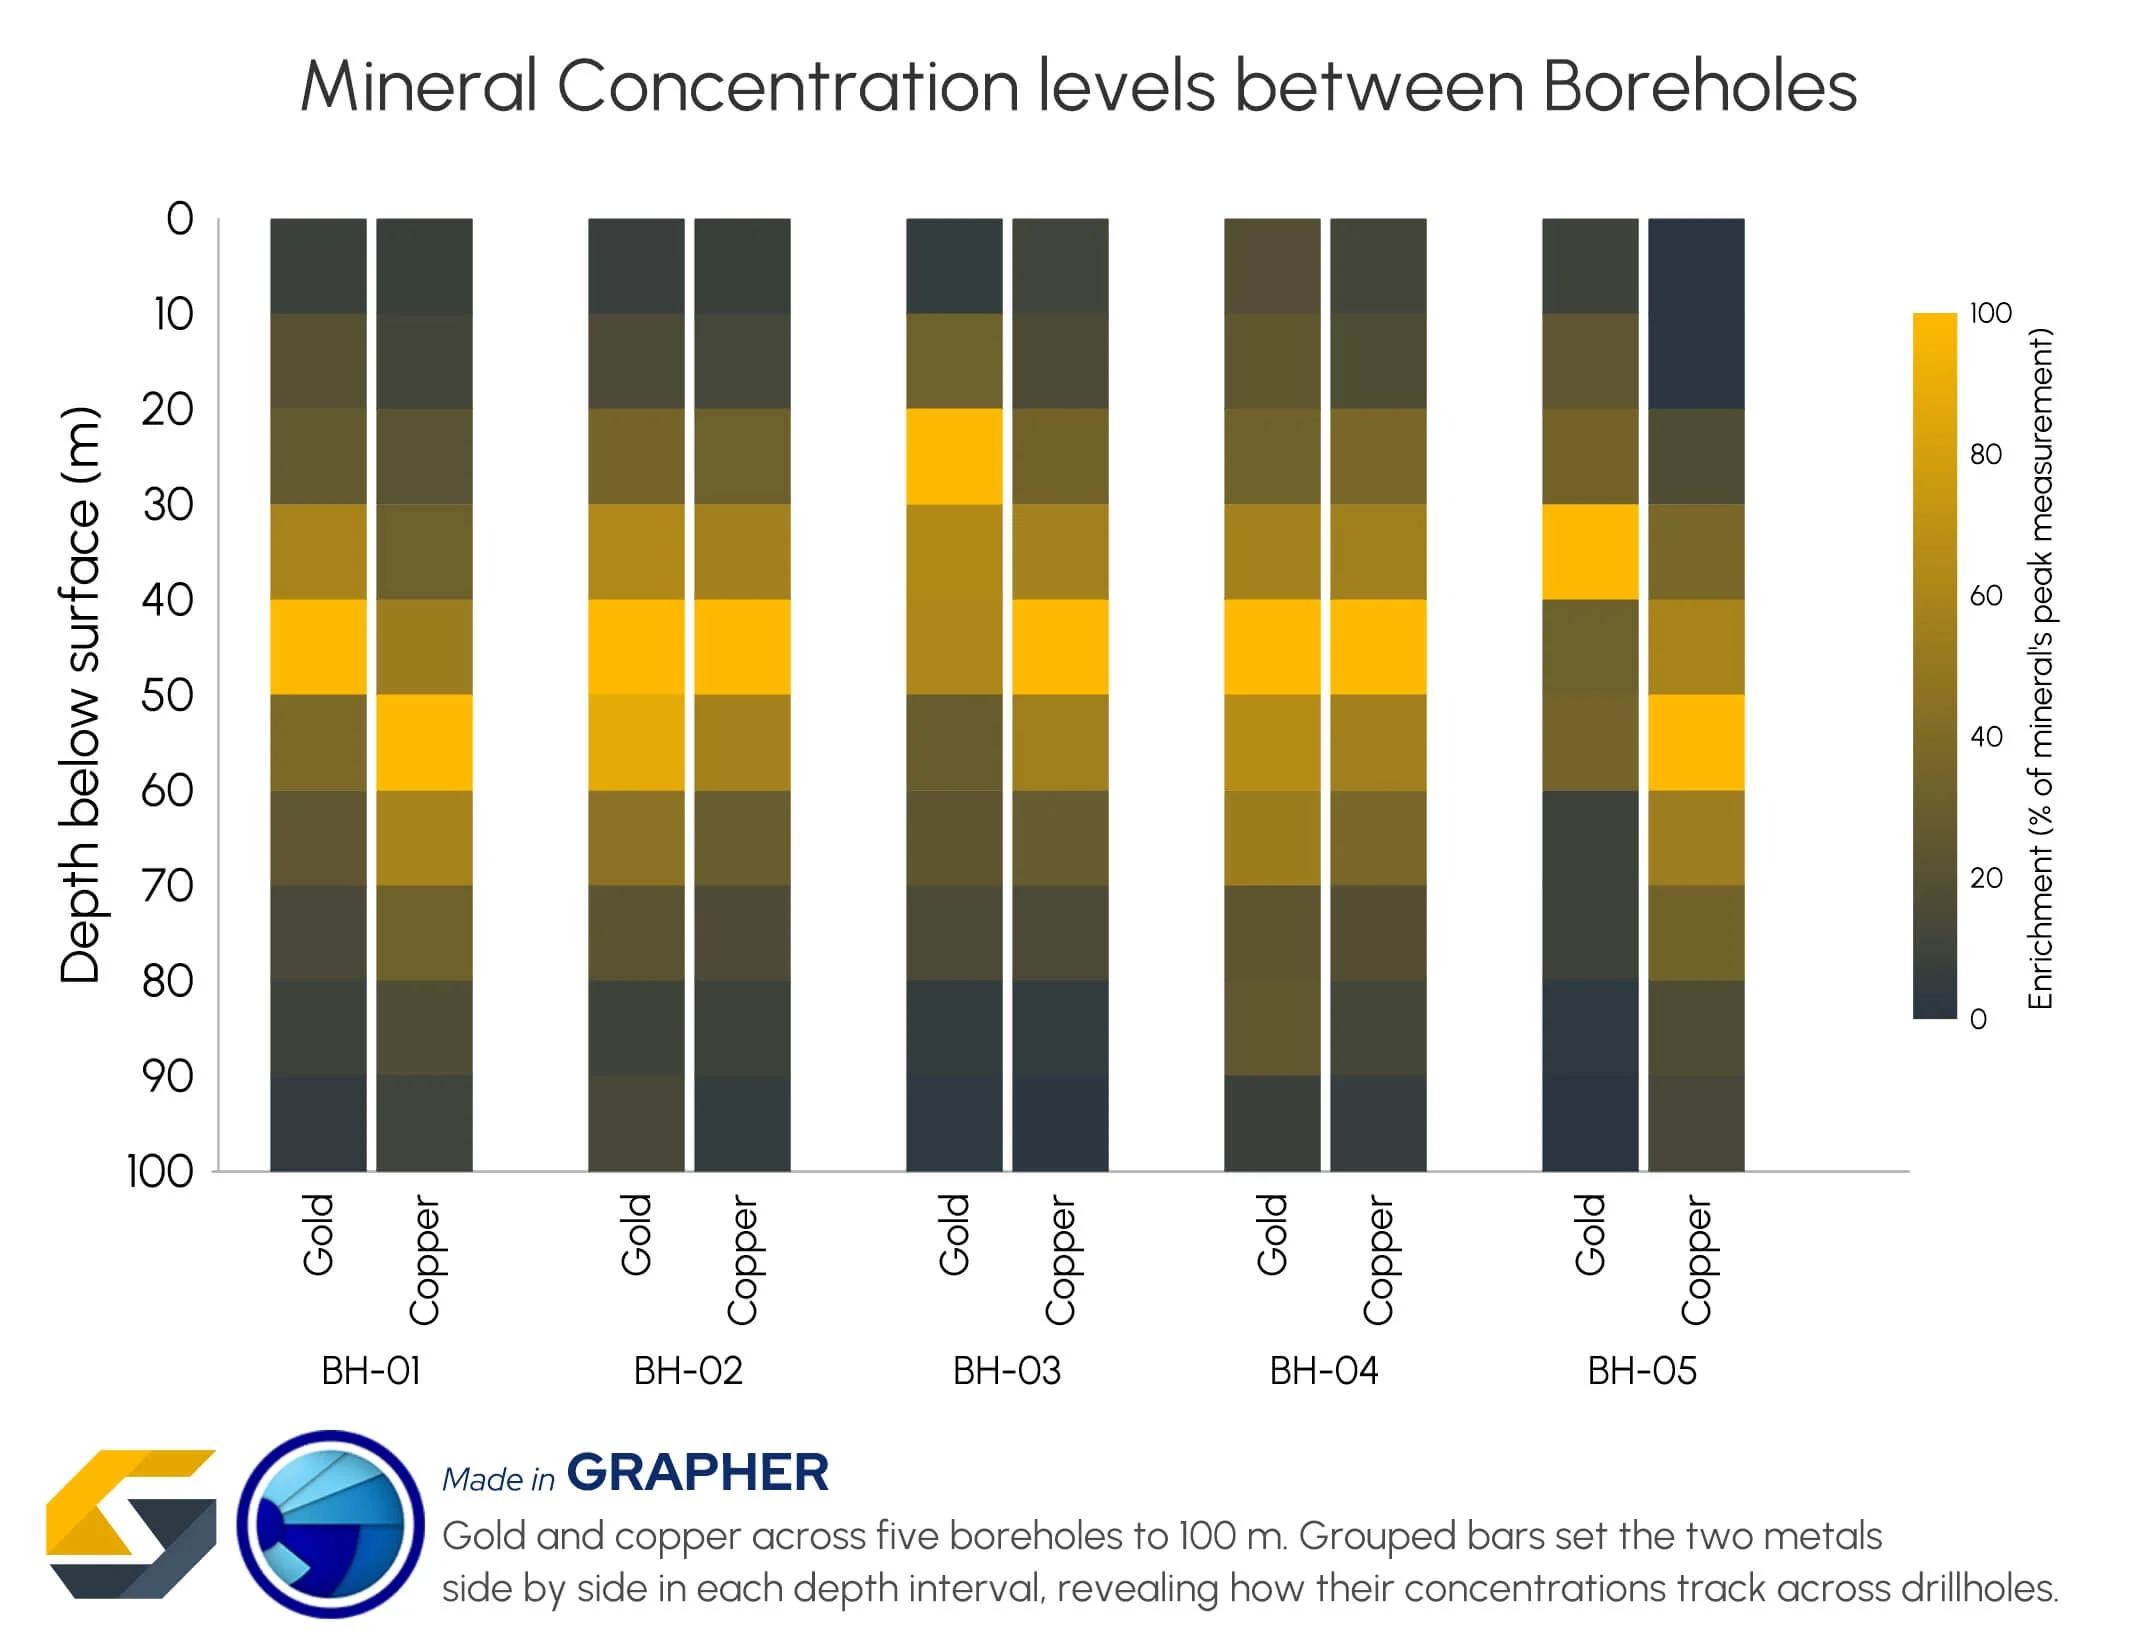
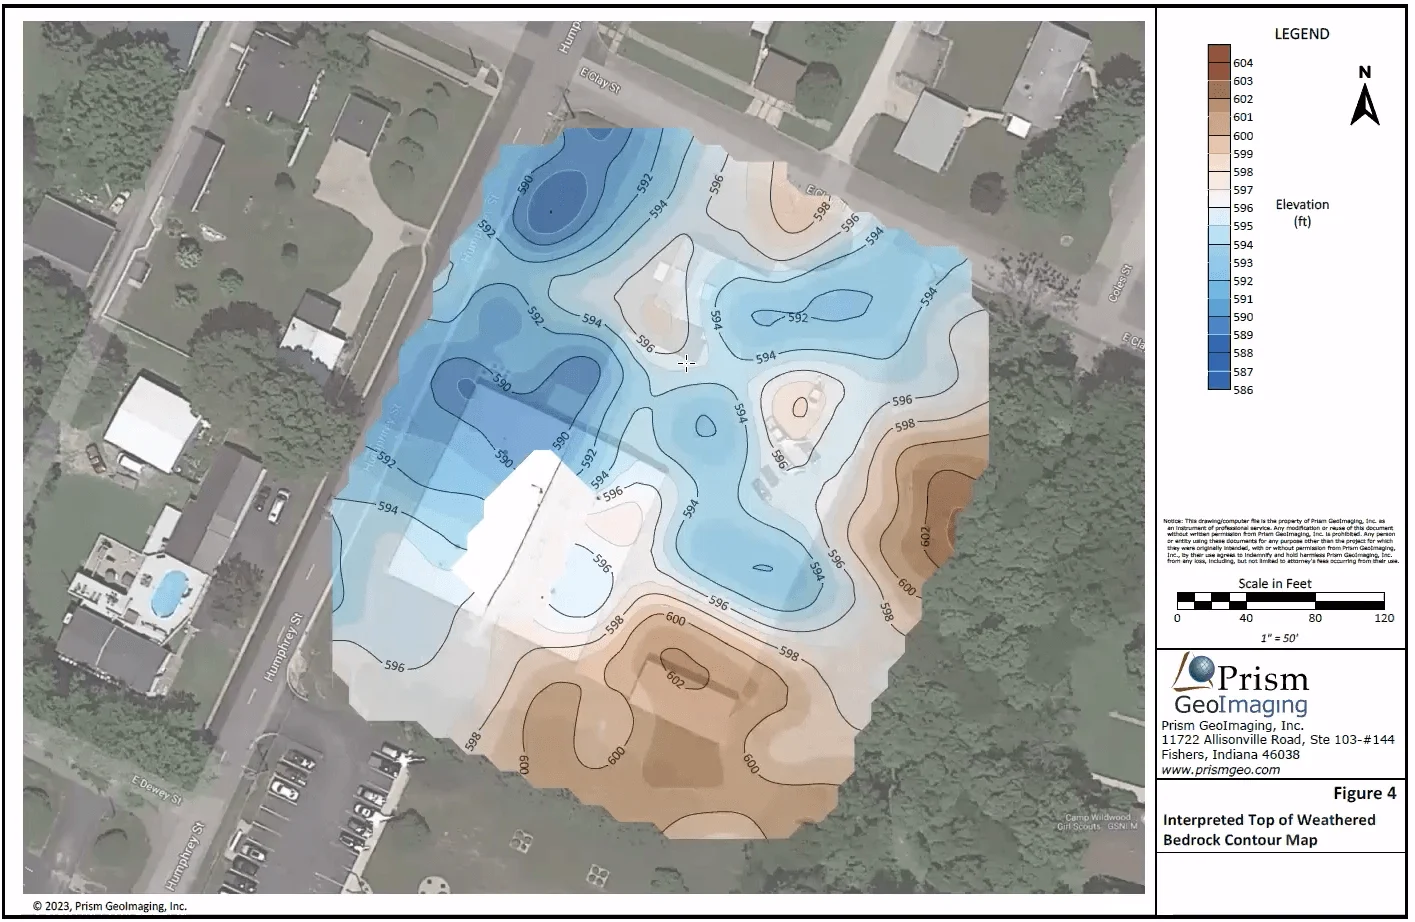
When visualizing technical data, a map will reveal certain insights, while a graph will reveal other insights. You need both to get the full picture.

About Golden Software
Since 1983, Golden Software has been at the forefront of scientific data visualization.
Today, we empower professionals to solve real-world problems by transforming complex data into clear, impactful visual stories through our industry-leading software and legendary customer support.

Surfer – Create an Immersive 2D/3D Model in Under 2 Minutes!

Grapher – If You Can Imagine It, You Can Graph It!
- Sep 29, 2026|Gabbie Rhodes|5 min
Repetition slowing you down? Automation can quicken your high-volume workflow, remove manual steps, and even improve consistency.
- Sep 23, 2026|Gabbie Rhodes|8 min
The best 3D data visualizations depend on the quality of your underlying grid. To achieve a great result, sometimes you need to use 3D grid filters.
- Sep 23, 2026|Gabbie Rhodes|11 min
When you're working with complex data, you need to communicate clearly. Graphs can help, especially when you follow design best practices.
- Aug 26, 2026|Gabbie Rhodes|8 min
Whether you produce visuals every day or only occasionally, small workflow improvements when mapping data can save you significant time.
- Aug 19, 2026|Gabbie Rhodes|7 min
The latest version of Grapher is here! Its new features are designed to help you work more efficiently while delivering greater clarity and impact.
- Aug 5, 2026|Gabbie Rhodes|5 min
Need to show the relationship between multiple interconnected factors? Visualize multivariate data using an XYZC data structure.
- Jul 29, 2026|Gabbie Rhodes|12 min
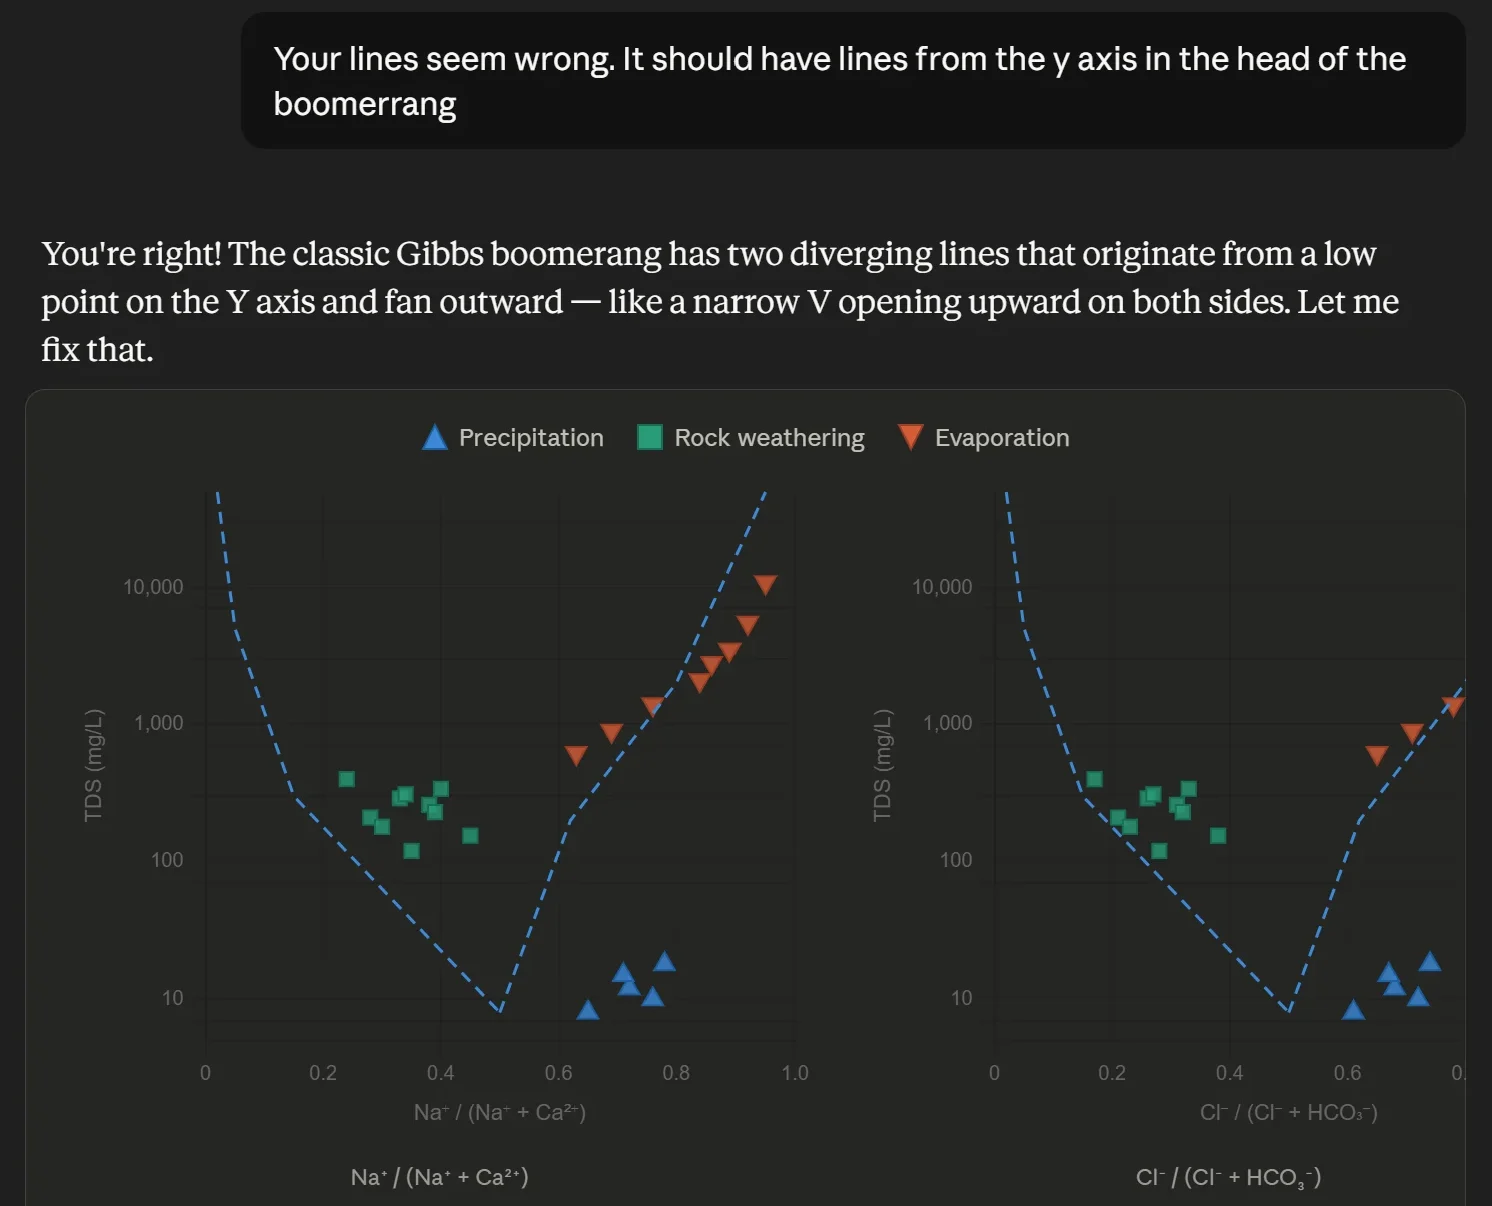
Want to use AI for data visualization? First, consider this: while many AI-generated graphs initially look great, they can misrepresent your data.
- Jul 29, 2026|Gabbie Rhodes|9 min
Map elements often have the biggest impact on how confidently stakeholders interpret your data and make decisions. Discover which ones to use.
- Jul 22, 2026|Gabbie Rhodes|6 min
Your team needs to work together effectively. Discover strategies to enhance team collaboration, so projects move forward with greater confidence.
- Jul 22, 2026|Gabbie Rhodes|8 min
You need to produce clear, accurate maps, models, and graphs. Can AI tools for data visualization help? Here's the answer.
- Jul 8, 2026|Gabbie Rhodes|10 min
Effective data communication is about making your maps and models easy to understand, and there are ways to achieve that goal. Discover the tips!
- Jul 1, 2026|Gabbie Rhodes|7 min
Geoscience projects are built on collaboration, but even the strongest teams can struggle with communication silos. Learn how to overcome them.