- Apr 8, 2026|Gabbie Rhodes|9 min read
Ever wonder how to make a bar chart that impresses viewers? Discover customizations that'll highlight what matters, clarify differences, and more.
About Golden Software
Since 1983, Golden Software has been at the forefront of scientific data visualization.
Today, we empower professionals to solve real-world problems by transforming complex data into clear, impactful visual stories through our industry-leading software and legendary customer support.
Surfer – Create an Immersive 2D/3D Model in Under 2 Minutes!
Grapher – If You Can Imagine It, You Can Graph It!
- Apr 8, 2026|Gabbie Rhodes|5 min
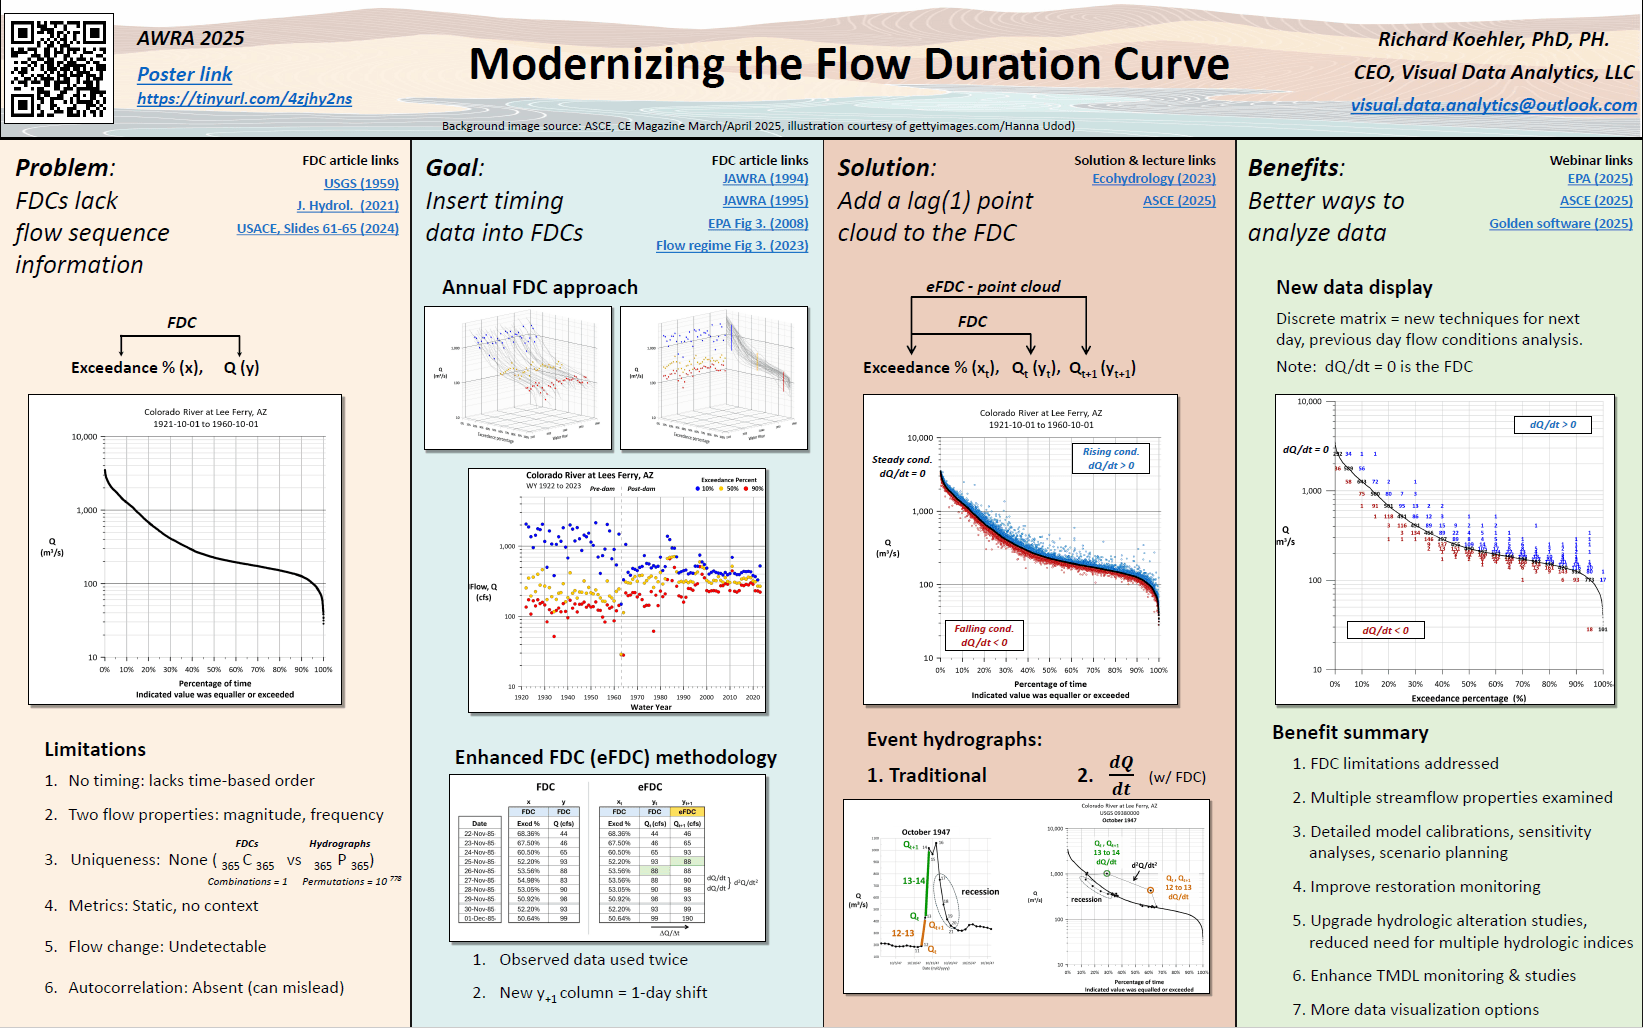
At large conferences, posters compete for attention. Rick Koehler, Ph.D., PH, understands this well and uses information design to stand out.
- Apr 1, 2026|Gabbie Rhodes|10 min
Grouped bar charts offer a distinct and powerful way to compare data. They can bring clarity to differences that might otherwise get buried.
- Mar 25, 2026|Gabbie Rhodes|10 min
Stacked bar charts are one of those visuals that everyone recognizes but doesn’t always use to their full potential. Discover how to use it effectively.
- Mar 25, 2026|Gabbie Rhodes|11 min
One of the most common choices in scientific data visualization is deciding between a log scale vs. linear scale. Here's how to choose wisely.
- Mar 20, 2026|Gabbie Rhodes|9 min
Behind many landmark discoveries are historical women in geosciences. Discover the women who helped lay the groundwork for modern research.
- Mar 4, 2026|Gabbie Rhodes|7 min
What is a bar chart? They're one of the most effective tools for scientific communication. Discover how to design and use them effectively.
- Feb 17, 2026|Gabbie Rhodes|8 min
Data presentation matters, especially when sharing insights from complex datasets. Discover best practices to level up the way you share data.
- Feb 11, 2026|Gabbie Rhodes|12 min
Project documentation is a professional skill that helps geoscientists work faster and have more productive conversations with stakeholders.
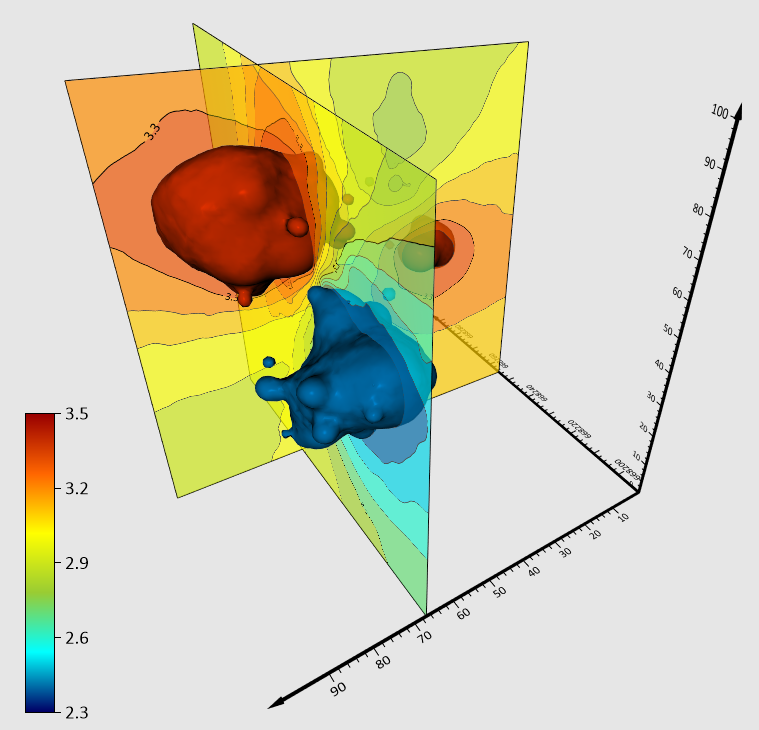
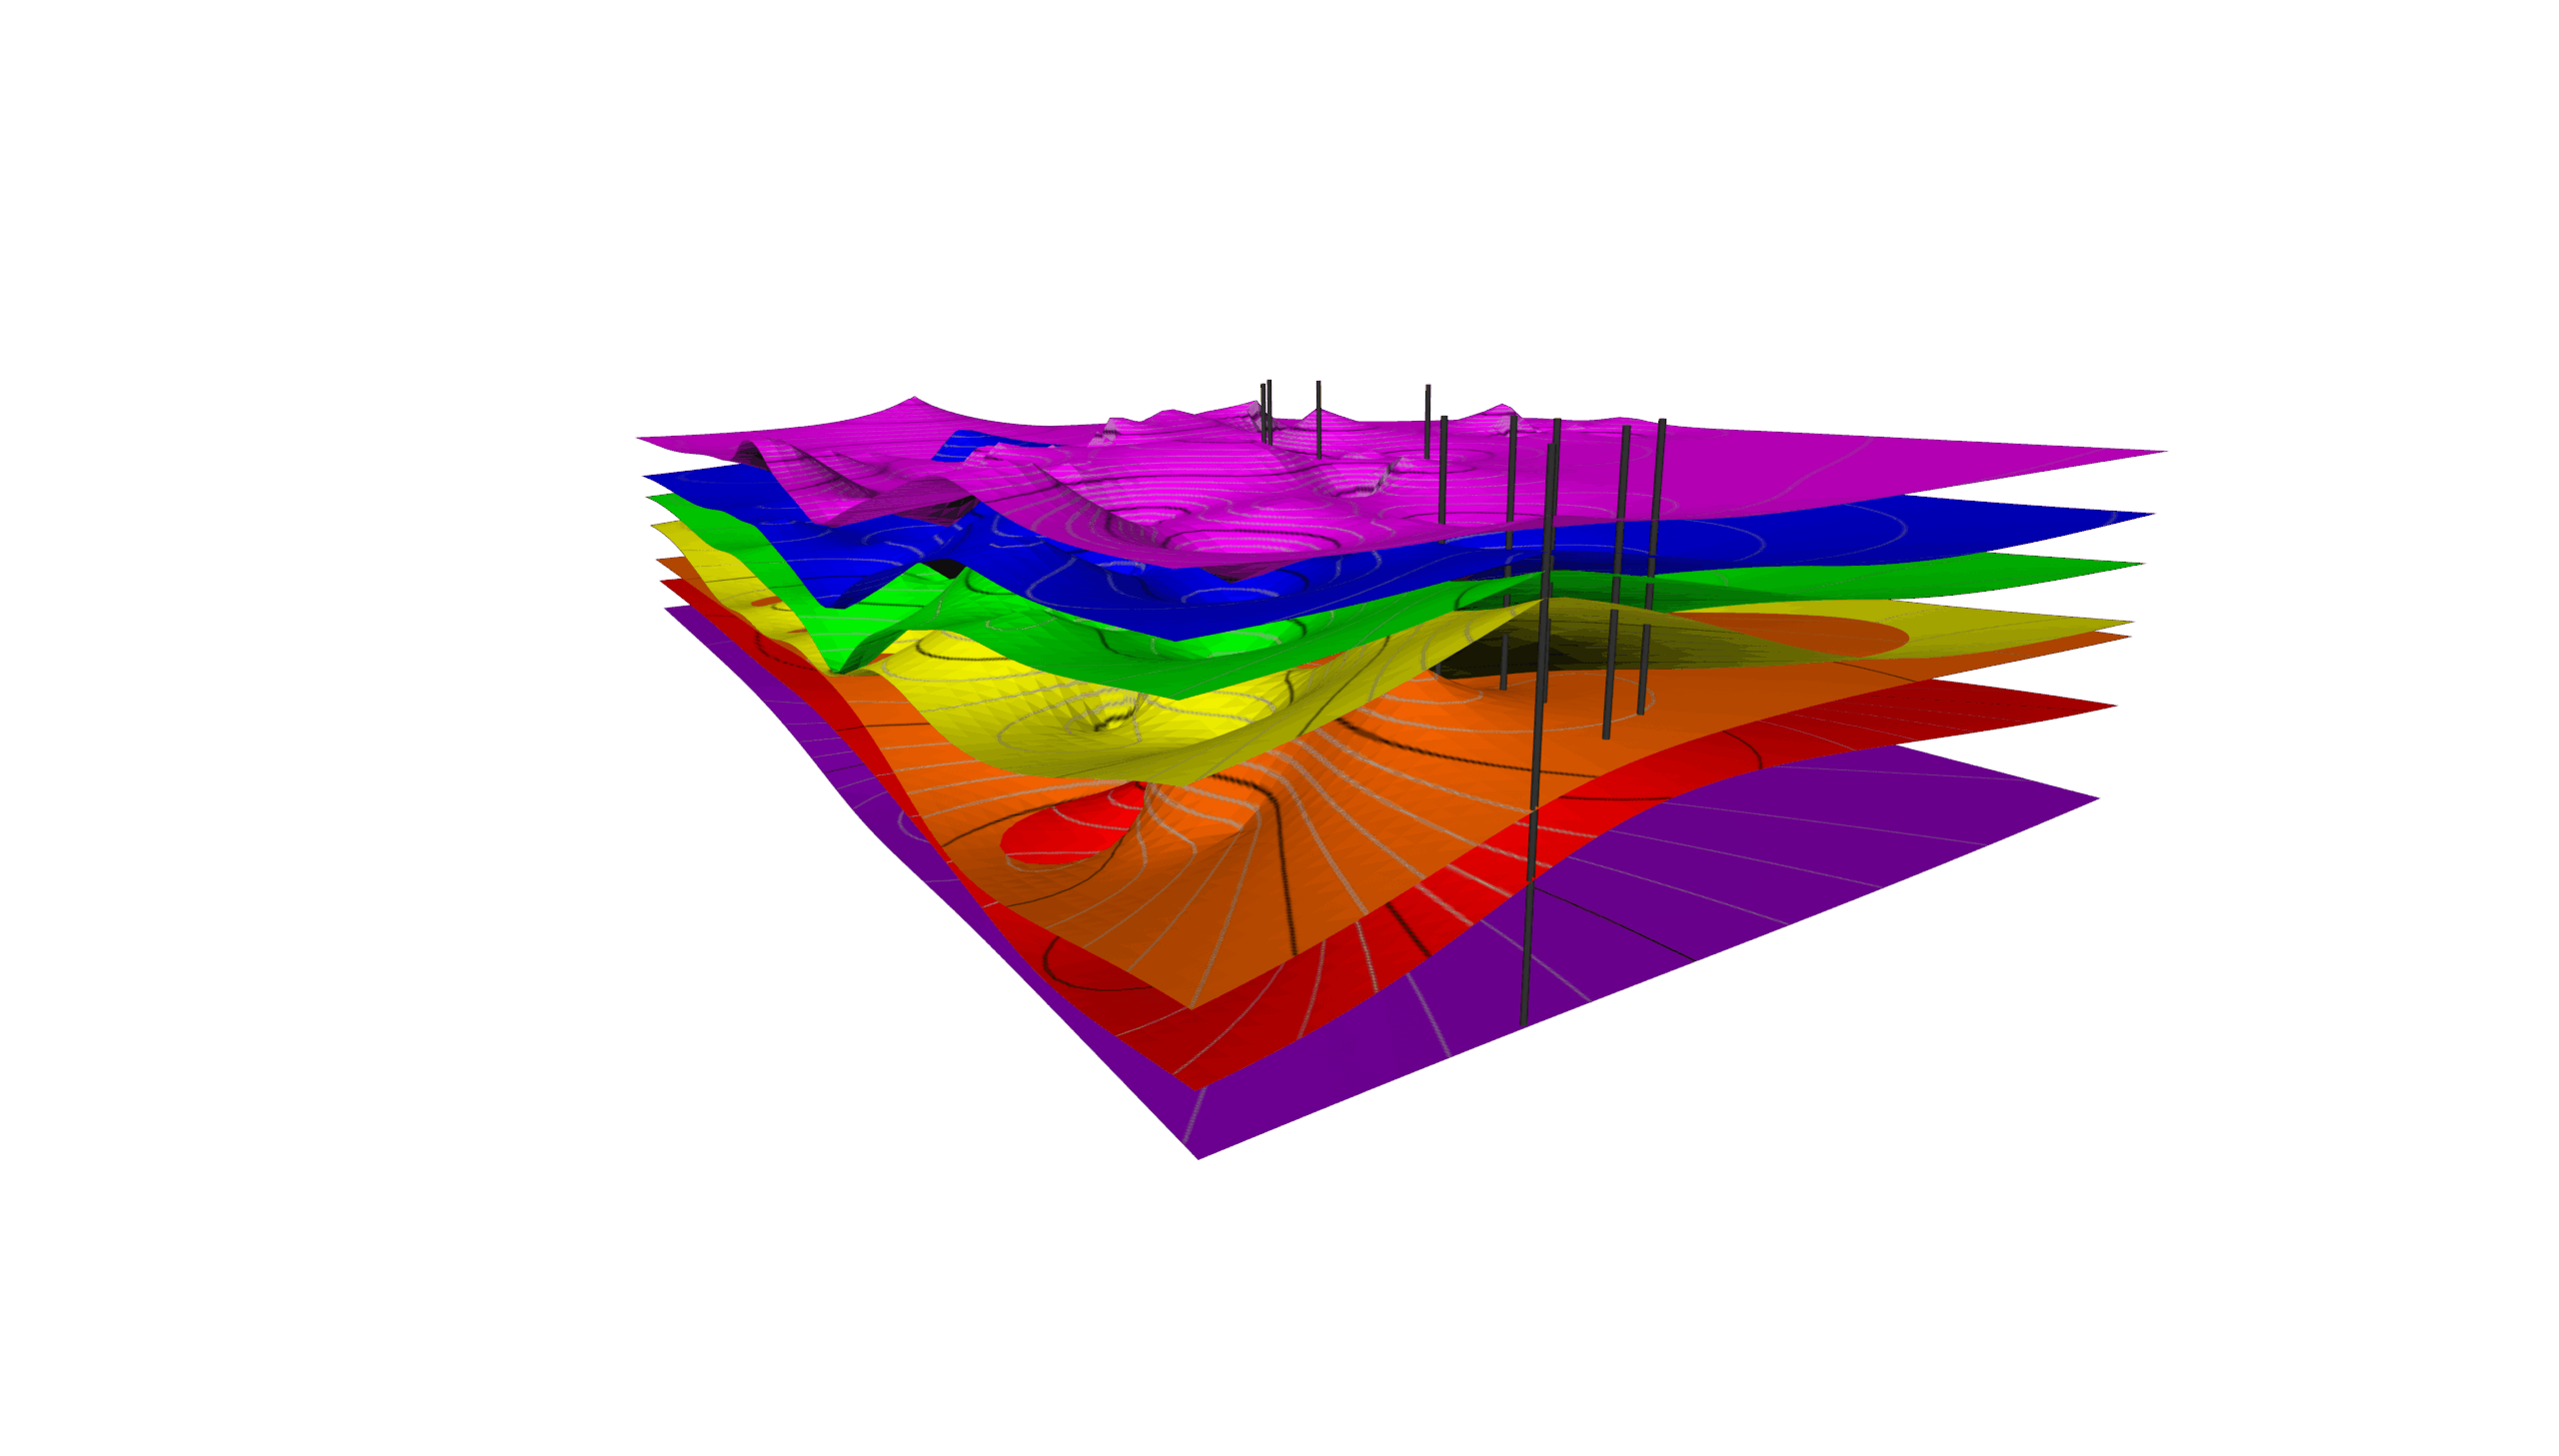
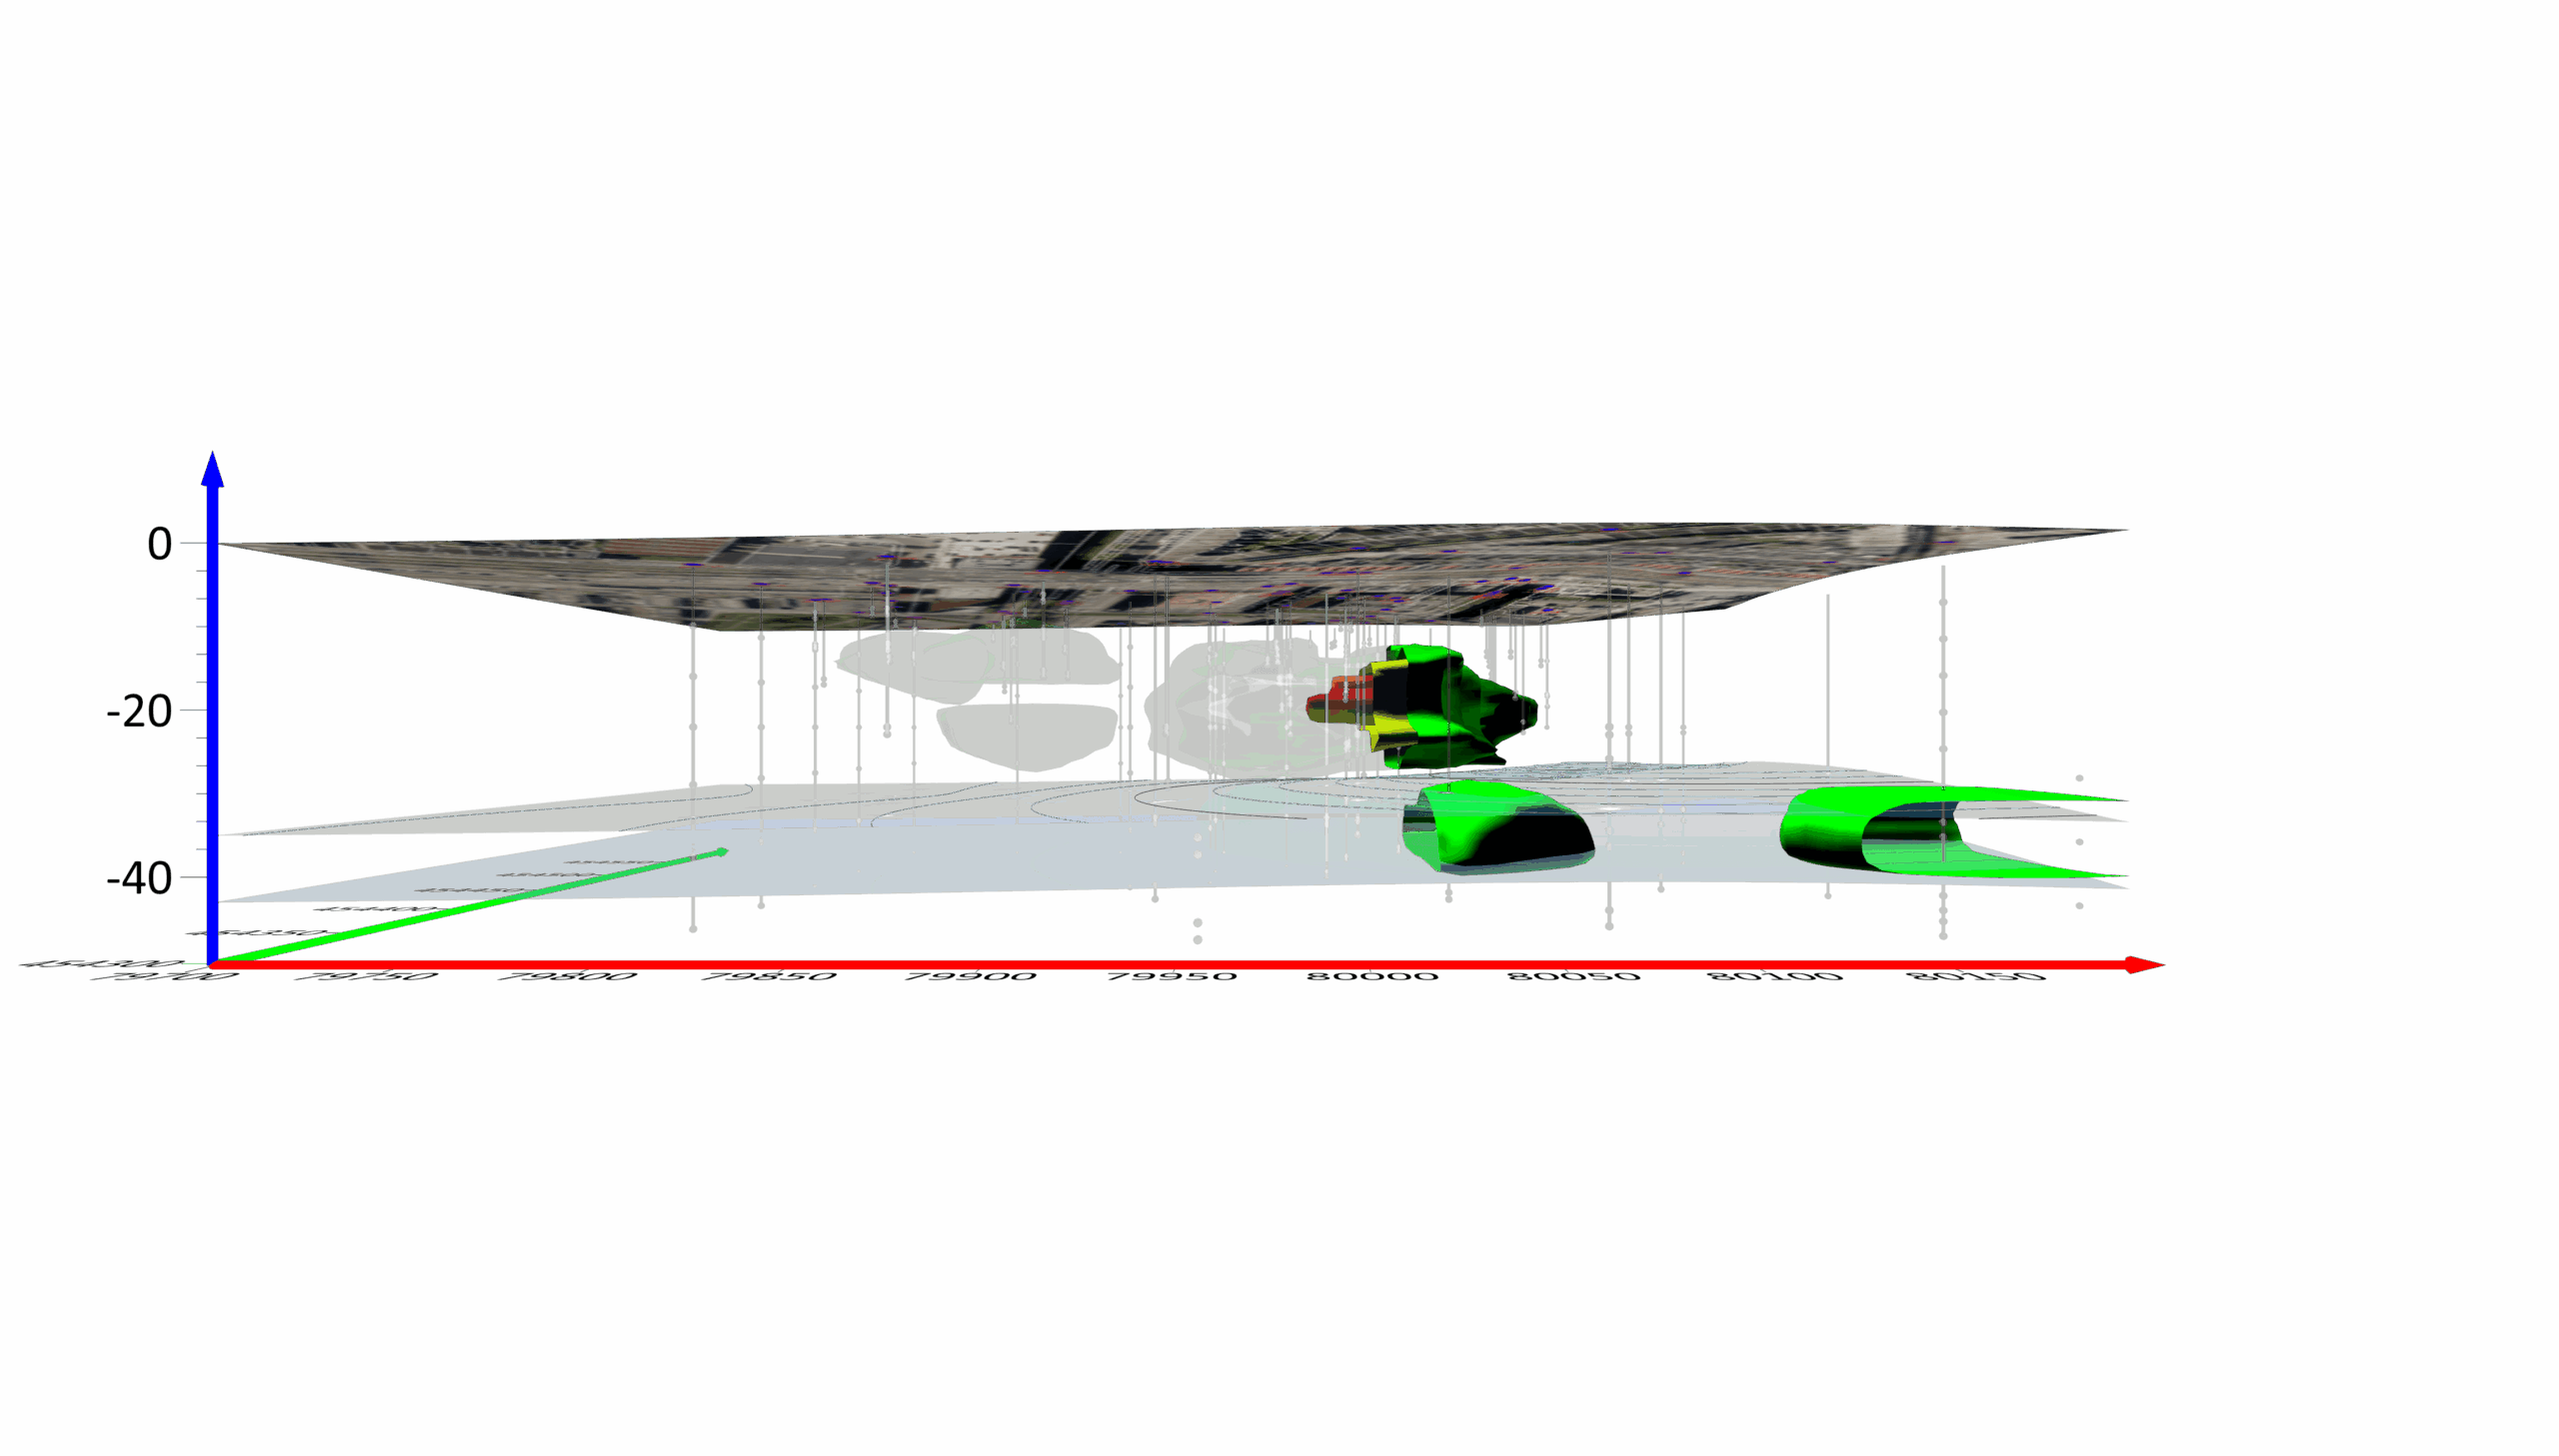
- Feb 11, 2026|Gabbie Rhodes|7 min
Creating a 3D data visualization is one thing. Clearly communicating insights from it is another. Learn top tips for explaining your 3D model well.
- Feb 4, 2026|Gabbie Rhodes|7 min
When you're looking for different software, how do you determine which tool to choose? The right-fit approach is a great way to find the perfect fit.
- Feb 4, 2026|Gabbie Rhodes|5 min
The challenge isn’t whether to use 2D; it’s knowing when your project calls for 3D visualization. There are specific signs that'll give you the answer.
- Jan 27, 2026|Gabbie Rhodes|6 min
3D models sound and look cool, but you may be asking yourself a question: are they really worth creating? We dive into their practical benefits.