- Jan 14, 2026|Gabbie Rhodes|4 min read
Oftentimes, you need to customize your graph to ensure you not only honor your data but also align with style guidelines and client expectations.

About Golden Software
Since 1983, Golden Software has been at the forefront of scientific data visualization.
Today, we empower professionals to solve real-world problems by transforming complex data into clear, impactful visual stories through our industry-leading software and legendary customer support.
Surfer – Create an Immersive 2D/3D Model in Under 2 Minutes!
Grapher – If You Can Imagine It, You Can Graph It!
- Jan 6, 2026|Gabbie Rhodes|4 min
Are you the graphing pro that everyone in your organization turns to for a plot? Templates empower colleagues to create great visuals themselves.
- Dec 30, 2025|Gabbie Rhodes|4 min
When you regularly work with updated data or similar projects, recreating your plots is the norm. Fortunately, templates make it easier than ever!
- Dec 23, 2025|Gabbie Rhodes|4 min
Do you want to create an effective data visualization every time stakeholders need one? Templates not only make that possible but easy.
- Dec 23, 2025|Gabbie Rhodes|5 min
Want to create a visual that truly impresses stakeholders? The finishing touches matter. Learn how to wow stakeholders with quality maps & models.
- Dec 17, 2025|Gabbie Rhodes|4 min
When using a new graphing tool or trying to create a new plot in your current software, there's always a learning curve. Templates can help.
- Dec 10, 2025|Gabbie Rhodes|9 min
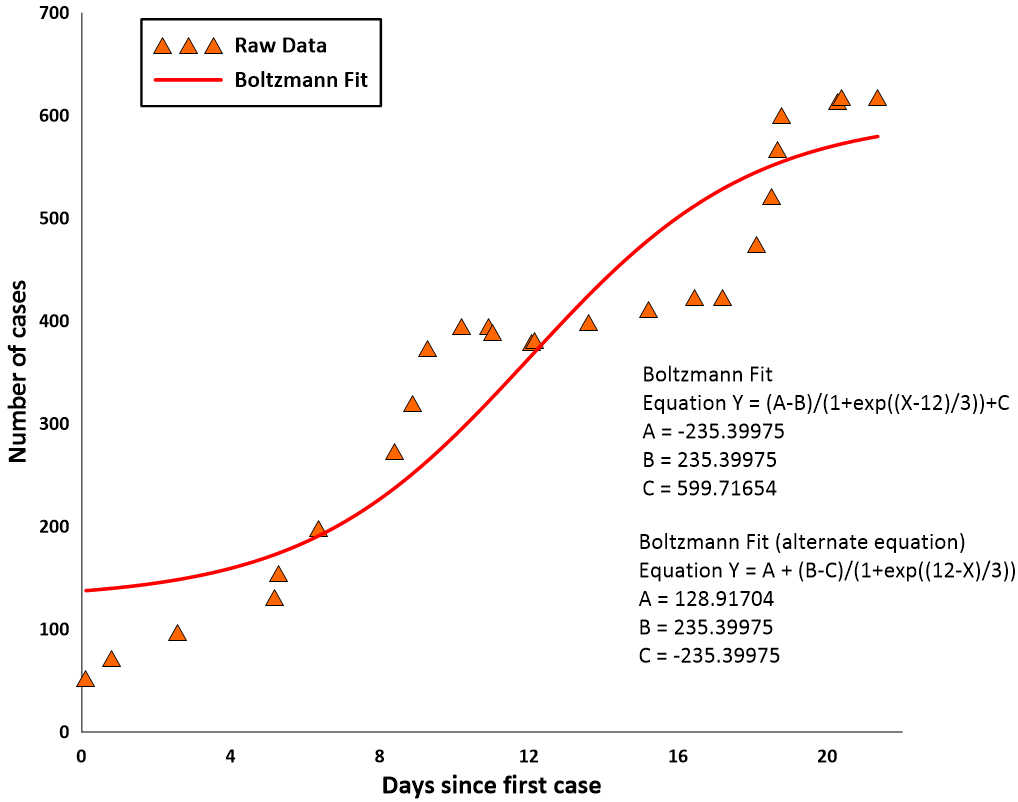
Need to create graphs and charts that are understandable and trustworthy? Fit curves help achieve those goals. Learn more.
- Dec 10, 2025|Gabbie Rhodes|4 min
Graphing isn't always a quick and easy process, but there's a way you can streamline it: take advantage of ready-to-use graph templates.
- Dec 4, 2025|Gabbie Rhodes|3 min
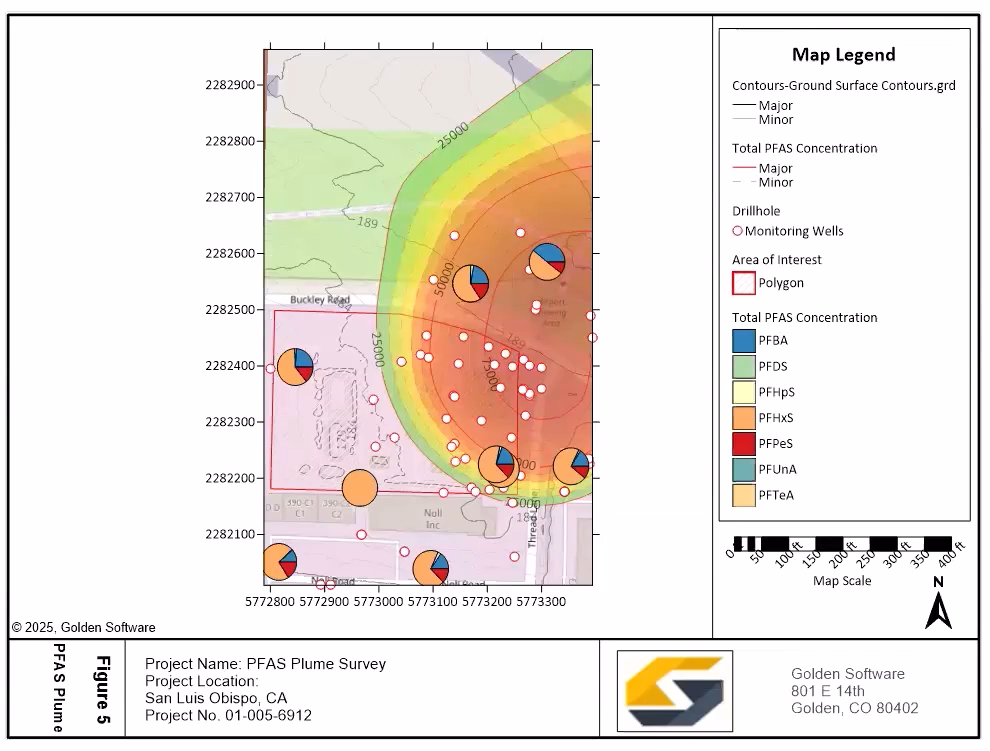
Wondering if your 2D maps are clearly communicating surface and subsurface data? There are signs that can let you know. Read more.
- Nov 19, 2025|Gabbie Rhodes|5 min
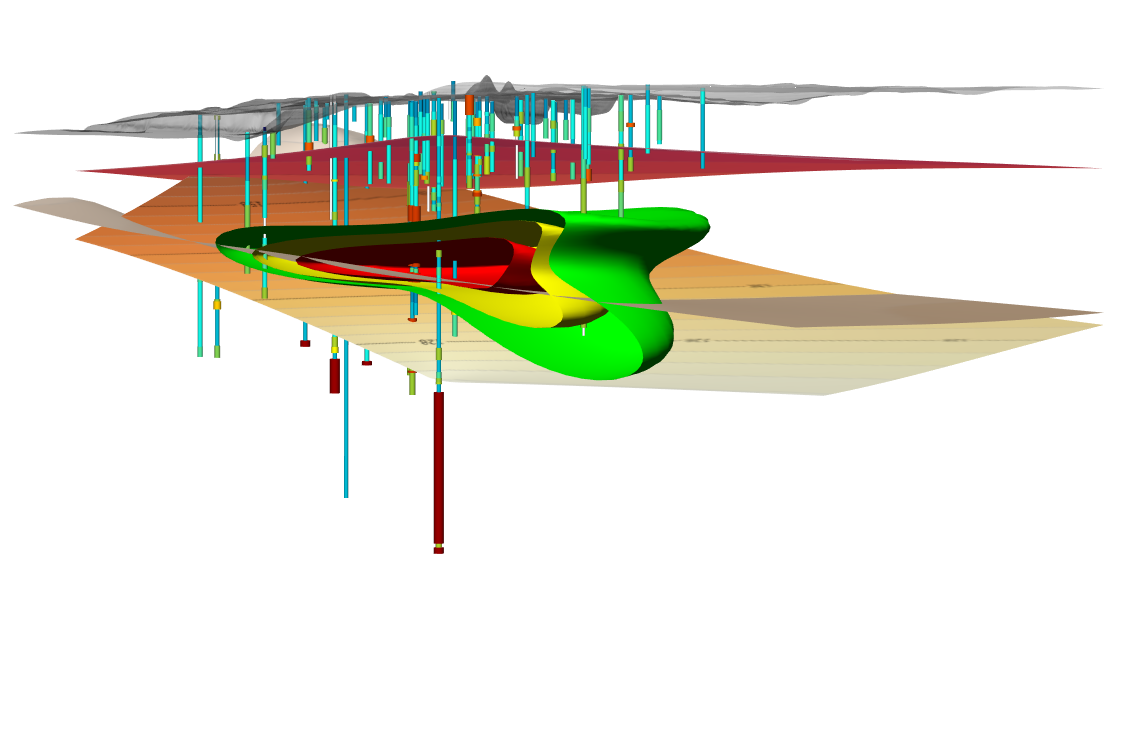
Clarity is critical when creating a 3D model. After all, you need stakeholders to understand your insights. The right lighting can help get the job done.
- Oct 27, 2025|Gabbie Rhodes|5 min
Do you regularly create graphs and charts? If so, you can reduce repetitive tasks by using example scripts to speed things up. Learn more.
- Oct 21, 2025|Gabbie Rhodes|5 min
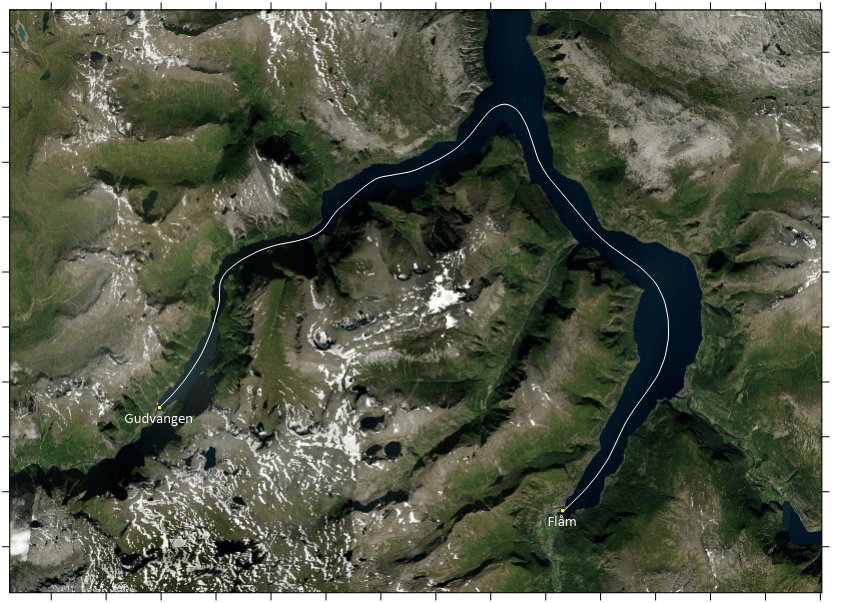
When you're visualizing complex data, sometimes you need to enhance understanding by creating a fly-through of your 3D model. Learn more.
- Oct 15, 2025|Gabbie Rhodes|5 min
How can you know your grid is accurate? There's only one good solution: validating your grid results. Learn how to do it in Surfer!