Surfer Reveals Artifacts & Social Interactions in 1800s Ghost Town
A historical archaeologist is using the Surfer software package to bring the physical and cultural details of a Montana ghost town back to life. Mapping the locations of 30,000 artifacts has revealed the previously unknown layout of the 19th century town and even provided unexpected insights into a community that appears well integrated for its time.
In its heyday of the late 1800s, Highland City was a thriving gold mining town located near Butte, Montana, with a permanent population of 2,000 residents. They lived in 300 wooden houses and frequented 10 saloons, a hardware store, blacksmith shop and other businesses. Remarkably, there are no surviving maps of the town, just three structures sitting in a large mountaintop valley protected by the U.S. Forest Service.
“There’s really not anything that showed what the city looked like,” said Dr. Megan Rhodes Victor. “It’s astounding a place so large was lost to history.”
Victor was working on her PhD in Anthropology at William & Mary in Virginia when she decided to unravel the story of Highland City.
“How these miners went about their daily lives, negotiated their positions, established leadership, and spent their money can often be determined by figuring out how the town was structured,” said Victor.
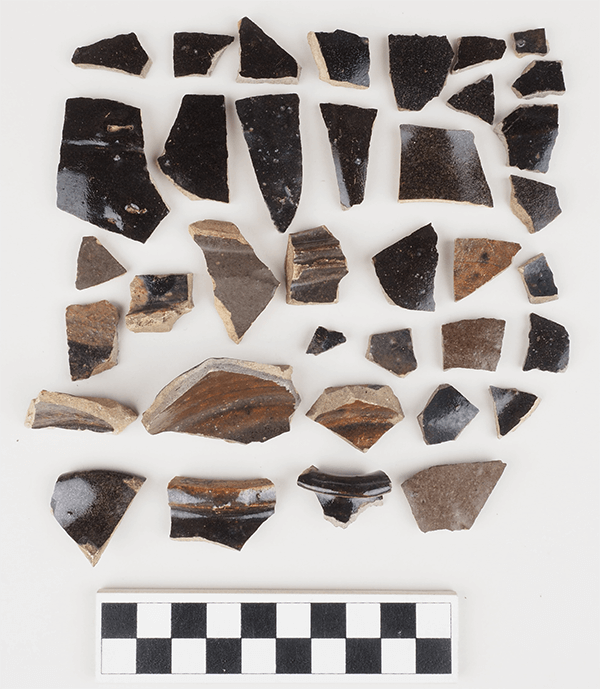
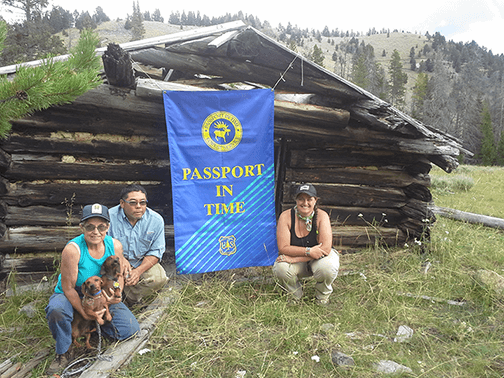
Over three summers as part of the U.S. Forest Service Passport in Time Project (PiT), Victor and teams of students and volunteers dug 300 test pits, about 16 inches deep, on a grid where she suspected the town existed based on the positions of the three surviving buildings. Artifacts such as pieces of nails, wine bottles, jars, and horseshoes found in each hole were carefully documented. Data specifying the type and location of each object was later entered into Surfer to generate distribution maps and predictive models.

“I tried mapping artifacts in a GIS package, but it just showed a bunch of dots,” she said. “Surfer allowed me to create real topographic maps to express artifacts.”
The distribution maps showed hot and cold spots where artifacts were found or not. These enabled Victor to predict where she should focus her excavations. More hot spots ultimately showed up in the Surfer maps on the eastern edge of the study area, indicating the work should be expanded in that direction.
Victor also generated density maps in Surfer showing which test pits had a higher number of artifacts than others. She also filtered the maps to portray distribution of specific types of artifacts. When visualized as topographic maps in plan view (with topographic highs representing lots of artifacts and lows denoting few or no objects), two important phenomena began to emerge.
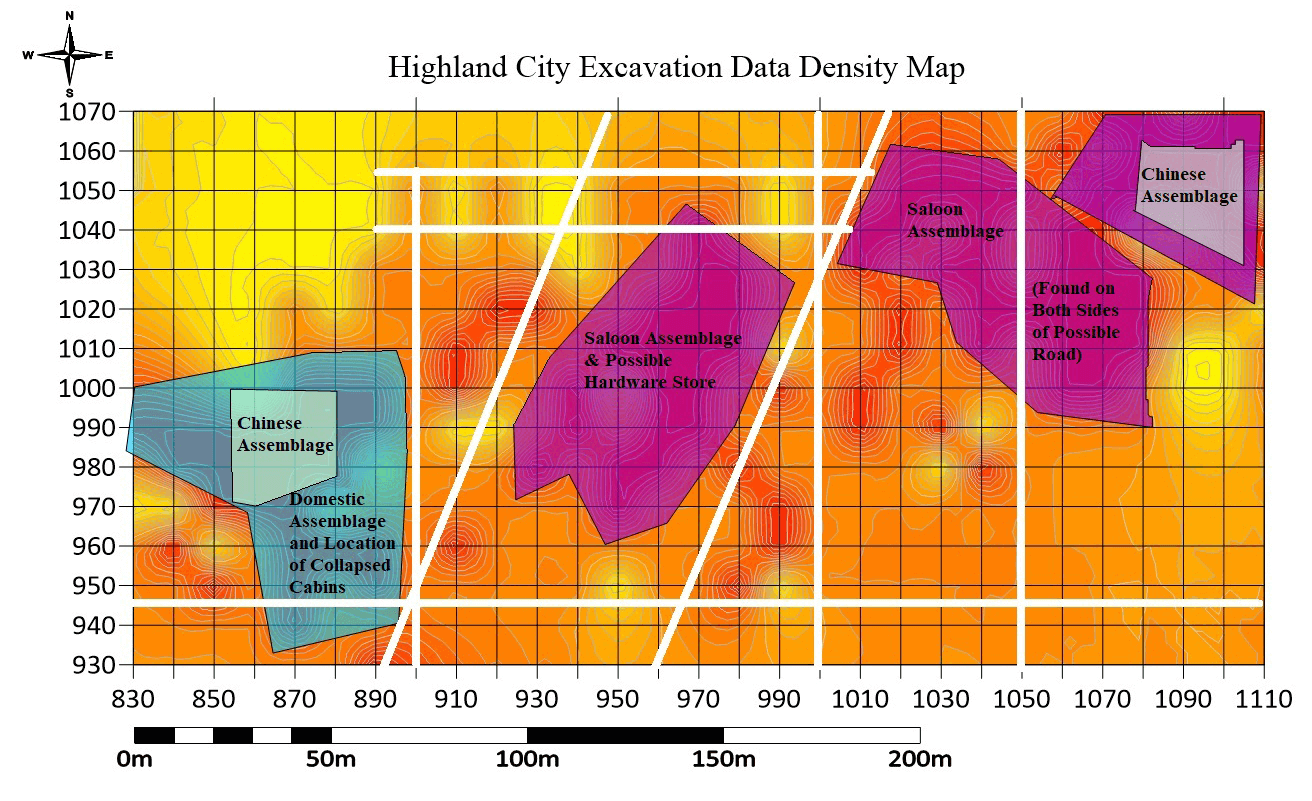
“Long empty parallel spaces with no artifacts showed up…these were roads,” said Victor. “High densities of certain objects, such as nails or wine bottles, indicated where the blacksmith shop or saloon was located.”
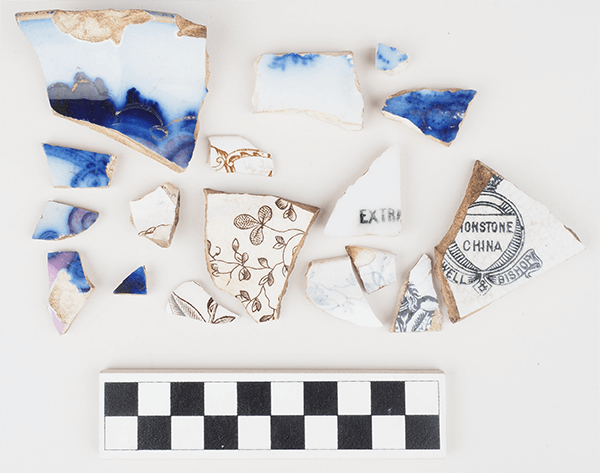
In addition to revealing the layout of Highland City’s crisscrossing streets and locations of businesses and residences, the Surfer topographic maps have hinted at a town that may have been unusually integrated for the late 1800s. Victor found numerous jar and bowl shards that were known to belong typically to Overseas Chinese populations. Not only had there been no record of Chinese residents in Highlands, the distribution maps made another startling discovery.
“There was no Chinatown [where Chinese people lived apart from others as was typical of the time],” explained Victor. “Chinese residents lived in houses spread around the town.”
Victor plans to return to Highland City in coming summers – armed with Surfer – to learn more about the town and its inhabitants.
Golden Guarantee
100% Satisfaction Guaranteed or 100% of Your Money Back
We know Surfer and Grapher’s visualization capabilities will help you stand out from the crowd, WOW clients, and leave a lasting impression!
But… we realize you don’t know this yet. And you won’t until you experience our products for yourself.
This is why we provide this guarantee. This is the distillation of a 40+ year adventure designing, developing, and honing powerful visualization and analysis features as requested by scientists and engineers like you.
Our products can produce results far beyond its license fees. We are assuming all your risk, so you have none.