Turning Terrain into Test Plates: How CUT Boards and Surfer Are Raising the Bar in NDT Operator Performance
Non-destructive testing (NDT) is all about using advanced equipment to test whether structures are safe, sound, and built to last, all without leaving a trace. At its core, it’s a quality control and assurance process that’s useful in various instances, one of which is testing the thickness of an item—whether that’s a bridge member, storage tank, or piping at an oil refinery. These critical structures must be in tip-top shape, as a small oversight can lead to costly failures or worse. That’s why NDT isn’t just about using advanced instruments that’ll help test the safety of a structure. It’s also about the people behind them.
The skill of the NDT operator is just as important as the technology they use. While instruments are routinely calibrated to ensure accuracy, it’s the hands-on experience and interpretation ability of the NDT operator that must be tested and validated more than anything else. In fact, gauging operators’ skills is exactly what PH Tool Reference Standards’ CUT Board – Corrosion Ultrasonic Thickness (UT) Test Plates were created to do. These innovative products simulate real-world corrosion scenarios to help test the competency of NDT operators before they inspect any structures in the field.
Why CUT Boards Are Needed: Testing the Operator, Not Just the Tool
In NDT, the biggest variable isn’t usually the equipment—it’s the person using it. While ultrasonic thickness instruments are designed to deliver precise measurements, it’s the skill and judgment of the operator that determines whether those measurements are interpreted correctly.
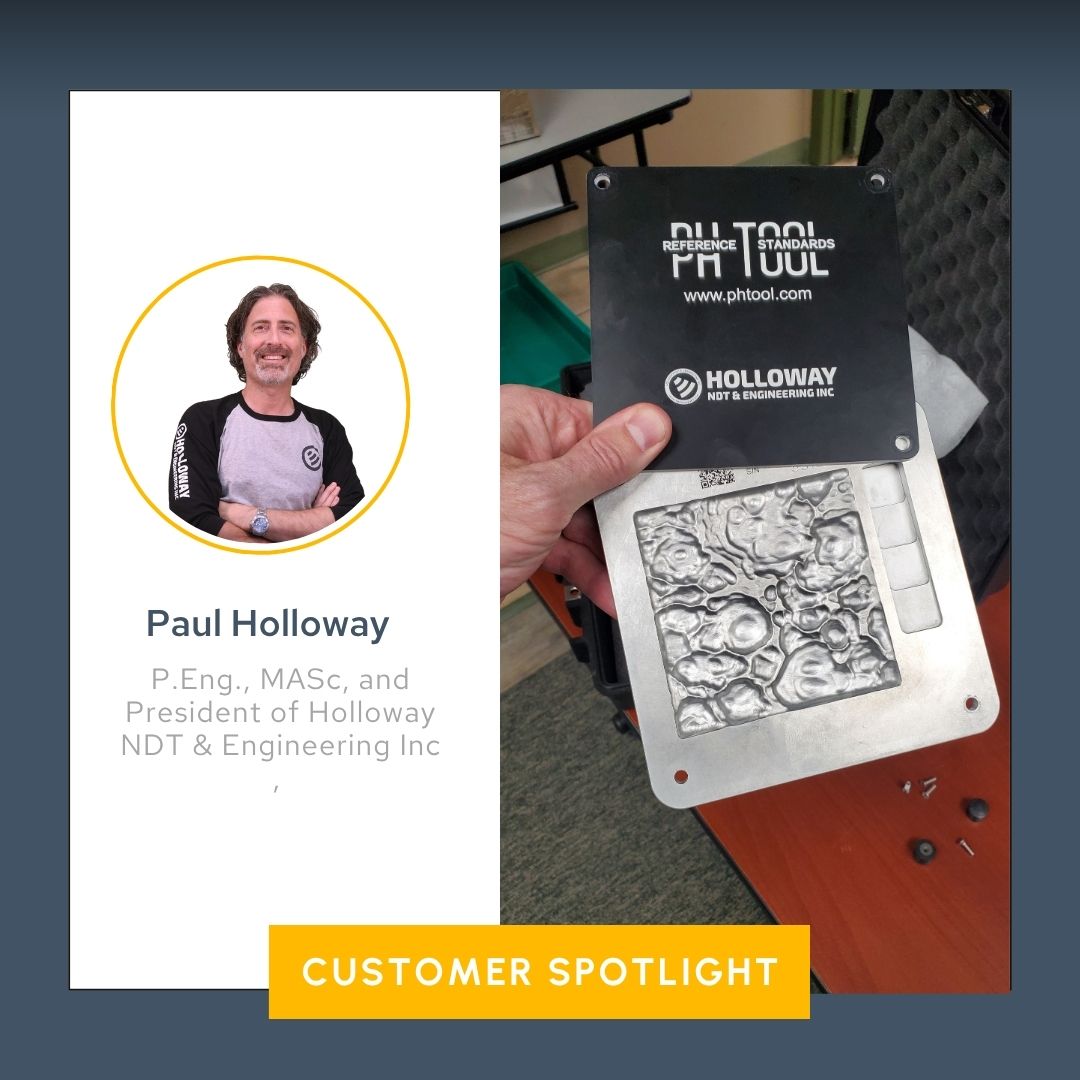
“The skill of the operator needs to be validated because historically and up to the present and the foreseeable future, human interpretation of the signals is what separates the good inspection from the bad inspection,” said Paul Holloway, President of Holloway Engineering Inc. who designs the CUT Boards. “It’s unlikely I’ll grab an instrument that’s not good and that will give me bad numbers. Instead, the chances are that there’s a difference between Inspector A and Inspector B, and one of them may not have the skill set of the other one, so we have to test them with these CUT Boards.”
Developed in partnership with PH Tool, a longtime industry leader in NDT reference standards, CUT Boards were created as a way to standardize operator testing. The idea was brought to fruition after Paul suggested it to Phil Herman, President of PH Tool, a company with decades of experience manufacturing NDT reference standards.
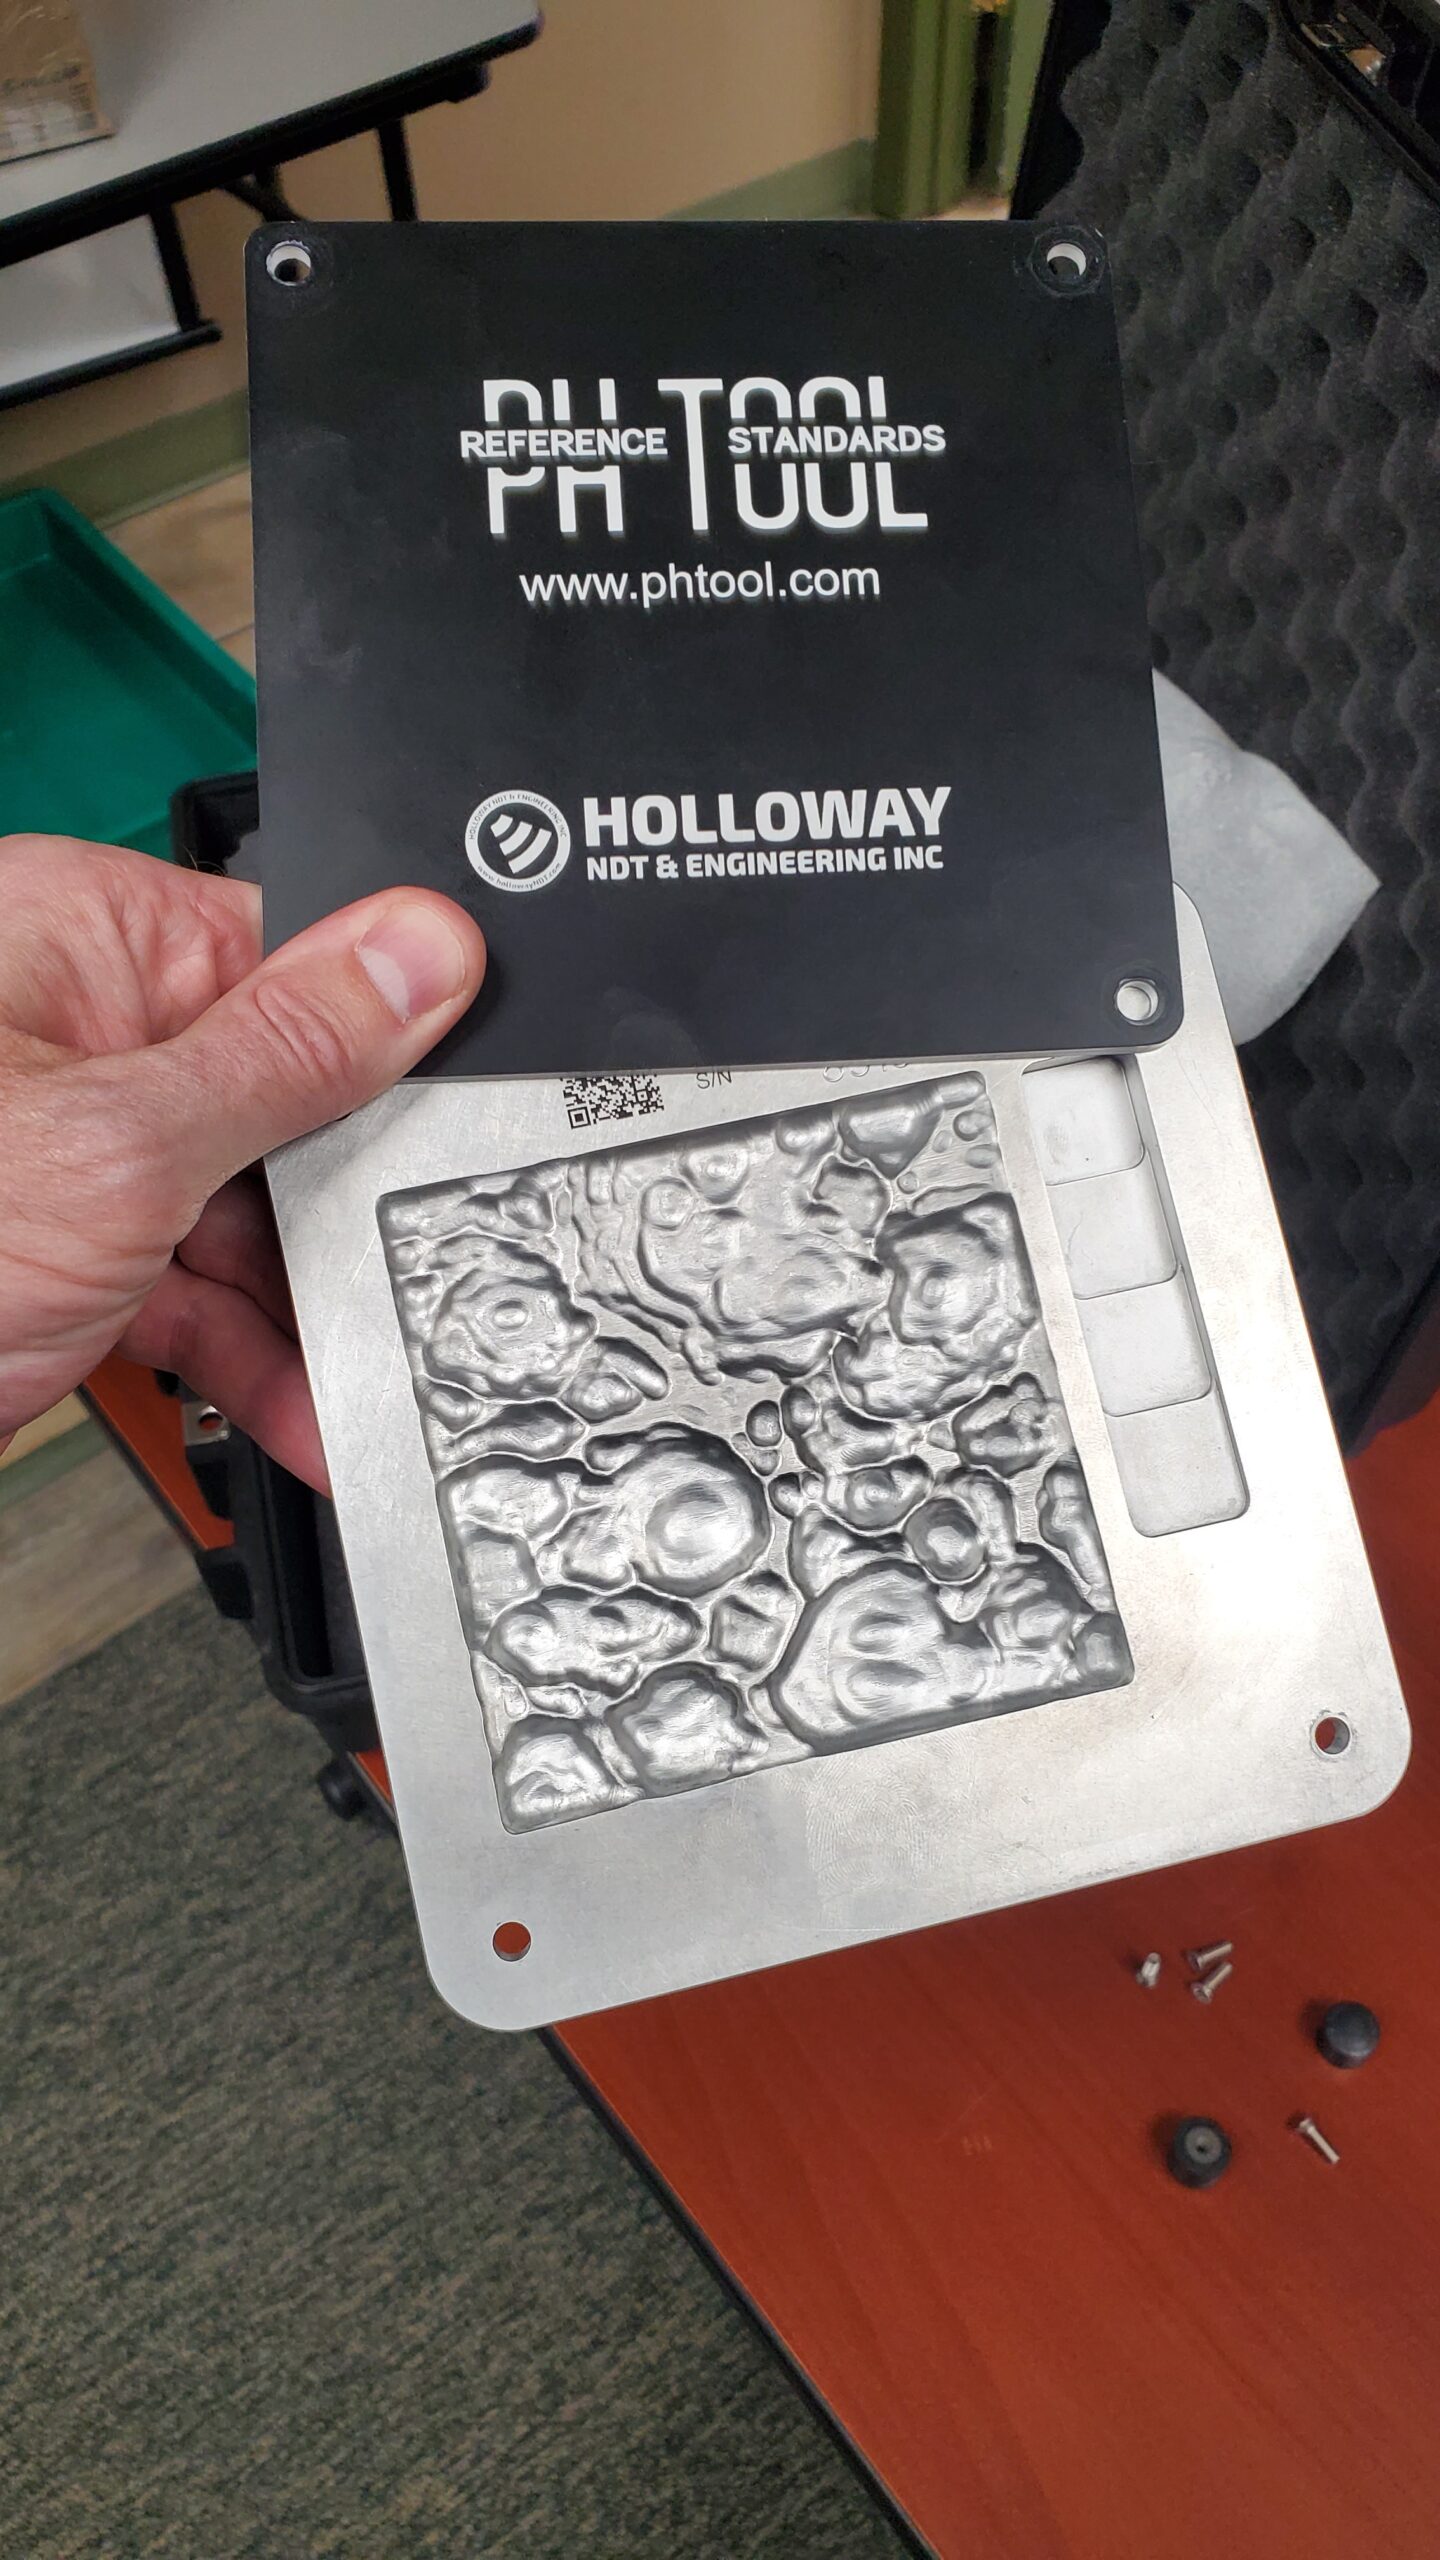
Together, they made the CUT Boards come to life to simulate realistic corrosion patterns and give NDT operators a way to demonstrate their skill in a controlled environment. Using an ultrasonic probe, candidates run scans across the CUT Board’s surface and are asked to assess the thickness at multiple predefined locations. These thickness values are then compared against detailed maps that serve as the “answer key.”
That’s where Surfer enters the equation.
To visualize the complex corrosion patterns machined into each board, Surfer is used to generate clear, compelling maps. These maps present the CUT Board’s thickness data in three different views, making it easy for evaluators to see how readings line up with reality.
From Terrain to Test Plate: How CUT Boards Are Created
So, how exactly does Paul create test boards that mimic corrosion patterns with enough complexity to challenge NDT operators? It starts with one crucial element: terrain data.
To build the CUT Boards, Paul utilizes terrain datasets—real elevation models that mimic the organic, irregular patterns of corrosion. The trick is finding a topographic surface that translates well to a corrosion simulation. Not all terrain works; some areas are too flat or dominated by river data that doesn’t resemble pitting or thinning. But when the right dataset is found, it’s transformed into something much more than a map.
Here’s how it works: First, the terrain model is downloaded and converted into an XYZ height map. That height map is then pulled into a CAD program, where the surface is dropped into a block and subtracted to simulate realistic corrosion across the plate. The CAD model is machined into steel or aluminum, forming the CUT Board’s signature surface. Then, Surfer steps in.
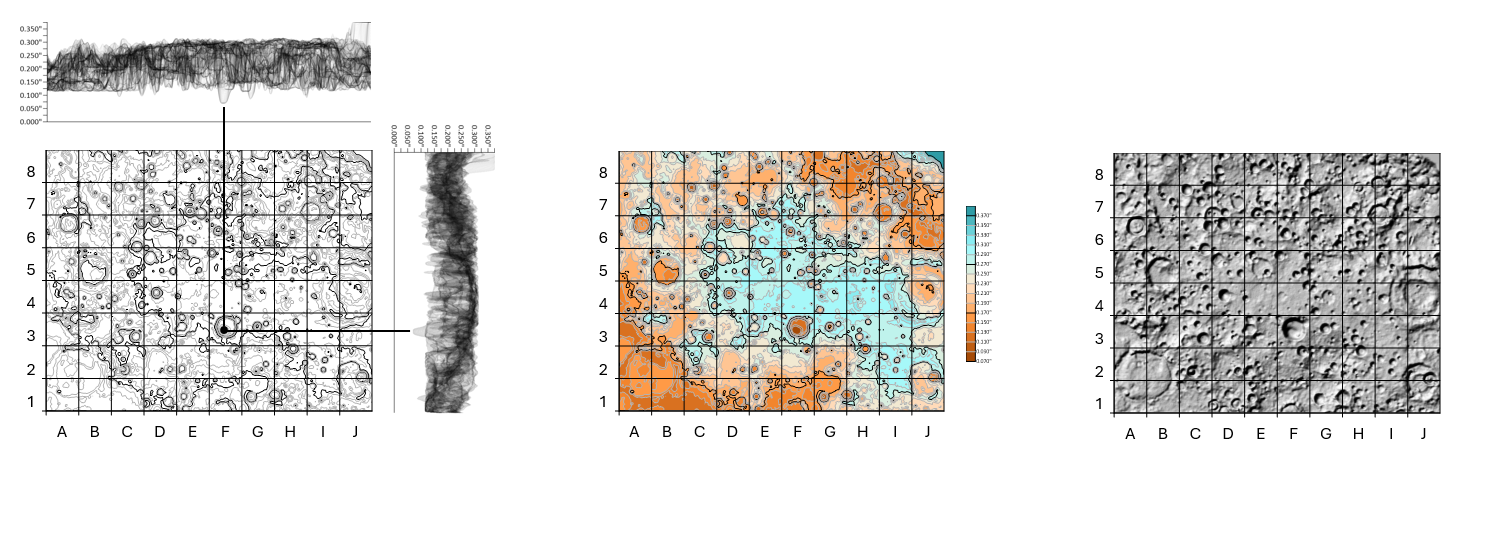
The same terrain map used in CAD is also loaded into Surfer to generate three distinct maps that serve as the “answer key” for each board. The first is a terrain (height) map that gives users a top-down visual of surface thickness variation — it also comes with two wireframes that provide more detail.
“I did a sideways view showcasing a wireframe,” Paul explained. “It looks like mesh, but it’s actually the entire terrain surface presented as if it were silk fluttering. This allows clients to look at it sideways and go, ‘Okay, that’s the profile.’ It’s exaggerated obviously in this direction because it’s only three-eighths of an inch thick, and the map it’s next to is much larger, but it gives clients an idea that there really is no other point on the board that’s this deep in the vertical direction. We do the same thing for the horizontal direction—we place the same wireframe above the map so it helps give an idea of how much undulation is throughout the plate and where the deepest point is.”
The second map is a color relief map. This visual makes it easy to quickly identify thickness differences and spot the deepest point. The third is a grayscale shaded relief map, a high-contrast visualization that helps reinforce surface undulations.
All three maps are bundled into a single PDF that accompanies each CUT Board. These answer sheets make it easy for evaluators to validate operators’ results and reinforce where key corrosion features are located. To make it even more test-friendly, a QR code is printed on the back of every board—hidden during operator testing but accessible during grading. Scanning the code instantly reveals the board’s serial number and corresponding answer maps. This setup ensures NDT operators can’t cheat during a test while making the process simple for evaluators.
“We have many sets of maps with their correlating CUT Board,” Paul said. “There’s one set from Winnipeg, Manitoba in Canada. You can see some of the features of the Canadian Shield. It’s very detailed—you can even see the grade of the land as it slopes out. Some of these sets are really difficult, like the set showcasing Provost in Alberta. We also have a set from the moon, and one called Little Green Man because it’s from Mars. There’s another set from Lubbock, Texas. Some of these sets are very complicated and detailed, creating CUT Boards that lead to harder tests.”
Surfer plays a key role in scoring each board’s complexity. Using Surfer’s Grid Information Report, Paul calculates stats like minimum and maximum thickness and standard deviation. These metrics are then linked to a matrix that ranks each board’s difficulty—so clients know exactly how difficult a test board is and can purchase the one they need.
Why Surfer Is a Go-To Tool for CUT Boards
From detailed visualizations to scoring analytics, Surfer helps bring each CUT Board to life—and ensures every NDT operator’s skill is being challenged with precision. But the outcomes Surfer produces aren’t the only reasons Paul uses the software when designing the boards. He also likes how easy the software is to navigate.
“It’s insanely enjoyable to use,” Paul said. “I used it back in my master’s thesis on piping corrosion, and I remember loving it then. When I started using it again, I quickly got over the learning curve, which really wasn’t that bad. There’s a lot of really good help files and information on the web on how to use it.”
Another aspect Paul enjoyed about Surfer was the palette control he had when creating the color relief map.
“The palette choices are amazing, and the fact you can adjust where it shows the major and minor intervals was great,” Paul explained. “I could set it to every five iso levels or every one iso level.”
For the color relief map, Paul used the blue-orange gradient. It offered sharp contrast and intuitive interpretation, especially when paired with well-defined iso levels. But it wasn’t just the color palette that struck Paul as amazing. In his opinion, it was the grayscale shaded relief maps that delivered the real “wow” factor.
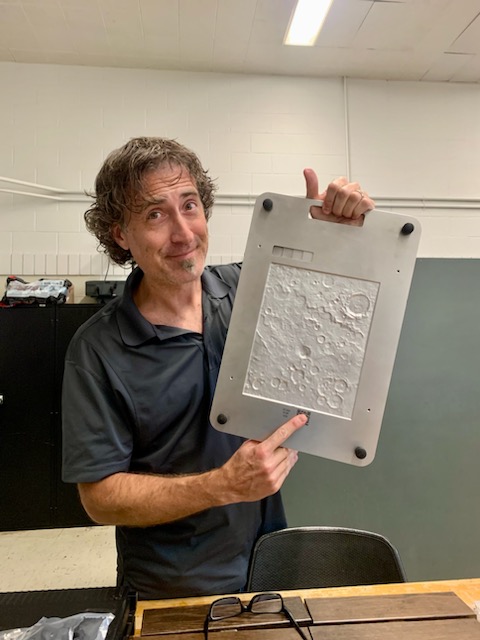
“These shaded relief visuals are just awesome,” Paul said. “Even though clients are looking at it on the back of the CUT Board since they can just flip it over and remove the cover plate to see the pattern, clients still want the map. Our industry deals so much with signals that it’s so nice to have something visual. When you can give clients something where they can say, ‘I bought that, and that’s what it looks like,’ it gives them confidence that their CUT Board is what it is. So, I think for a lot of clients, even though they can’t really use the shaded relief map for any thickness confirmation, it delivers a wow factor and a degree of confidence.”
How CUT Boards Are Used to Test NDT Operators’ Skill
So how do these boards actually work once they’re designed with their answer keys? It starts with one specific tool: the ultrasonic flaw detector.
This device—typically a handheld unit with a display screen and a few ports to plug in probes—is used to measure thickness via ultrasonic testing. At the heart of the process is a transducer, which sends sound waves into the test material and measures how long it takes for those waves to bounce back from the opposite side. The process and equipment is very similar to what’s used during a medical ultrasound. In fact, the same companies that manufacture ultrasonic probes for obstetrics often supply the probes used in NDT. The testing process is also surprisingly similar.
To begin testing, the operator applies a liquid—usually ultrasonic gel but sometimes water—to the surface of the CUT Board. This helps transmit the sound wave from the probe into the material. With the transducer in hand, the operator then places it on the board and moves it from grid cell to grid cell, sending out a short, sharp pulse of sound that travels down through the material and reflects off the back surface.
The time it takes for the sound to return is directly related to the thickness of the material. Longer return times mean a thicker section, and shorter times indicate thinner areas—especially important in corrosion testing, where material loss could pose serious risks.
In that way, the CUT Board becomes a controlled test environment. Operators don’t know the answers ahead of time—the board they’re using has no visible serial number on the front, and the pattern beneath the surface is hidden from view. Just like in a real inspection, they rely on their training, their tools, and their interpretation of the ultrasonic signals to determine the condition of the material.
Once their testing is complete, evaluators can compare the operator’s readings against the answer sheets—the detailed Surfer-generated maps that show the exact corrosion profile of the board. Ultimately, the process is a simple yet powerful way to test an operator’s skill and build confidence in the operator’s ability.
A Real-World Example: Performance Demonstrations in the Field
One of the most important and practical uses for CUT Boards comes into play during what the industry formally calls a performance demonstration. This term carries weight across multiple sectors—especially in oil and gas, nuclear power, and chemical facilities—and it’s a crucial part of ensuring that NDT operators are truly qualified to do the work they’re hired for.
Let’s say you’re a technician working for company ABC, and your team just landed a contract with a major oil company to inspect hundreds of miles of piping for corrosion. Before you step foot on site, the client needs to know one thing: can you actually do the job?
Sure, you might show up with a valid certification that says you’re qualified to perform ultrasonic thickness testing. But in this industry, certification alone isn’t always enough. Think of it like a driver’s license. Just because someone has a license doesn’t mean they’re capable of expertly maneuvering an SUV into a tight parking spot.
So before you’re cleared to work, you have to complete a performance demonstration—a hands-on test where you prove you can accurately assess thickness and detect corrosion using ultrasonic tools. This test isn’t just a formality. It’s a way for company ABC to reduce risk, protect infrastructure, and maintain safety standards.
That’s where CUT Boards come in. Their terrain-modeled surface mimics real corrosion patterns with intricate topographies that challenge your ability to read and interpret signals. When used in performance demonstrations, these boards simulate what you’ll actually encounter in the field—making for a far more accurate and meaningful test of skill.
The takeaway? If companies want to hire the best NDT operators, performance demonstrations are a must. And when it comes to replicating realistic testing environments, CUT Boards offer one of the most sophisticated and effective tools available today.
Precision That Builds Confidence
At the end of the day, NDT is about trust—trust in materials, trust in data, and, most importantly, trust in the people interpreting that data. The CUT Boards designed by Holloway NDT and PH Tool are raising the bar for how that trust is built. By simulating real-world corrosion scenarios with terrain-derived complexity, these test plates are giving organizations a better way to test skills and improve safety outcomes in the field.
Surfer plays a pivotal role in that mission. From generating detailed maps to helping assign difficulty scores and providing visual answer sheets, it’s the glue that ties the science of data to the art of interpretation. The result? A smarter, more standardized, and more realistic approach to operator performance testing—one that puts confidence and accuracy front and center.
Want more stories like this? Subscribe to the Golden Software blog to explore the intersection of science, visualization, and field-tested solutions!
Recent Articles
- Jun 23, 2026|Gabbie Rhodes|10 min
Ever stop and wonder: does AI make mistakes? Before you start using AI tools to create your maps, discover the answer to this key question.
- Jun 23, 2026|Gabbie Rhodes|7 min
What contributions are women making in STEM? Discover eight examples of women in STEM fields and the meaningful impact they’re making.
- Jun 17, 2026|Gabbie Rhodes|8 min
Both work and family require energy and intentionality. To ensure you approach them effectively, discover tips to balance work and family life.
- Jun 17, 2026|Gabbie Rhodes|11 min
Senior Technical Sales Specialist Drew Dudley hosted a webinar to provide tips for ensuring coordinate systems display accurately and consistently.