Need to Create a Graph Quickly? A Wizard is at Your Service.
When it comes to data visualization, quality matters—but so does speed. You don’t always have the luxury of spending hours formatting axes, styling legends, or configuring datasets. Whether you’re racing toward a looming deadline or just trying to get a project done so you can tackle the next one, you need a way to transform raw numbers into a professional-looking graph fast. But what kind of tool can you rely on to create great graphs quickly and confidently? We’re here to give you the answer.
Why You Might Need to Work Fast
Now, before diving into the solution to quickly creating stunning graphs, we want to emphasize that the need for speed doesn’t mean sacrificing quality. It just means your tools need to work harder for you—and there are various scenarios where that reality is essential to your workflow. In fact, here are just a few situations where speed is a critical asset:
You’ve Got a Tight Deadline
Sometimes, projects have quick turnaround times. And if you’re juggling multiple projects with deadlines that are fast approaching, you can’t always spend time navigating menus or setting up every element from scratch. You need software that can take your raw data and turn it into a polished graph with little effort on your end.
You’re an Infrequent User
Maybe you only need to create graphs once or twice a year. When that’s the case, it’s easy to forget your exact workflow or which plot types work best for your data. But instead of trying to retrace your steps from last time, you need a tool that can make it as easy as possible to get that same high-quality final output without relearning everything.
You’re a New User
Using new software can be daunting, especially if it’s complex, but you can’t spend weeks learning every single feature inside and out to create a polished graph. Getting across the finish line requires using a tool that’ll make it easy to get your bearings. That way, you can create professional-looking graphs quickly, without a huge learning curve.
How to Quickly Create a Graph in Grapher
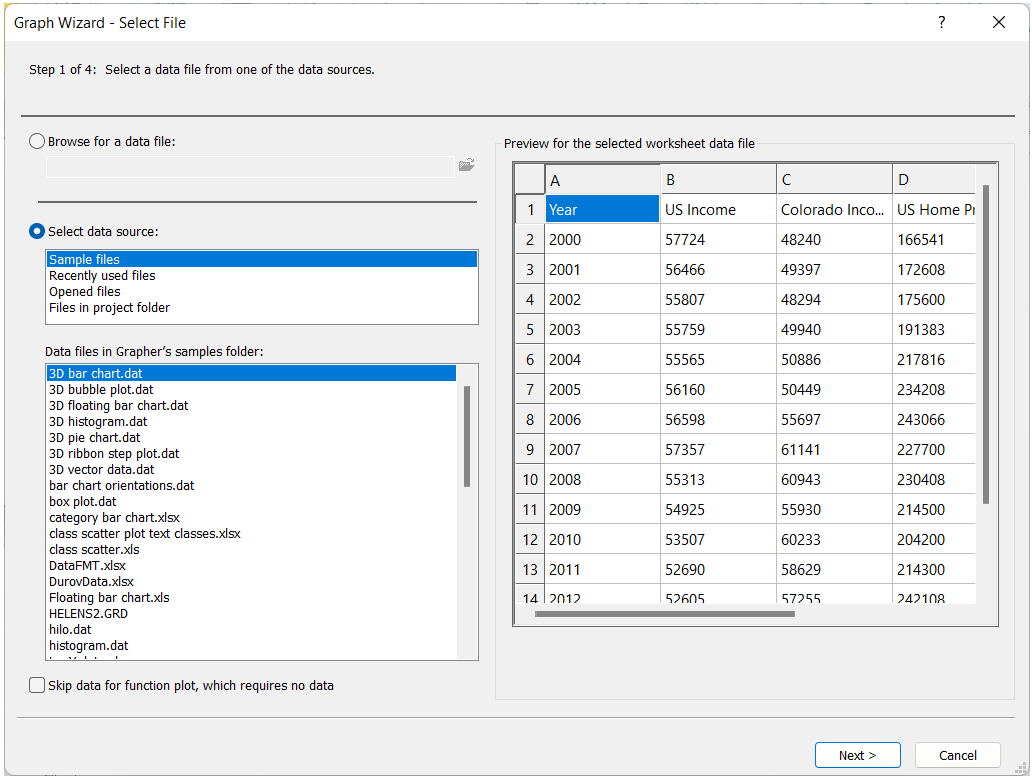
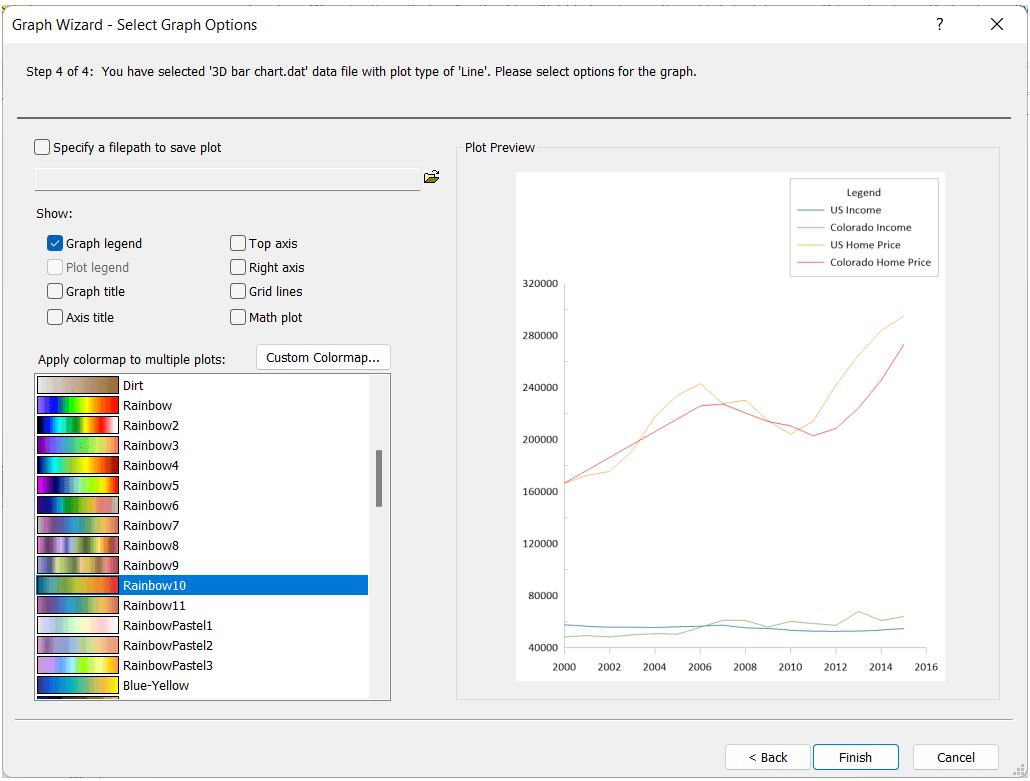
The reasons for needing software that provides results quickly are clear. But what tool can actually help you design graphs in a timely manner? Our answer is simple: Grapher’s Graph Wizard. It’s designed to get you from point A to B quickly and confidently. The feature is a step-by-step assistant built into the software that walks you through everything you need to create a clean, publication-ready graph or chart.
When using it, the Graph Wizard will guide you through choosing your data file, selecting the right plot type, and picking visual elements like colors, labels, and legends—all in one place. It makes your design process incredibly easy because it gives you a simple workflow to ensure you can create and finish a polished output quickly.
To provide more context on how the Graph Wizard does this, here are the benefits it delivers to make it such a powerful tool in Grapher.
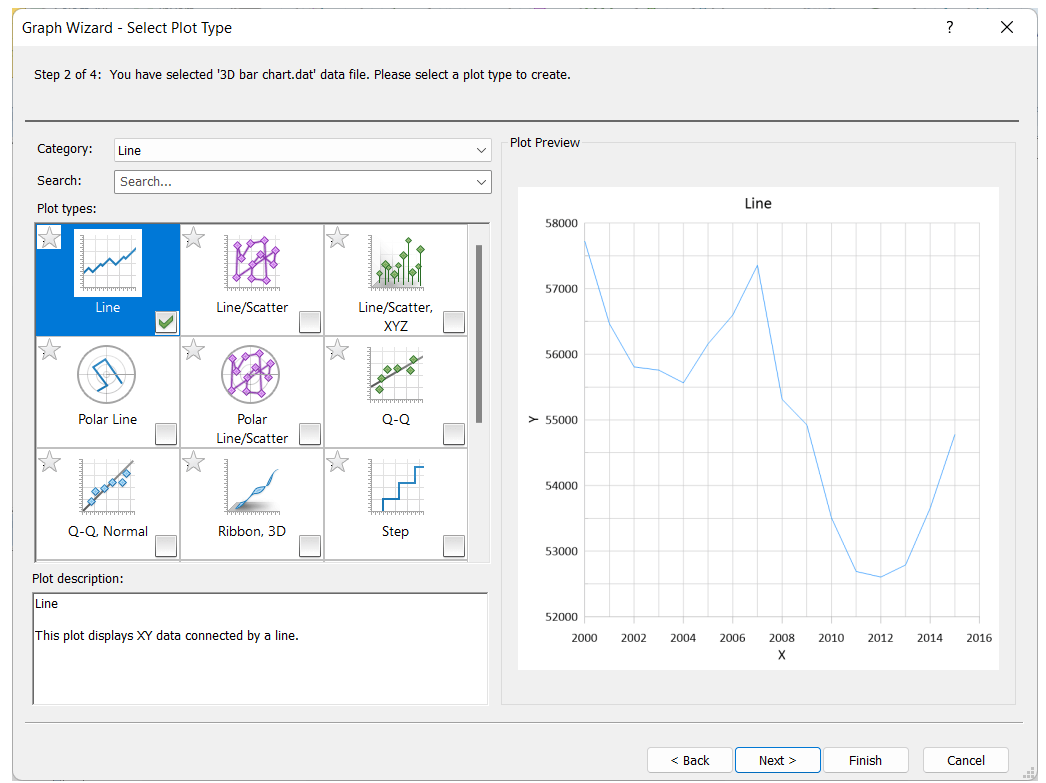
1. Faster Plot Selection
Not sure which plot type is right for your dataset? The Graph Wizard has your back. It shows you a live preview as you select data columns and plot types, so you can adjust on the fly and make sure you’re headed in the right direction before finalizing your graph.
2. Save and Reuse Your Favorite Plot Types
If you find a plot style you like, you can save it as a favorite. Then, the next time you use the Graph Wizard, you can go straight to your favorites to choose a graph or chart among your preferred plots. If you’re a frequent user graph maker who wants consistency without starting from scratch every time or an infrequent graph maker who doesn’t want to remember the plot you liked months ago, this capability is perfect.
3. Built-In Design Elements
Great graphs aren’t just about data—they’re about presentation. The Graph Wizard gives you a way to add essential design elements like legends, titles, and axis labels during setup. That means you won’t have to figure out how to add these elements later, saving you several clicks so you can get to your finished result quicker.
4. High-Quality, Customizable Output
Once you’re done, the Graph Wizard produces a high-quality graph that’s ready to go. But if you want to go a step further, you can easily customize it from there. It gives you a strong foundation so you can tweak colors, update fonts, or add other objects as needed.
Get the Graph Without the Guesswork
When time is short and the pressure is on, the last thing you need is a complicated graphing process. Grapher’s Graph Wizard offers a fast, guided, and intuitive way to produce high-quality graphs—whether you’re brand new to the software or will be a frequent or infrequent user. So the next time you’re up against the clock or just want to get your visualization done without the hassle, remember: Grapher’s Graph Wizard is your shortcut to great results.
Want to try it for yourself? Download the 14-day free trial to start producing professional work more efficiently!