Using an Untraditional Data Analysis Method to Create an Untraditional Monster Map Visualizing Pure Salt in Mexico
When it comes to fieldwork in geophysics, there’s rarely a “typical” project. But even by industry standards, a monster map—which compiles massive amounts of complex information into a single, understandable data visualization—was recently created by the Dewhurst Group for a project in Mexico, and it was something entirely unique.
At the center of this unusual success story? A U.S.-based consulting group that thrives on inventive thinking, a challenging dataset on a salt dome, and a non-traditional analysis method that turns difficult data into actionable insights. Curious to learn how all these things work together? Here’s a story on how the Dewhurst Group made an informative monster map for stakeholders in a unique situation.
Meet Warren and Laura from the Dewhurst Group
First, let’s meet the major players. Warren Dewhurst is the Founder and CEO of the Dewhurst Group, a consulting company committed to spearheading the development of renewable energy projects with a sustainable and comprehensive approach. He’s been a Golden Software user for over a decade and still credits Grapher and Surfer with helping him complete his Ph.D. at the Colorado School of Mines. These days, he spends more time guiding design strategies than executing them in data visualization software—but the tools remain core to his company’s success.
Laura Contreras, the group’s Technical and Socio-Environmental Coordinator, is based in Colombia and collaborates closely with Warren on both fieldwork and data visualization. She’s hands-on, adaptable, and, according to Warren, has officially earned the title of “field wolf” for her ability to handle everything from technical setups to dodging crocodiles and snakes in the jungle when doing projects in wild terrain.
Together, they form a team that blends deep industry experience with bold, exploratory thinking, which helps them create effective monster maps.
“These maps provide a lot of information on one piece of paper, and they were intended to be printed,” Warren explained. “In the old days, no one had computers with big screens. A paper map was still pretty important, and even today, I think it’s still important. People just don’t recognize it.”
For the recent project in Mexico, the tradition of printing a monster map continued. But this one was unlike any other. Why? Because it was built from non-digital data, processed manually, and interpreted using a method few in the field would even consider today.
The Project: Finding Pure Salt in a Contaminated Salt Dome
The Dewhurst Group’s client was a U.S.-based company with contracts in Mexico. Their mission was to identify the most promising location to mine halite—a pure form of salt—in a salt dome, which is typically full of contaminants. The client’s operations ranged from table salt to industrial salt production, and knowing where and how deep to drill was essential to their business.
To complete the objective successfully, Laura did the field work, operating in thick jungle conditions. The equipment had to be carried, set up, and monitored in an area teeming with wildlife and vegetation. Once she collected the data, Warren examined the results and immediately ran into an issue.
“I looked at the data, and it was terrible,” Warren admitted. “It was very, very difficult to work with. In this particular case, we were looking at resistivity. In salt, there’s very little difference in resistivity between good salt and bad salt. Furthermore, the area was full of water. When you have salt and water mixed together, what happens? Conductivity goes up—it starts to melt the salt. It becomes a mess. So, interpreting the data using standard approaches that they would teach at the Colorado School of Mines was useless.”
Still, even with this challenge, Warren and Laura didn’t give up.
From Paper Graphs to Business Decisions: A Manual Inversion Method
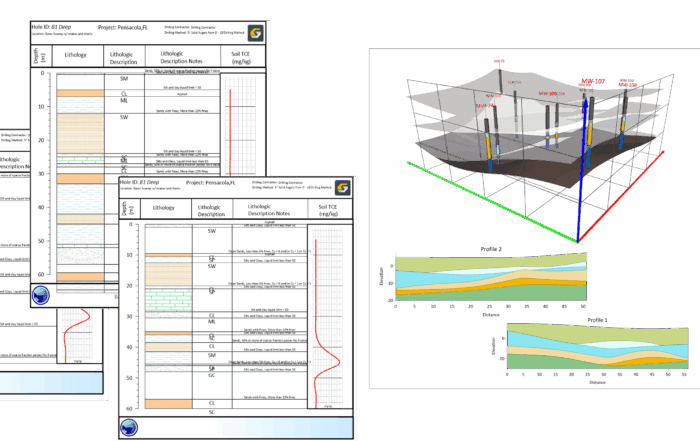
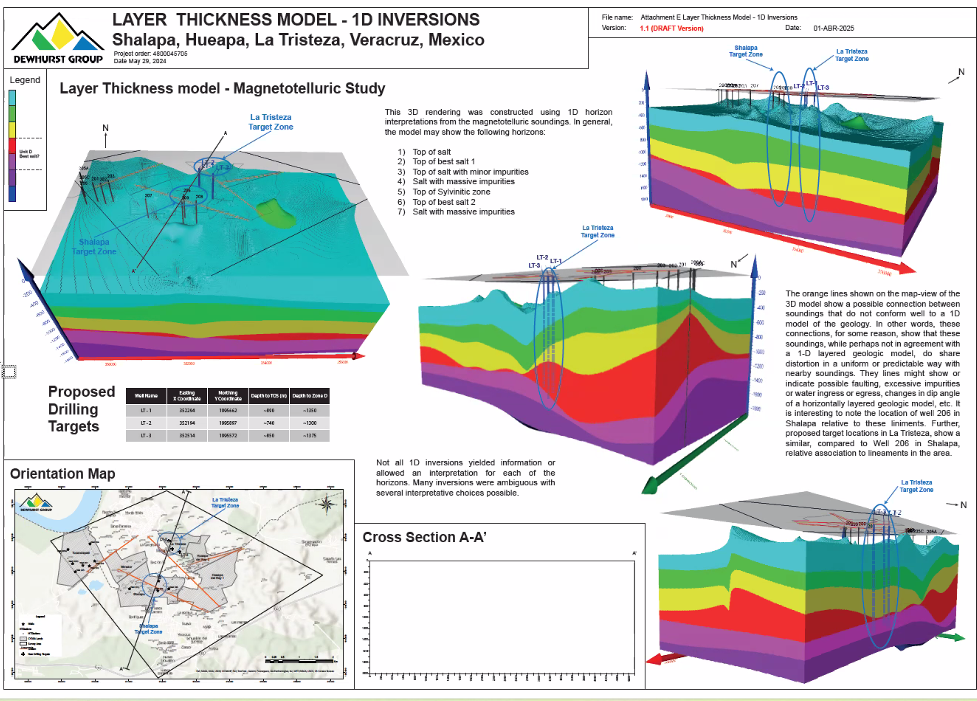
Moving forward with the project required Warren to do what was necessary: think differently. So, he turned to creating 1D inversions. Using a pen, ruler, and decades of experience, he manually interpreted resistivity changes by depth. He then correlated those interpretations with gamma logs from nearby wells. To his surprise, the correlation worked—and what looked like a dead-end dataset could now be transformed into a clear, compelling, and accurate monster map.
“If we hadn’t used that method, I think the survey would have been a total loss,” Warren explained. “Most geophysics companies wouldn’t have even tried to do this. One even said it was impossible, but I used to do this in the ’70s. It just takes time, and you need to have patience.”
Once Warren interpreted the data, the next step was visualizing it to inform the client where and how deep to drill. That’s when Warren had an idea: plot the thickness of each geological layer. To make this happen, Warren handed the data off to Laura, who collaborated with Golden Software’s Business Development Manager Drew Dudley. Together, they used Surfer to bring the idea and resulting monster map to life.
“What I like about Golden Software, especially with Drew Dudley—I’ve known Drew for 15 years—is that the team is always there to help,” Warren said. “I never even feel like a customer. I just feel like another guy who calls.”
Drew’s willingness to assist led to great collaboration between him and Laura. Through their efforts, the final product was a monster map with a series of thickness layers that, when stacked and visualized, offered a clear representation of the geology in the project area. It answered the one question that mattered most: “Where and how deep should the client drill?” Now, it was just a matter of sharing and articulating that answer to stakeholders.
Presenting to Non-Technical Stakeholders: Smoke, Salt, and Simplicity
The client’s CEO didn’t have a technical background, so the nuances of magnetotellurics or the mechanics of geophysical inversion weren’t his main interest. What he wanted was clarity. Where should he drill, and how deep? So Warren did what he’s always done: met the client where they were. He laid out the paper maps and gave a straightforward answer backed by data.
“When I rolled out the paper maps, that got his attention,” Warren said. “It wasn’t about the data; it wasn’t about anything. He wanted me to put a finger on a map and say, ‘This is where you’re going to drill.’”
For this client, it wasn’t just about the technical details. It was about business—about saving money, avoiding unnecessary drilling, and having the confidence to make a million-dollar decision based on a great data visualization.
Beyond Mexico: Building Tools for the Future
For Warren and the Dewhurst Group, successful projects like the one they completed for the salt company are all about creativity and the ability to turn complex insights into business decisions.
“It’s about how quickly you can actually develop an approach and execute that approach sufficiently well that an executive can have confidence in your results and make a decision based upon the business,” Warren said plainly.
That’s what this most recent monster map did. It helped a salt company make critical decisions based on untraditional analysis methods that were executed by a nimble team and visualized with trusted tools.
Want to read more stories like this one? Subscribe to our blog to discover some of the latest projects impacting the world of geoscience!