Webinar Recap: Wow Stakeholders with Publication-Quality Maps and Models
Recently, our Senior Technical Sales Specialist Drew Dudley hosted a live webinar on how to wow stakeholders with publication-quality maps and models in Surfer. From base layers and title blocks to legends and final layout touches, Drew gave attendees guidance on how to refine every visual detail to make their deliverables stand out. Curious to know the specific steps he walked through in his workflow? This blog will dive into the key takeaways Drew shared in his webinar to help you perfect your maps and models for maximum impact.
Mastering the Essentials
To kick off the webinar, Drew jumped straight into what makes the difference between an average map and one that truly impresses stakeholders: the finishing touches. While your data tells the story, it’s the supporting elements like base layers, legends, title blocks, and more that determine how clearly that story is told. To put this into perspective, Drew opened Surfer to transform an existing project into a publication-quality final product.
1. Loading Frame Templates and Setting Coordinate Systems (Timestamp—4:57)
Drew started with a foundational step in creating visualizations that wow stakeholders: selecting a frame template, a preformatted layout that makes it easier to create polished outputs that follow consistent formatting. Once the frame template was open, Drew turned his attention back to the existing project and its coordinate systems and explained why they’re so critical in any mapping or modeling project.
Simply put, every map frame contains a target coordinate system, which is the system you want your final map to display in. Each data layer, however, also has its own source coordinate system, which may differ from the map frame or other layers. Surfer automatically handles these reprojections and transformations under the hood, but only if the target coordinate system is correctly defined. Drew demonstrated how to set this up properly and adjust the map limits and scale afterward to bring the display back into focus. Once configured, the benefits became clear.
Setting the correct coordinate system not only ensured all the layers aligned perfectly but also unlocked the opportunity to download imagery from WMS servers like OpenStreetMap and Google Maps. Drew also noted additional perks: once your coordinate system is defined, you can easily add a scale bar and use Surfer’s measuring tool for precise distance and area calculations.
2. Leveling Up Legends for Clearer, More Polished Maps (Timestamp—22:29)
Next, Drew walked through the new legend improvements in Surfer Beta. These enhancements give you far more flexibility to customize your map legends, making it easier to communicate data with precision and polish. Drew highlighted these updates by first focusing on contour layers. You can now display contour lines and labels directly in your legend. You can also include major or minor contours, specify exact levels to highlight key information, and even label whether the data represents elevation, depth, or concentration. This gives your map an extra layer of clarity and visual appeal for stakeholders.
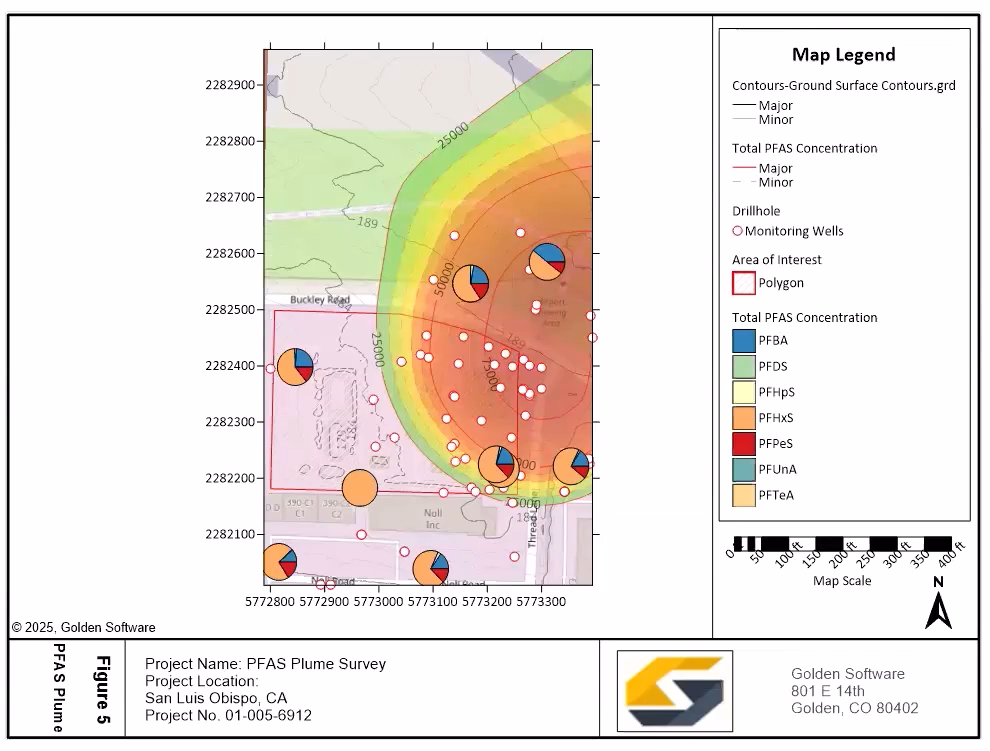
Additionally, Drew showcased the flexibility to add additional map layers—like property boundaries or base layers—to the legend, giving you full control over what appears in your final output. One of the most exciting improvements he also highlighted was the ability to include drillhole symbols in your legend, even when symbology isn’t applied. This means your stakeholders can immediately recognize key elements like monitoring wells without confusion. And for maps with pie charts or other symbolized layers, these can now be added to your legend, ensuring complex datasets (like PFAS concentration charts) are displayed with clarity and consistency.
3. Building a Professional Layout With Frame Templates and Linked Text (Timestamp—34:04)
With the map polished and the legend fine-tuned, Drew shifted gears to focus on presentation, and specifically, how to assemble a clean, professional layout using Surfer’s frame templates. These templates make it easy to organize all your essential map elements (like the map itself, legends, titles, and scale bars) into a cohesive, publication-ready output.
To demonstrate, Drew opened a frame template and copied the completed map from the main plot window and pasted it into the frame. Once everything was pasted in, Drew resized and repositioned the components to achieve his desired layout and then customized the frame with company information and branding.
From there, Drew showcased one of the most powerful tools for working efficiently across multiple figures: linked text tables from Excel. By linking fields like company name, address, or project title to a single Excel table, you can update all your frame templates automatically. If that information changes (say, a project number or contact name), every linked figure in your report or presentation will update instantly.
4. Exporting to PDF to Share Polished Results With Stakeholders (Timestamp—43:34)
After walking through how to perfect the map, Drew wrapped up the session with one of the most important steps in any workflow: exporting the final output to share with stakeholders. Once your map or model and supporting elements are finalized in Surfer, it’s time to share them in a clean, professional, and easily viewable format.
The best way to do that? Export to Vector PDF.
Drew explained that exporting as a vector-based PDF ensures your map maintains crisp, publication-quality detail—no matter how much someone zooms in. Unlike raster exports (like JPEG or PNG), vector PDFs preserve line quality, text clarity, and symbol precision. This means features such as contour lines, annotations, and legends remain perfectly sharp and readable, even in large-format printing or digital presentations.
Deliver Maps That Truly Impress
By the end of the webinar, Drew had demonstrated how to take maps and models from functional to truly stakeholder-ready. His workflow showed how paying attention to details—like setting accurate coordinate systems, refining legends, organizing layouts with frame templates, and exporting as vector PDFs—can make all the difference between a basic output and one that commands attention.
Every step in his process was designed to help you deliver visuals that clearly communicate your data and set your work apart. Want to see the entire workflow in action and learn the finer details of each step? Watch the full webinar, Wow Stakeholders with Publication-Quality Maps and Models, to get deeper insights from Drew.
Was this helpful?
Share This Article:
Leave A Comment
Recent Articles
- Mar 25, 2026|Gabbie Rhodes|10 min
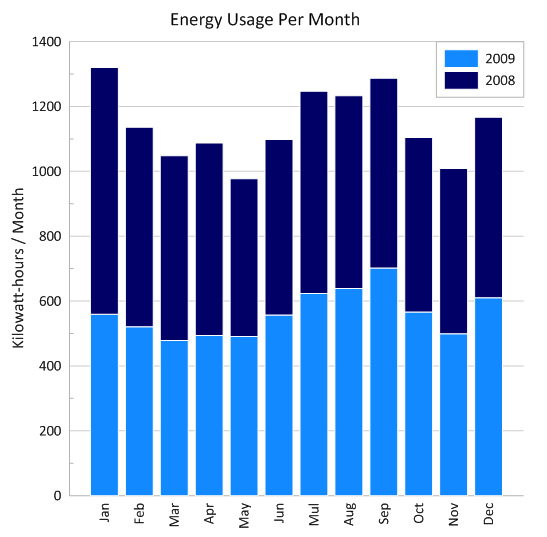
Stacked bar charts are one of those visuals that everyone recognizes but doesn’t always use to their full potential. Discover how to use it effectively.
- Mar 25, 2026|Gabbie Rhodes|11 min
One of the most common choices in scientific data visualization is deciding between a log scale vs. linear scale. Here's how to choose wisely.
- Mar 20, 2026|Gabbie Rhodes|6 min
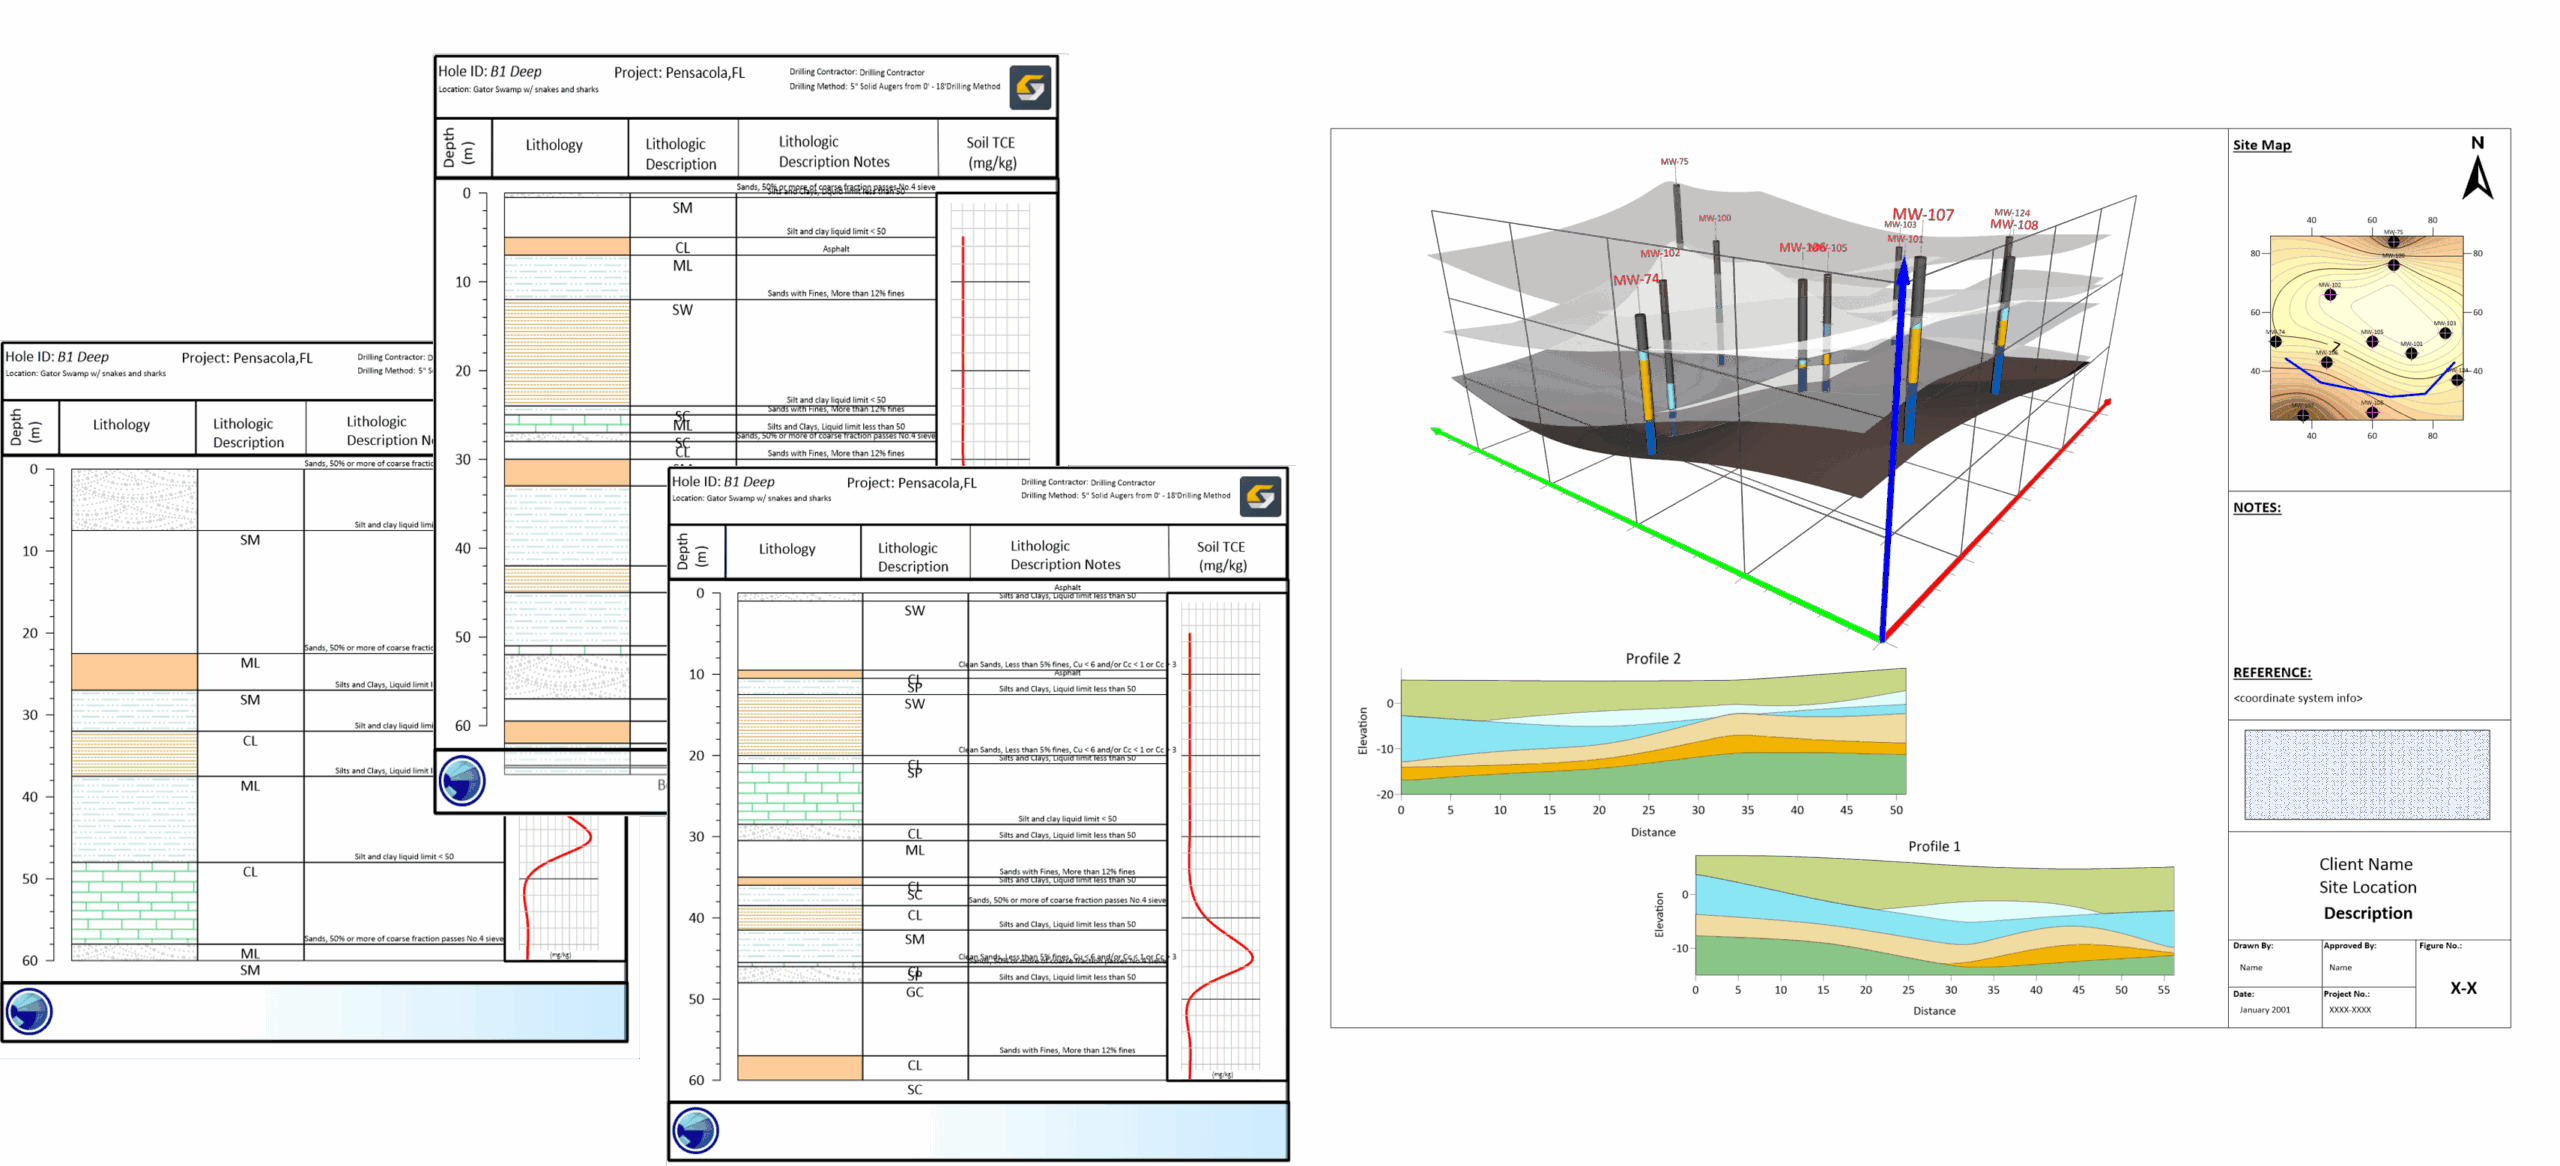
In a recent webinar, Drew Dudley showed how to transform raw borehole data into polished 2D borehole logs and 3D models.
- Mar 20, 2026|Gabbie Rhodes|9 min
Behind many landmark discoveries are historical women in geosciences. Discover the women who helped lay the groundwork for modern research.