From Sludge to Strategy: How Visualizing Wastewater in Lagoons Helps Turn Data into Decisions
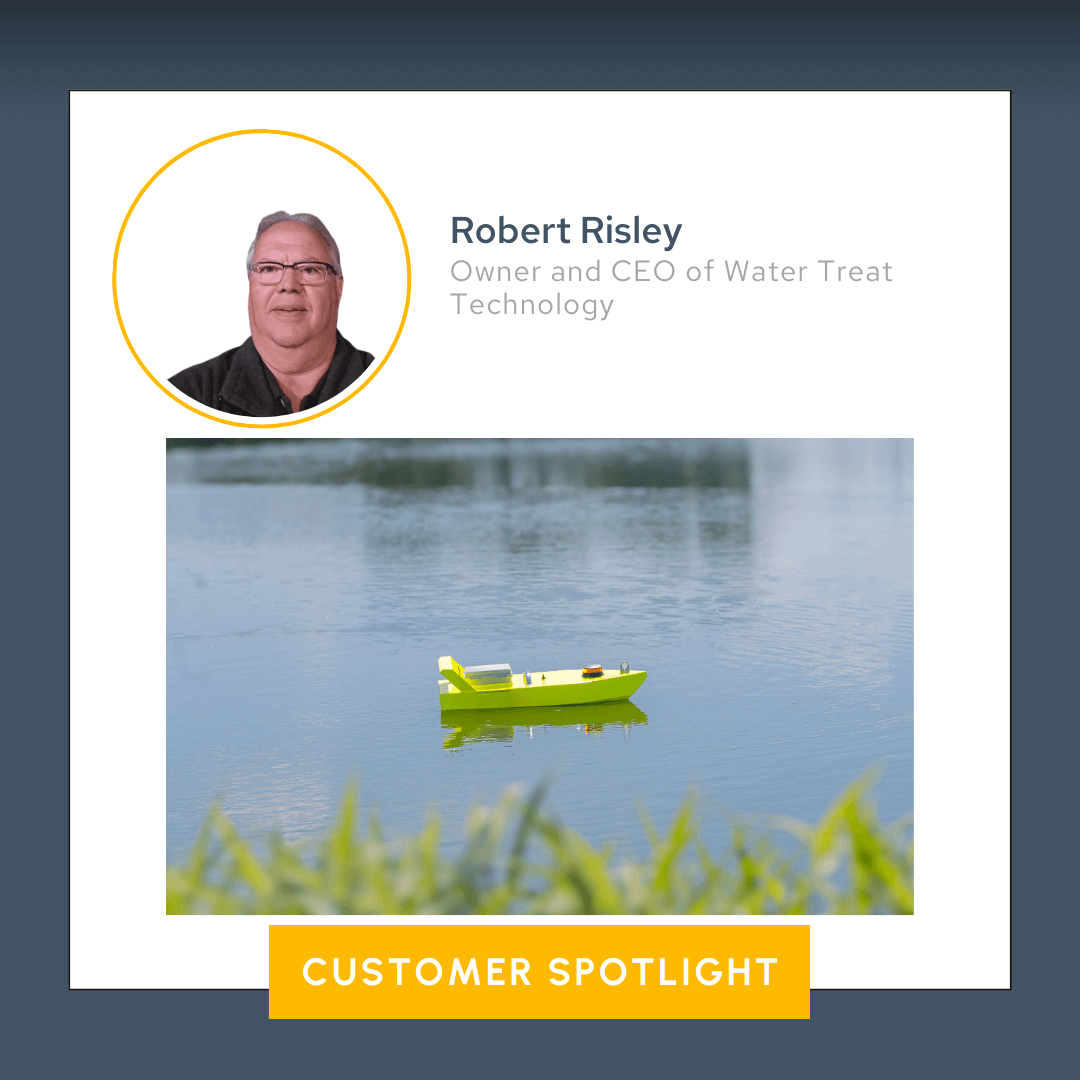
When it comes to wastewater lagoons, there’s more going on beneath the surface than most people realize. For Robert Risley, Owner and CEO of Water Treat Technology, mapping that unseen world isn’t just important—it’s essential.
Robert’s company specializes in lagoon sludge surveys, helping manufacturers and municipalities understand how much sludge has built up, how much it will cost to remove, and when to take action. It’s the kind of data that can shape budgets, influence grants submissions, and determine the future of critical infrastructure. And to bring that data to life, Robert relies on Surfer.
Turning Sludge Surveys into Strategic Insights
At first glance, a lagoon might look calm and still, but below the surface, sludge accumulates year after year. That buildup can drastically reduce the lagoon’s retention time, creating a costly liability—but understanding when that liability actually needs to be treated is difficult. Fortunately, that’s where Water Treat Technology comes in.
Using an RC boat equipped with sonar and GPS, Robert’s team collects depth readings across the entire lagoon. They run roughly 30 to 40 sludge surveys each year—and sometimes more—for clients who treat their lagoons as valuable assets.
“The lagoon is basically an asset, and the sludge is a liability,” Robert explained. “So our customers want regular updates. They want to know what the liability is and when to start planning for removal.”
A Visual Advantage That Speaks to Everyone
Once the data is collected, Robert and his team need to communicate it effectively. After all, data is valuable—but only when it’s understandable. To get the job done well, Water Treat Technology relies on Surfer and its data visualization tools.
“There are plenty of programs out there that give us the numbers,” Robert said. “But what we like about Surfer is that it gives us clean, palatable, and professional visuals.”
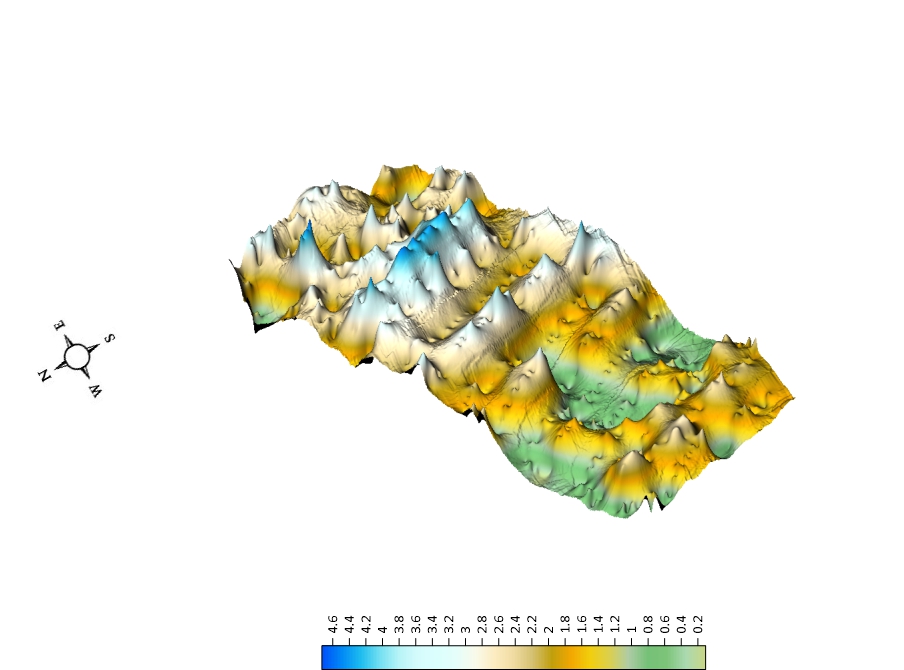
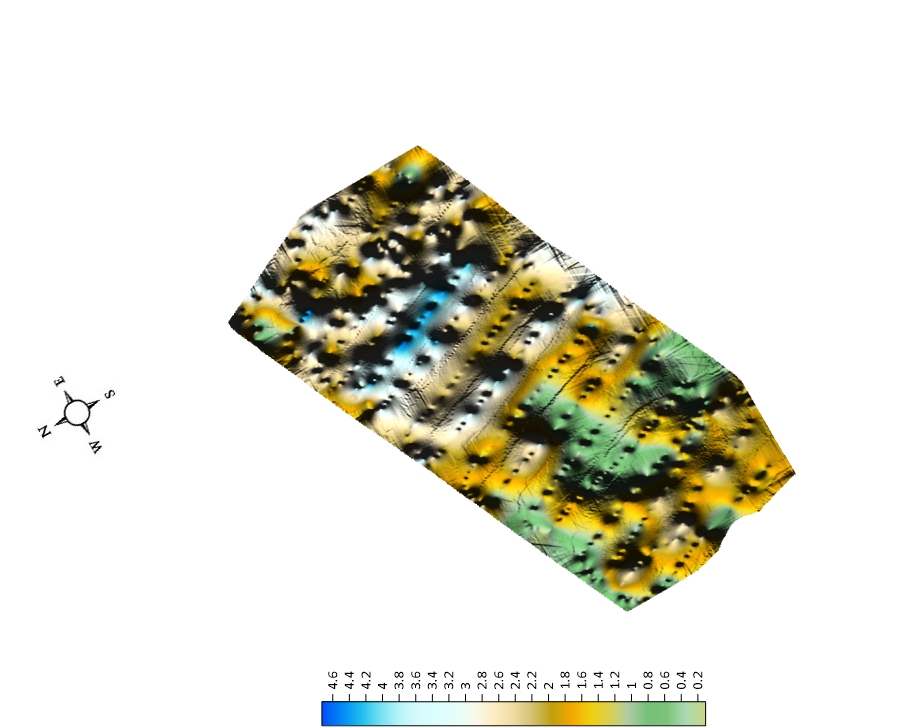
Using Surfer, Robert’s team creates clear, compelling, and accurate 3D topographic maps that help stakeholders—from wastewater operators to board members—actually see the sludge that’s building inside their lagoons. These 3D visuals put everything into perspective, giving stakeholders the insight they need but would’ve struggled to get with a 2D format.
“People don’t always understand what a topographic map is,” Robert said. “But show them a 3D image and it clicks.”
That clarity is essential when Robert’s clients must make important decisions about sludge removal or grant applications. Because his team wraps all the data into one compelling, easy-to-understand visual that ties the technical and the practical together, manufacturers and municipalities know when it’s time to treat their lagoons and can pursue grants if necessary.
Offering Strategic Value with 3D View
Understanding when it’s time for treatment isn’t the only benefit Water Treat Technology provides. Robert and his team also offer strategic value to every project using Surfer’s 3D View.
“When looking at a body of water, it’s hard to know where the sludge is just from the numbers,” Robert explained. “But Surfer’s 3D View gives us the ability to actually see where the buildup is occurring and why it’s happening there.”
This kind of information helps Robert’s team not only diagnose sludge accumulation but also strategize where to treat or remove it. Whether they’re recommending targeted aeration or pinpointing ideal treatment zones, the models made in Surfer’s 3D View help Water Treat Technology back up every recommendation with clear, visual evidence.
“The 3D images offer a very good visual reference, especially whenever we have to present to somebody in a governing agency and need to tell them what we want to do and why we want to do it,” Robert said. “The visual makes it all click. It puts two and two together so they can say, ‘Okay, if we get rid of this big pile of sludge here, that’ll lead to the most effective treatment.”
These 3D images are also a major advantage if stakeholders in the governing agencies aren’t familiar with wastewater and its related terms. With the clarity and straightforward nature of 3D visualizations, everyone in the room can get on the same page regarding the issue and precise strategy.
Customizing a Workflow That Works in the Field
While Robert’s team is seeing success with Surfer, it wasn’t always easy to quickly create amazing data visualizations. The right workflow was needed, and two people helped provide it: Water Treat Technology’s Software Analyst Nikki Ellis and Golden Software’s Customer Support Engineer Rachel VanOsdol. Together, they helped Water Treat Technology develop a streamlined workflow tailored specifically to the company’s needs. The same process that used to take days can be done in a matter of minutes.
“We spent a long time developing it,” Robert explained. “But it’s completely transformed the way we do things.”
His field team can now collect data, process it, and deliver visual results to the client—all in the same day. Sometimes, Field Technician Eric Engele even handles the mapping on-site and emails the results to Robert in real time. That speed and flexibility have set Water Treat Technology apart.
“We’re literally able to give customers visual reports right there if we need to,” Robert said. “That’s definitely set us apart from everybody else.”
This efficient and effective Surfer workflow was something Rachel was committed to providing, a desire that’s characteristic of Golden Software’s customer support team. She had no problem partnering with Nikki to accomplish that goal and ensure Robert’s team had a process that produced high-quality final outputs.
“Rachel has done a fantastic job,” Robert said. “She’s so nice to work with. She knows Surfer inside and out. She’s very knowledgeable about it, and she puts it in simple terms that we can understand. When we hit a snag, she helps us get through it.”
That kind of personable, knowledgeable support has proven invaluable—especially when dealing with complex projects. In one recent case, Robert’s team ran into challenges, which led them to reach out to Rachel for assistance.
“Field Technician Eric was working on a sludge survey project in Canada, and he had to call Rachel because we couldn’t figure out an issue,” Robert recalled. “Well, Canada uses a different set of georeferences, and Rachel gave them to Eric. Then, we were able to continue and give the customer what he wanted. It’s rare that you find somebody who knows their software like a second language, but she’s so fluent in it that it makes it easier for us to do our job.”
Turning Sludge into Strategy
For Robert Risley and his team at Water Treat Technology, every sludge survey is more than a data collection exercise—it’s an opportunity to provide clarity, guide important decisions, and protect valuable assets. With Surfer as part of their toolkit, they’re able to turn raw sonar and GPS readings into actionable insights faster than ever before. From creating intuitive 3D topographic maps that even non-technical stakeholders can understand to speeding up workflows so clients get results in hours, Water Treat Technology delivers real value with every project.
“Surfer really opened doors for us,” Robert said. “It helps us do our work better, faster, and in a way that’s easy for everyone to understand.”
Want to read more stories like this one? Subscribe to Golden Software’s blog to discover how scientists and engineers are transforming and excelling in their field!
Recent Articles
- Jun 23, 2026|Gabbie Rhodes|10 min
Ever stop and wonder: does AI make mistakes? Before you start using AI tools to create your maps, discover the answer to this key question.
- Jun 23, 2026|Gabbie Rhodes|7 min
What contributions are women making in STEM? Discover eight examples of women in STEM fields and the meaningful impact they’re making.
- Jun 17, 2026|Gabbie Rhodes|8 min
Both work and family require energy and intentionality. To ensure you approach them effectively, discover tips to balance work and family life.
- Jun 17, 2026|Gabbie Rhodes|11 min
Senior Technical Sales Specialist Drew Dudley hosted a webinar to provide tips for ensuring coordinate systems display accurately and consistently.