Add High-Quality Context Without the Hassle: Google Maps is Now at Your Fingertips
Maps and models are powerful on their own—but sometimes, they need a little extra context to tell the full story. Whether you’re showing stakeholders where data was collected, comparing surface features, or visualizing change over time, adding imagery can help your work resonate and land with greater impact. But how can you provide context effectively and efficiently? Look no further than the access you now have to Google Maps in Surfer’s XYZ Tiles List.
Get the Context You Need Directly from the Source
With the integration between Google Maps and Surfer, you now have three Google servers at your fingertips to provide the context your maps and models need: satellite imagery, roadmaps, and a hybrid of both. This means the imagery you rely on in your day-to-day life is now accessible in your workflow, and it’s not just any imagery—it’s high-quality, up-to-date imagery.
Before this integration, you might have relied on the National Agriculture Imagery Program (NAIP) for imagery in the United States, which has long been considered an industry standard. The main downsides? The program often has outdated visuals, inconsistent update cycles, a quirky coordinate system that makes alignment a hassle, a tendency to go down, and it only provides imagery for the United States.
Now, with Google Maps accessible directly in Surfer, you get access to a reliable server with consistently updated global imagery sourced from multiple providers. Google pulls data not only from Landsat but also from Maxar, Airbus, and other high-quality global sources. That means you’re no longer limited to a single aging data stream—you’re seeing composite imagery from a variety of up-to-date providers right inside Surfer. The main takeaway? You can trust that the context you’re adding is timely and relevant.
Enhance Your Workflow With Google Maps in Surfer
Now, maybe having access to Google Maps in Surfer sounds great, but perhaps you’re wondering this: will this new integration slow you down in any way if you use it? After all, the last thing you want is to add more steps to your workflow when you’re already pressed for time. The good news is that accessing Google Maps in Surfer’s XYZ Tiles List would benefit your productivity, not hurt it.
Before this integration, if you wanted to include Google Maps imagery, you had to leave Surfer, open Google Earth on a browser, pinpoint the exact location you need, download a JPG file or take a screenshot, import the image into Surfer as a base layer, and georeference the image using coordinates from at least three known points. That was a lot of steps—but now, you can skip all of them.
With Google Maps available directly in the XYZ Tiles List, you can add georeferenced satellite, road, or hybrid imagery to your map in seconds—all without ever leaving Surfer. This removes multiple steps from your workflow, reduces room for error, and gives you more time to focus on analysis and map creation. (Check out the visual below to see just how easy it is to add Google imagery to your maps in Surfer.)
Real-World Examples: How You Can Put Google Maps in Surfer to Work
It’s clear: accessing Google Maps in Surfer can improve your workflow and equip you to provide visual context that’s high-quality and updated. But from a practical standpoint, it’s not always easy to determine how to incorporate imagery into the maps and models in your particular industry. To help with that, below are examples showcasing how imagery can add powerful context to visualizations, regardless of the industry—and while the examples highlight Google Maps imagery, in particular, they can apply to any provider that offers high-quality, up-to-date imagery.
Environmental Applications
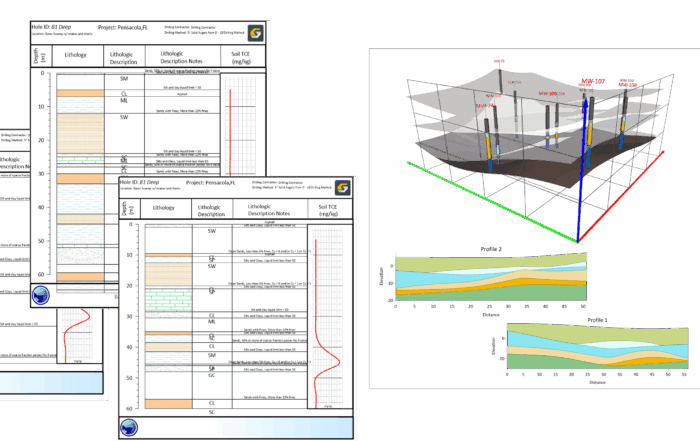
If you’re an environmental professional conducting site assessments or planning remediation strategies, Google Maps imagery can provide essential context. With detailed, current views of land use and nearby features, you can quickly spot potential contamination sources, helping you make more informed decisions and communicate them clearly.
Engineering and Infrastructure Projects
As an engineer, you need to show how your projects—whether they’re new roads, bridges, or urban developments—fit into the existing landscape. With images of roads and infrastructure from Google Maps integrated into Surfer, you can add a familiar backdrop that makes the engineering plans in your visualizations easier to understand. Combine that imagery with a vector layer, which uses slope to determine where water will flow, and you’ll not only show where infrastructure is located but also how surface water will flow and potential flood areas.
Archaeological Surveys
For archaeologists, Google Maps imagery can be a huge help in showcasing sites and understanding a landscape’s historical context. By overlaying Google’s up-to-date visuals onto your excavation data or site maps, you can make historical findings feel more relevant and illustrate connections that might otherwise go unnoticed, making your visualizations more engaging.
Resource Exploration
If you’re in the resource sector, showing how your data connects to real-world locations is crucial. With Google Maps in Surfer, you can overlay imagery to not only spot infrastructure and new development but also the environment surrounding your project area. This can give you and stakeholders the insight you need to plan for efficient, cost-effective resource exploration and extraction.
Bring Your Visualizations to Life with Google Maps
models can make all the difference in communicating your insights effectively. With Google Maps now fully integrated into Surfer’s XYZ Tiles List, you have a seamless, powerful way to do just that—without interrupting your workflow.
From high-quality imagery that’s always current to workflow-friendly integration and built-in attribution, this feature is here to elevate your maps and models and streamline your process. So go ahead: explore the possibilities, test out the new integration, and see how Google Maps can take your visualizations to new heights.