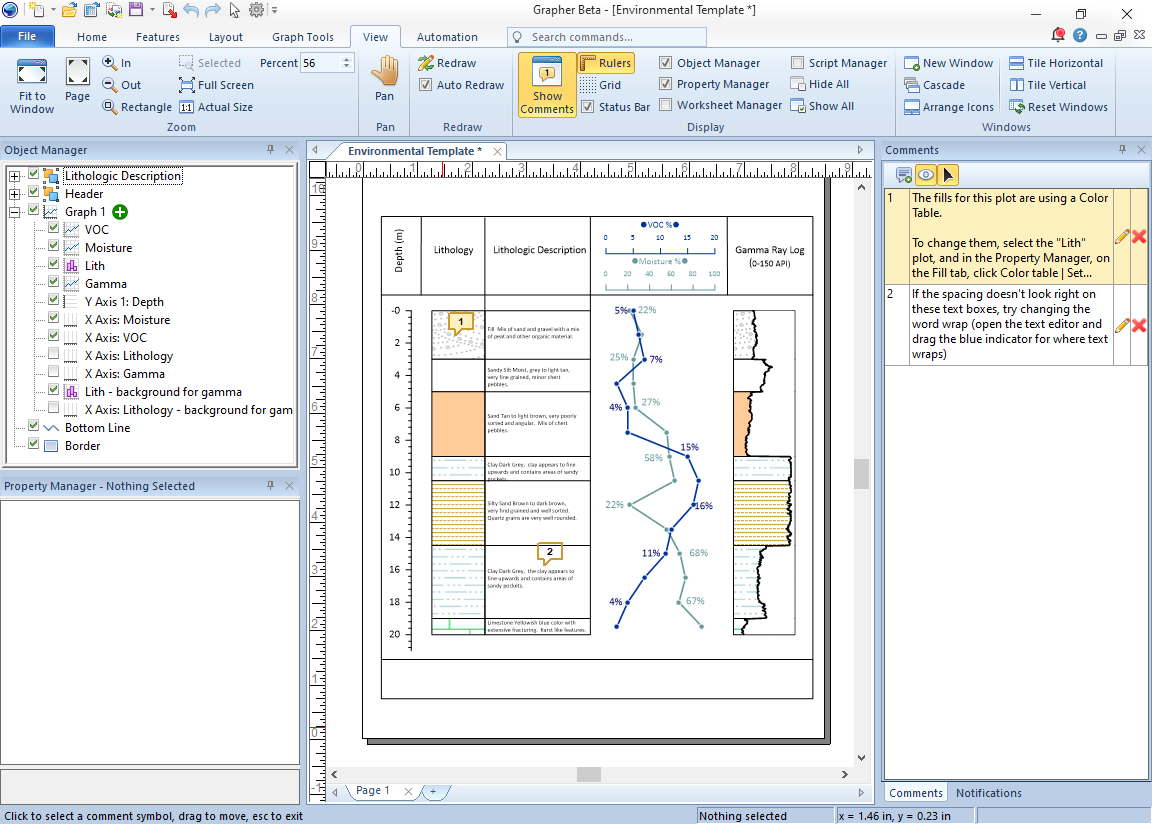
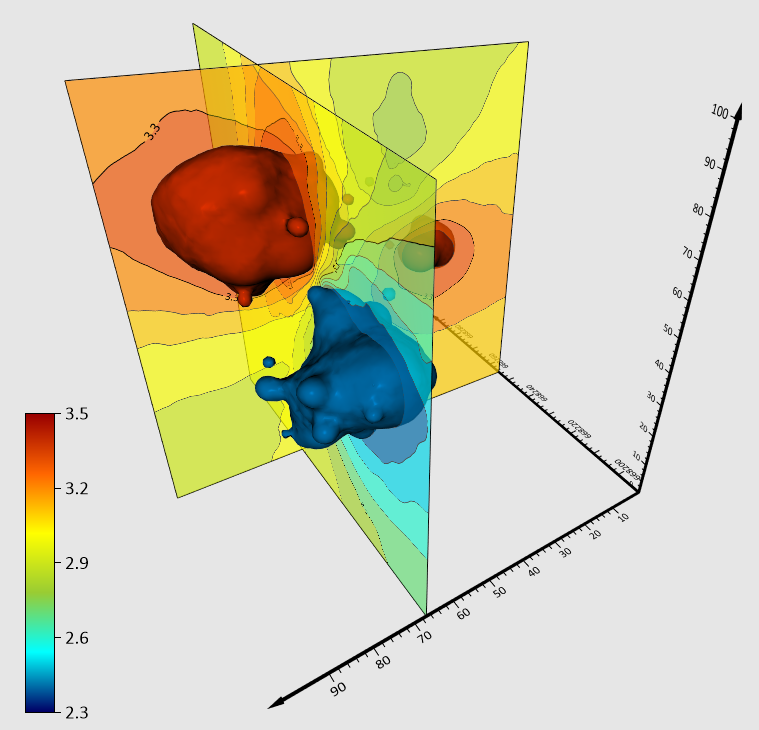
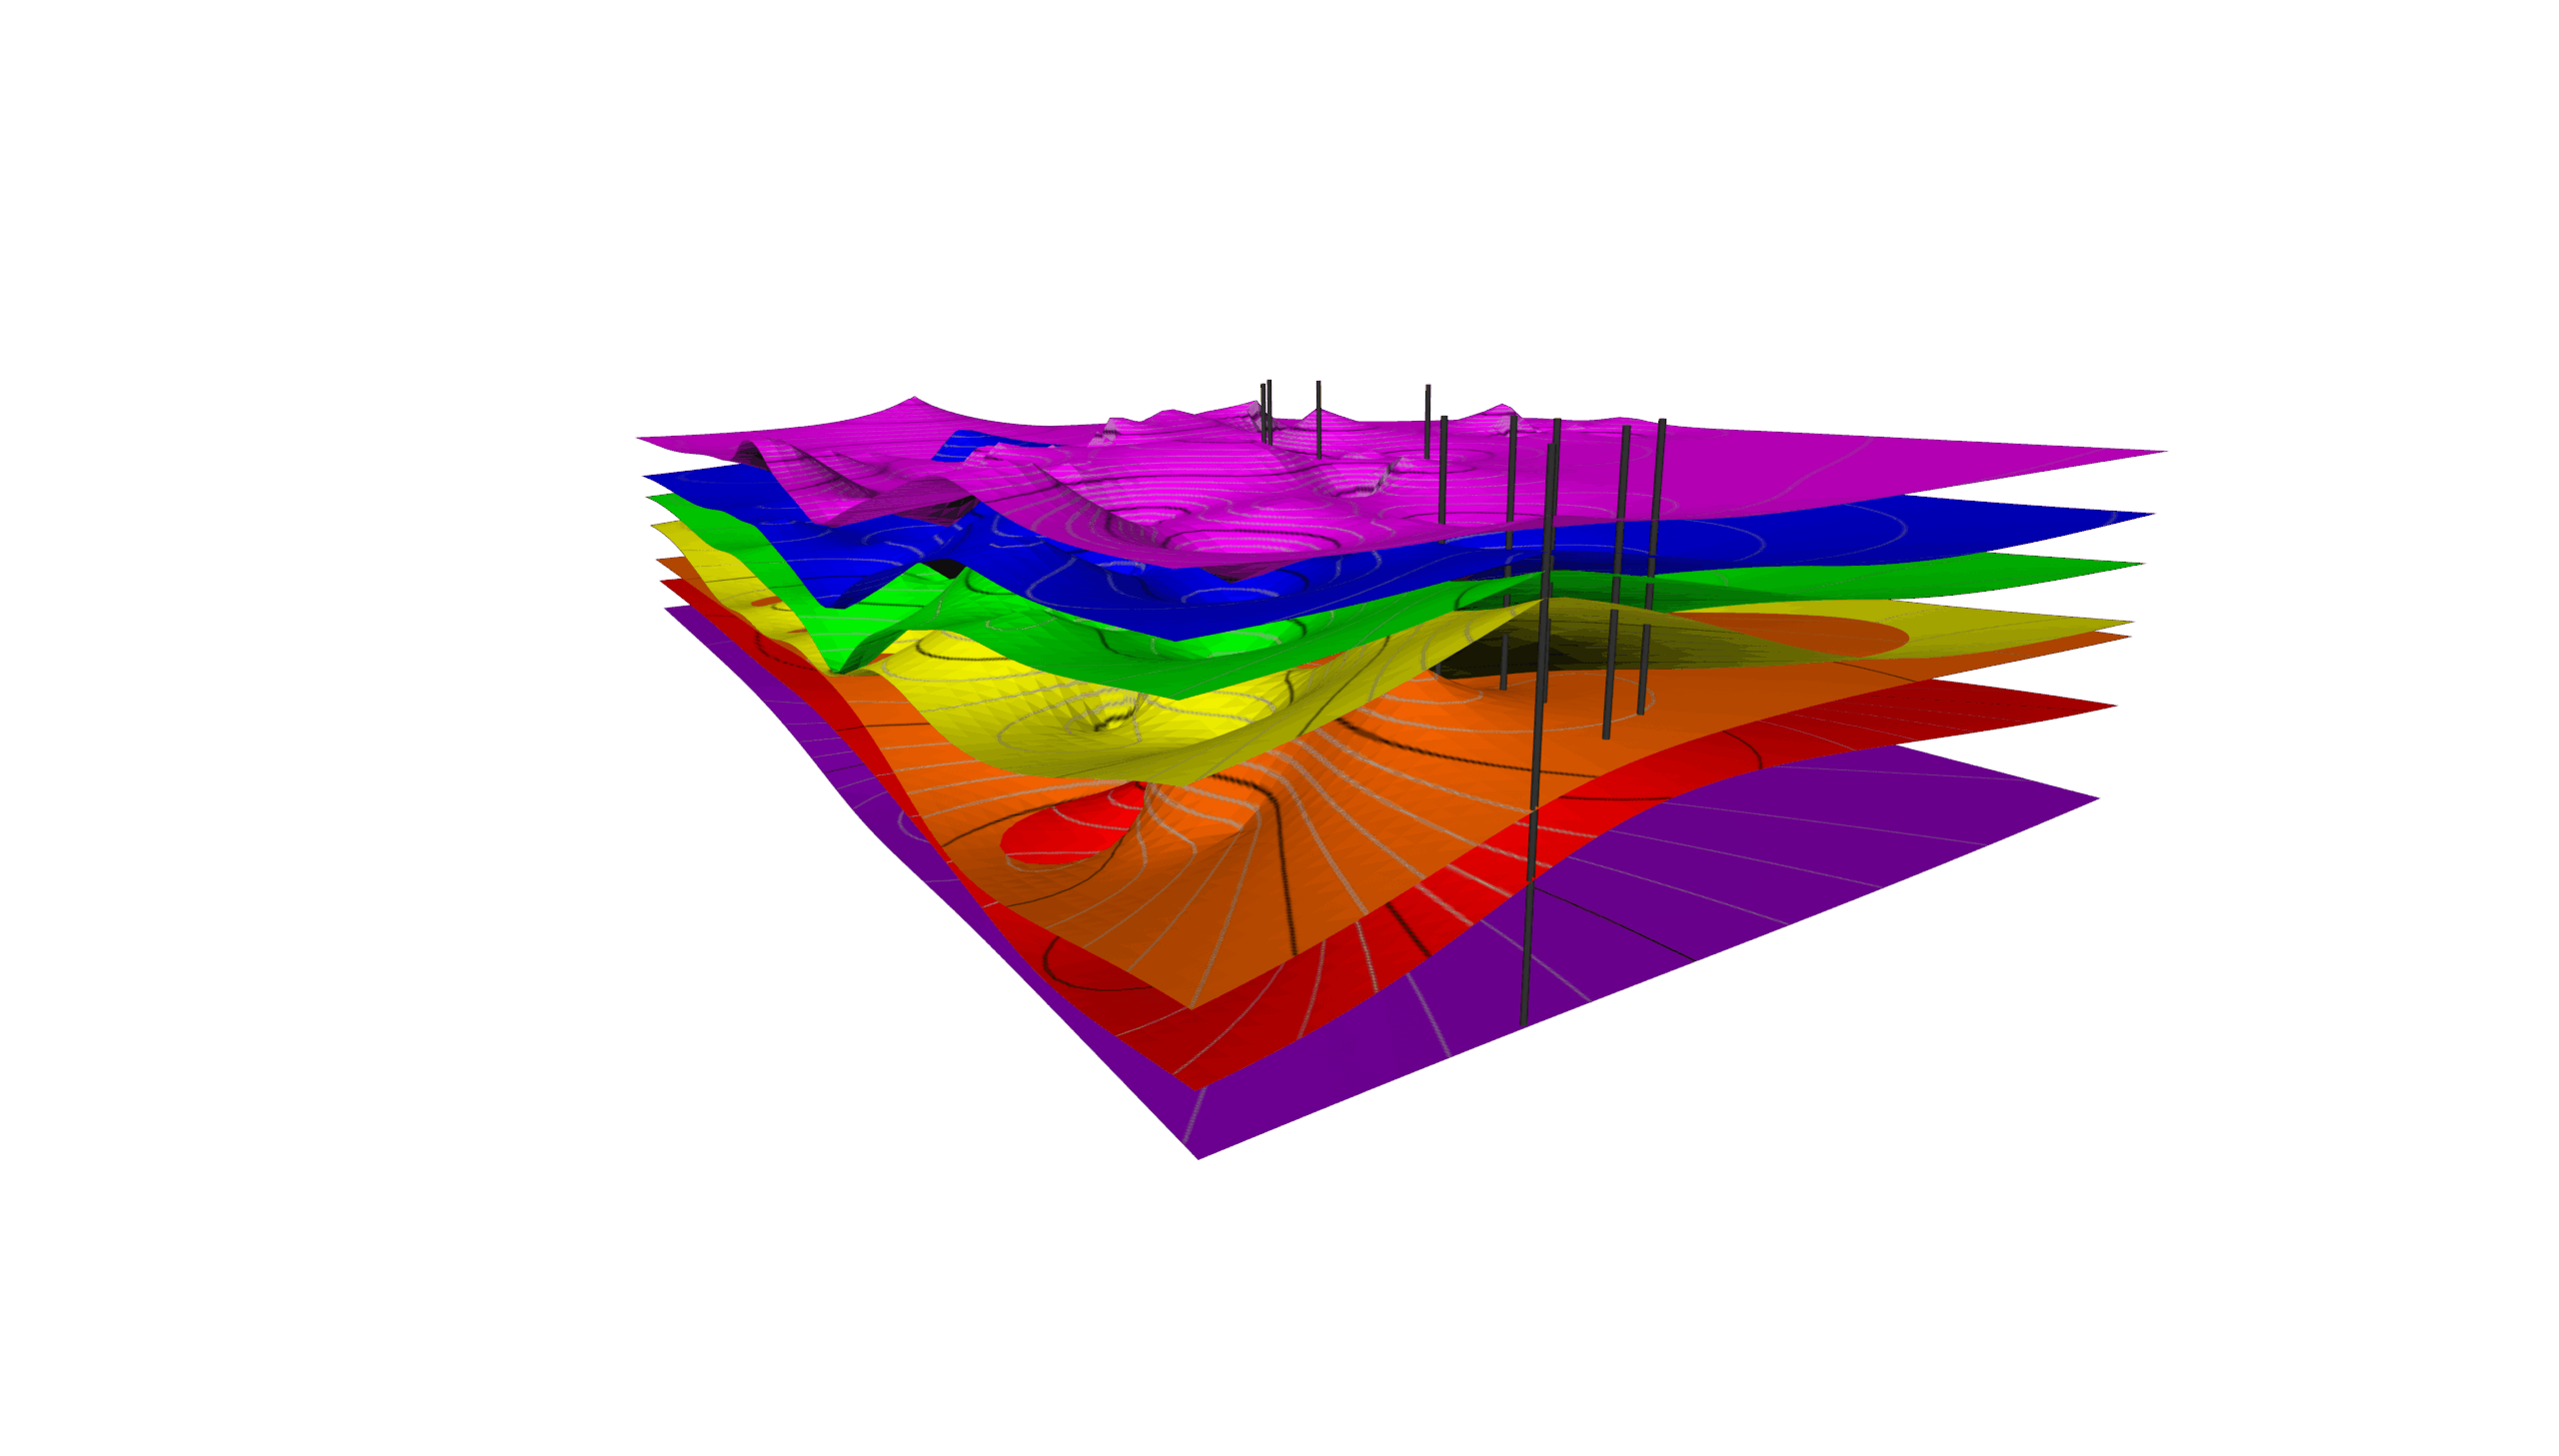
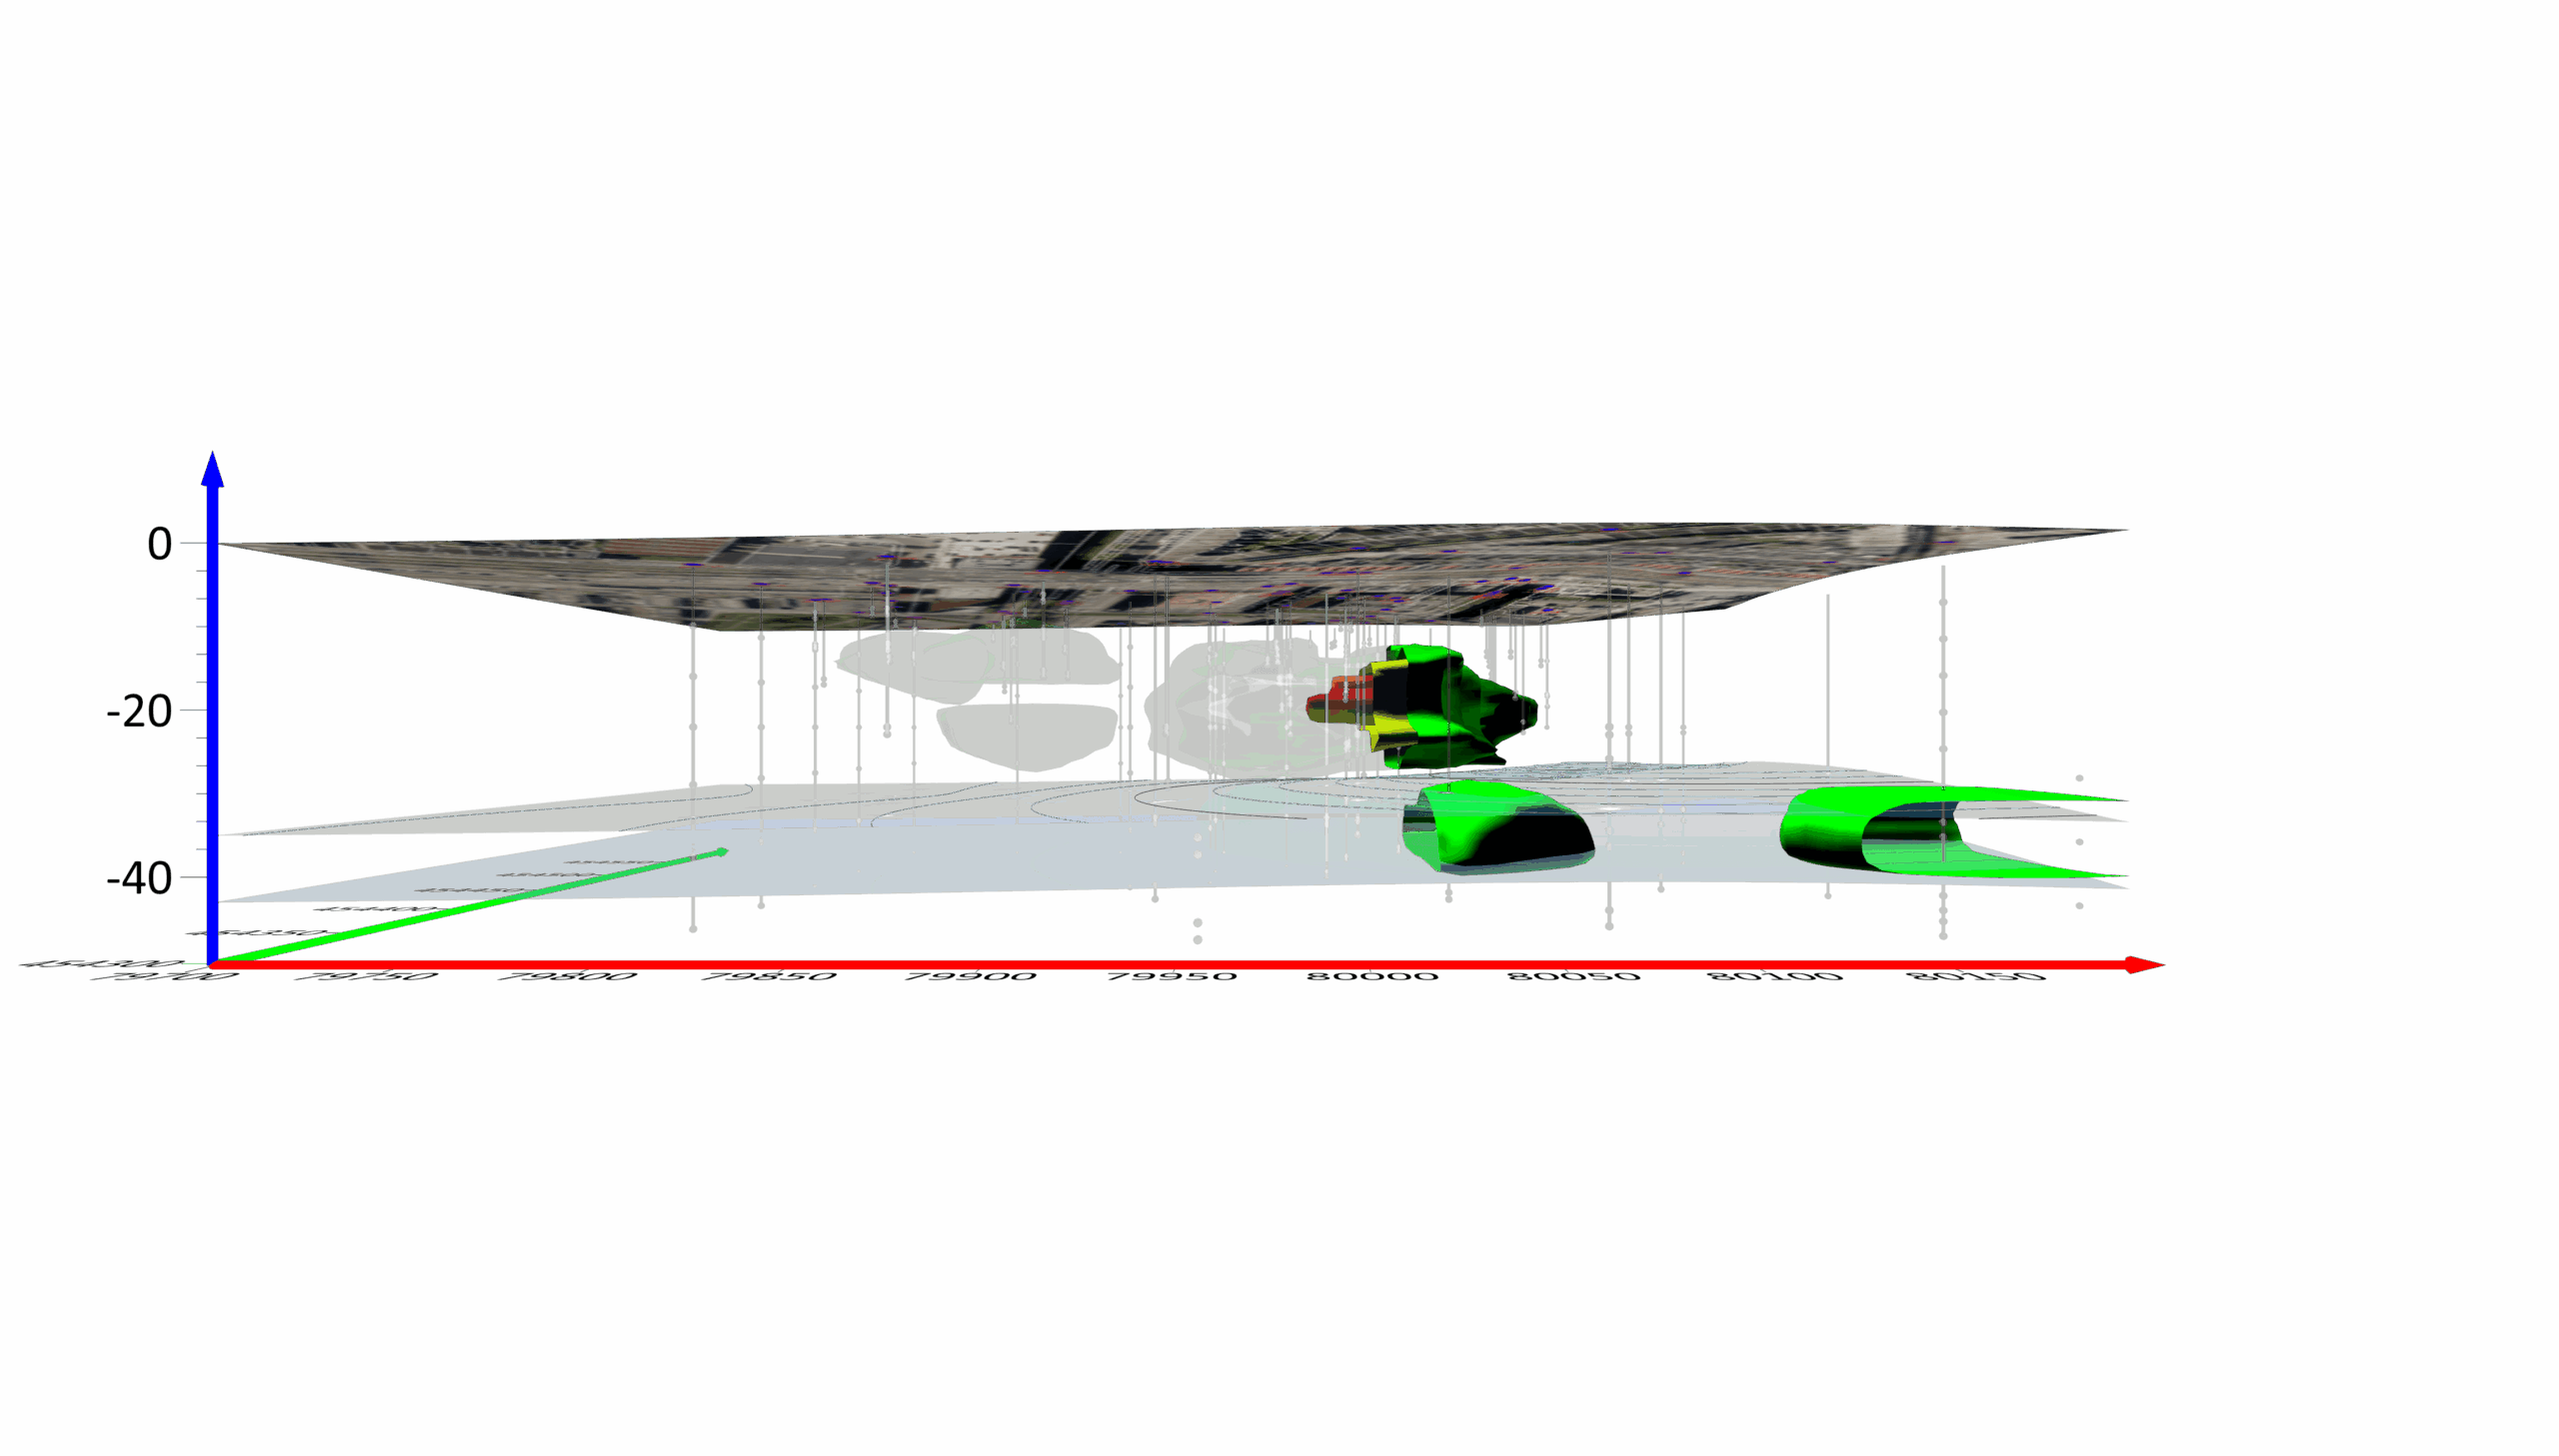
A new version of Surfer was released last week, and it comes with a ton of awesome new features! We focused on increasing processing speed, optimizing workflows to maximize your efficiency, and we included a lot of exciting new features as well, including a new map layer type. Some of the new Surfer highlights are listed below. Stay tuned as we have even more new features coming soon!
Display your data with Pie maps
This is a long-requested feature for Surfer - you can now display your numeric attributed data using Pie charts! Use the Base Symbology tool to choose which attributes from your vector file you're interested in, then represent the proportions of these components with colored pie slices. Size the pies proportionally or use a fixed size, customize colors, labels, position and formatting. This is a great way to display demographics data from the US Census, sample concentrations from your recent field season, or even geographically-varying survey responses.
Drag and drop files to create maps
This is a great new time saving feature that makes map-making more intuitive. Drag one or more files from Windows File Explorer or your Desktop onto your Plot document and maps are instantly created. Drag grid files onto the Plot window to create Color Relief maps, then use the Convert Layer tools to change them to Contour, 3D Surface, or Watershed maps. Drag vector files onto the Plot to create Base(vector) maps, and drag XYZ data onto the Plot to create Post maps.
Convert between grid-based map types
This is another great time-saving tool! Grid-based maps can now be converted to other grid-based maps by using the Convert Layer tool. If you make a mistake and create the wrong map layer type, you don't need to reload the file again, just convert the layer directly to the type that you need.
Export to 3D PDF format
Export your models from the 3D View into the interactive 3D PDF format. Add surfaces, axes, points, and contours, rotate around your model, change lighting and model display style, and more! This new functionality is great for communicating your work to stakeholders. These files can be viewed in Adobe Reader DC and other PDF applications that support 3D data display.
Other new features now available:
Active maintenance users receive these new features for free. Simply download and install the latest version and you're good to go. If your maintenance has expired, renew your maintenance to gain access to these new Surfer features today. Instructions for renewing maintenance can be found here: Renew software maintenance
For anyone else wishing to experience the new release, download the two-week Surfer trial today.
By accepting you will be accessing a service provided by a third-party external to https://www.goldensoftware.com/
Our Customers
logo-USGS.png
logo-TetraTech.png
http://www.goldensoftware.com/images/logos/logo-TetraTech.png
logo-HazelSawyer.png
https://www.goldensoftware.com/images/logos/logo-HazelSawyer.png
logo-Laguna_Geosciences.png
http://www.goldensoftware.com/images/logos/logo-Laguna_Geosciences.png
logo-Arcadis.png
logo-RockSolidGroup.png
http://www.goldensoftware.com/images/logos/logo-RockSolidGroup.png
logo-StanleyConsultants.png
https://www.goldensoftware.com/images/logos/logo-StanleyConsultants.png
logo-Arm_Geophysics.png
http://www.goldensoftware.com/images/logos/logo-Arm_Geophysics.png