Using Statistical Process Control Charts for Quality Control

2024-09-04T13:30:07-06:00September 4, 2024|

Using Statistical Process Control Charts for Quality Control Data-driven individuals and businesses are continuously seeking tools that can provide insights, drive improvements, and maintain consistency. Statistical Process Control (SPC) charts are more than just graphs—they’re a powerful asset for meeting high-quality standards. Widely used across various [...]

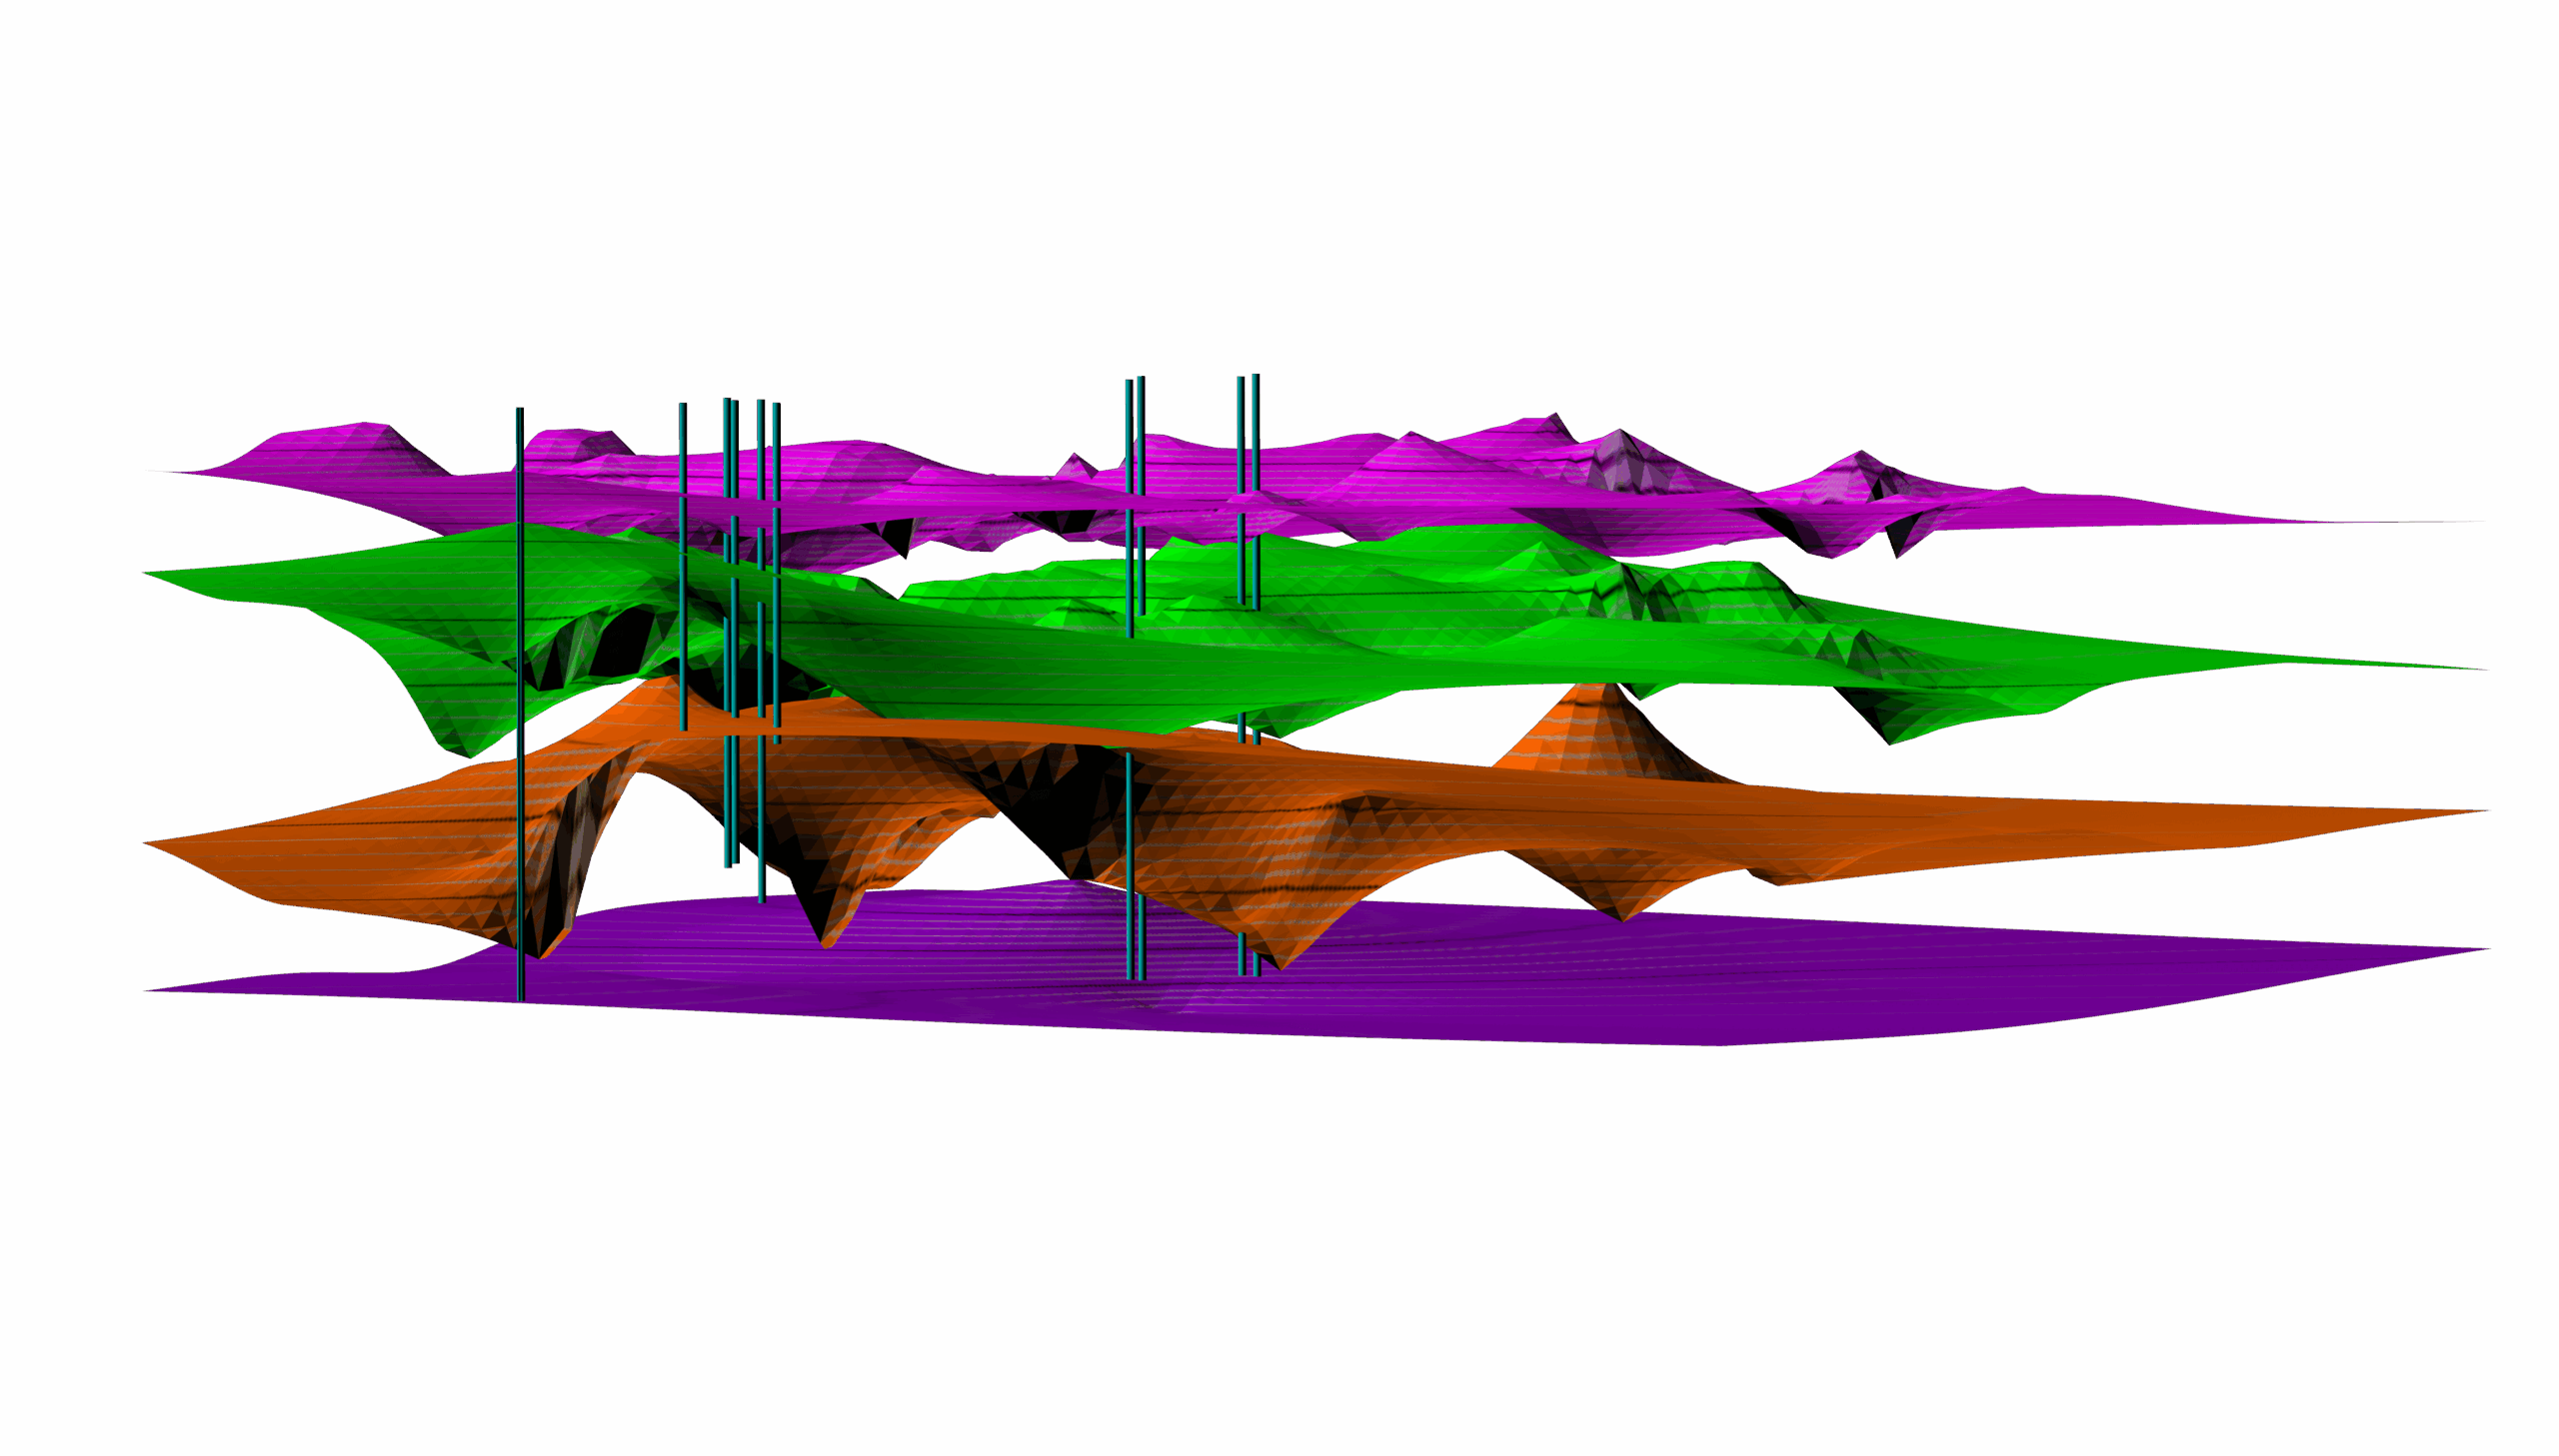
Best Practices for Gridding Geophysical Section Data

2024-08-29T13:39:12-06:00August 29, 2024|

Best Practices for Gridding Geophysical Survey Sections Gridding algorithms have evolved significantly since the early days of geomodelling, yet selecting the appropriate algorithm and parameters for your specific data remains challenging. In recent posts, we've examined best practices for gridding concentration data and vertical well [...]

Adventure into Luray Caverns

2024-11-05T08:35:57-07:00August 21, 2024|

Adventure into Luray Caverns Ruth and her family were looking for a nearby vacation destination where they could relax, bring their dog, and enjoy the great outdoors when they selected the Blue Ridge mountains. Luray Caverns, situated halfway between her sister’s home in Virginia and Ruth’s [...]

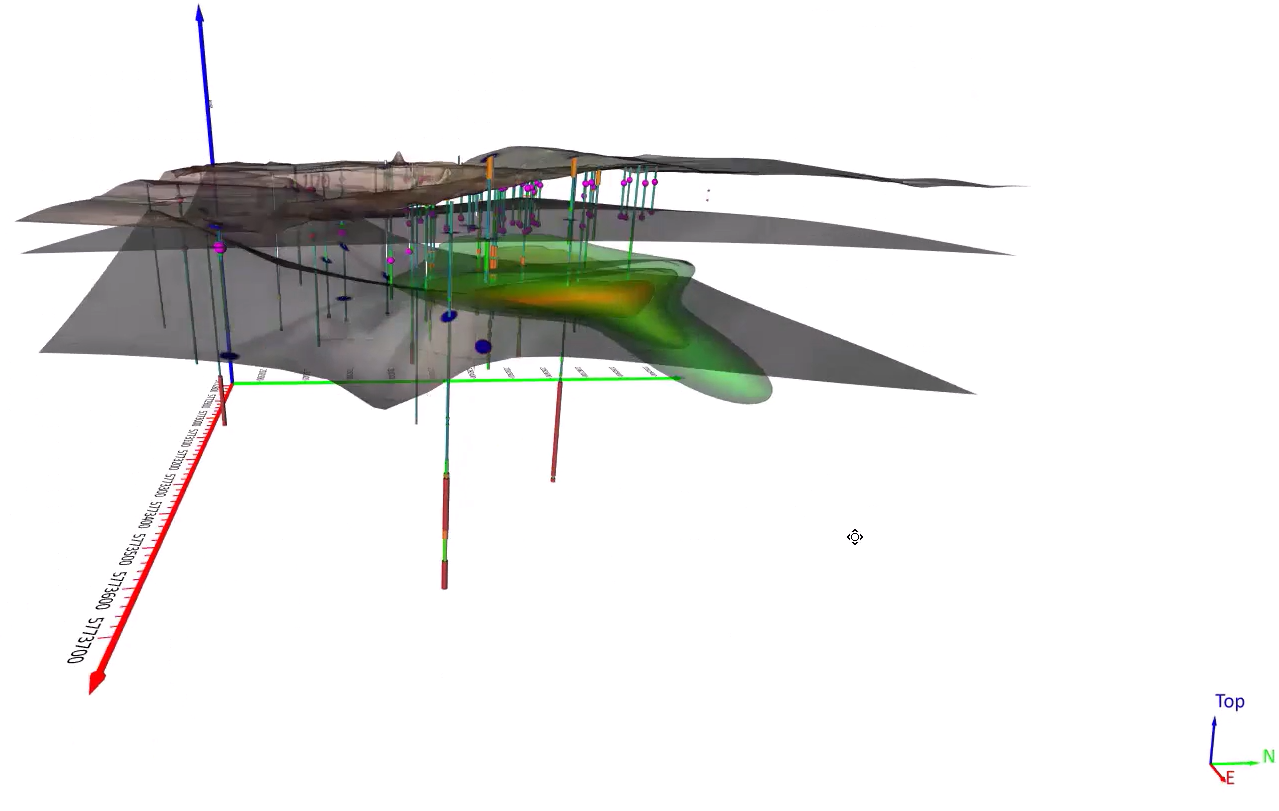
Best Practices for Gridding Drillhole Data

2024-11-05T08:33:10-07:00August 14, 2024|

Best Practices for Gridding Drillhole Data Gridding algorithms have evolved significantly since their inception and have become powerful tools in the geomodelling toolbelt.  However, determining the optimal interpolation parameters for your data can be challenging. In the first blog of this series, we examined best [...]

Effortlessly Create Professional Reports with Frame Templates

2024-11-04T12:47:54-07:00August 1, 2024|

Effortlessly Create Professional Reports with Frame Templates Which parts of your work do you love the most? Do you love spending time in the field? Mentoring young scientists? Processing and analyzing data? Creating engaging visuals? Presenting your results? Creating finished reports that align with stakeholder, client, and [...]

5 Best Practices for Gridding Concentration Data

2024-08-29T08:10:12-06:00July 25, 2024|

5 Best Practices for Gridding Concentration Data The process of converting randomly spaced data into a uniformly spaced grid or surface has evolved drastically from the early days of map making. One of the biggest changes has been the ability to use computer based data interpolation [...]

Exploring Monument Valley’s Unique Geology

2024-07-17T15:59:26-06:00July 17, 2024|

Exploring the Unique Geology of Monument Valley Nestled in the heart of the American Southwest, Monument Valley stands as a testament to the raw, awe-inspiring beauty of nature. This unique landscape has captivated travelers, photographers, and filmmakers for decades. On a recent trip from Utah to Arizona, [...]

Illustrating Accessibility to Red Rocks Amphitheater

2024-06-20T15:34:47-06:00June 20, 2024|

Create Elevation Profiles with Surfer Today Illustrating Red Rocks Amphitheater Accessibility Colorado summer is in full swing! Both locals and visitors to Colorado enjoy taking full advantage of the sunny days hiking, biking, fishing, tubing, paddleboarding, and participating in countless other outdoor activities. Many also [...]

Boost Your Data’s Impact with Superior Color Mapping Techniques

2024-06-13T13:09:11-06:00June 13, 2024|

Boost Your Data's Impact with Superior Color Mapping Techniques Imagine transforming a sea of numbers and charts into a captivating visual story that grabs your audience's attention and keeps them engaged. That's the power of effective color mapping in data visualization. The right colors don't just make [...]

Go to Top