Webinar Recap: From Borehole Logs to 3D Models With Grapher and Surfer
When you’re working with borehole data, you need to create visuals that clearly explain what’s happening beneath the surface. Without that clarity, even strong technical work can be misunderstood or undervalued by stakeholders.
That’s exactly why our Surfer Pro Drew Dudley led a webinar focused on building a smarter subsurface workflow using Grapher and Surfer. Designed for environmental professionals, hydrogeologists, engineers, geologists, geophysicists, and remediation specialists, this session demonstrated how to transform raw borehole data into polished, publication-ready 2D borehole logs in Grapher and elevate those visuals into interactive 3D models in Surfer.
If you didn’t have a chance to join the session live, it’s not a problem. Below, we’ll walk through the two-part workflow Drew showcased: first, how to build clear and customizable borehole logs in Grapher, and second, how to bring that data into Surfer to create dynamic 3D subsurface models that stakeholders can truly understand.
Part 1: Building Borehole Logs in Grapher
During the first part of the workflow, Drew took a few major steps in Grapher to transform raw borehole data into clean, professional logs. To get a look into those steps, let’s dive into the process he shared in the webinar.
Positioning Grapher for Borehole Logs
Drew began by clarifying an important point: while you can create borehole logs in Grapher, the software isn’t a full geophysics or borehole modeling package. Instead, it serves as a practical alternative when you need to create quick, clear borehole logs without switching tools or investing in a more specialized platform. Previously, the main alternative was manually drawing logs in AutoCAD or Illustrator, an approach that was time-consuming and difficult to update when data changed. Grapher offers a faster, more data-driven path.
Using the Template Gallery
To jumpstart the visualization process, Drew downloaded the Environmental Template from Grapher’s Template Gallery. This provided a quick and easy starting point for log creation. As with all templates available for Grapher, the Environmental Template included placeholder objects such as:
- Linked text objects
- Fill patterns
- Pre-designed layout elements
These placeholders would connect directly to Drew’s data, reducing the need for manual formatting.
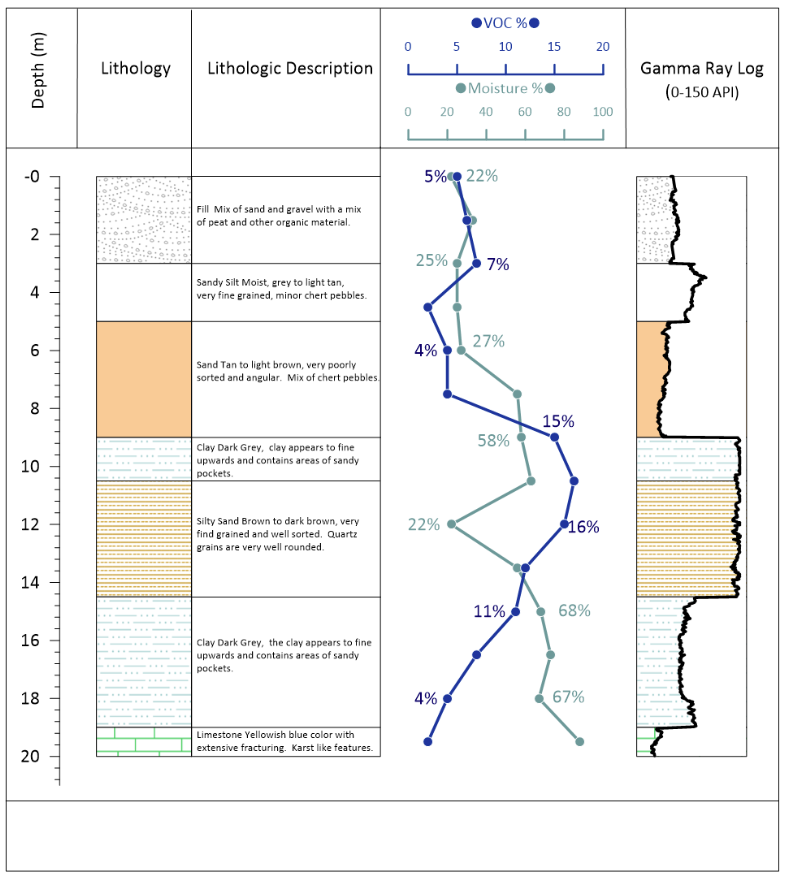
Populating the Template with Data
From there, Drew populated the Environmental Template with borehole log data in just a few clicks and then reviewed the data inside Grapher’s Worksheet Manager. After populating the template with data, Drew leveraged the Data Filter tool to switch between wells using the Well ID field, equipping him to generate logs for multiple boreholes efficiently. He then adjusted fill patterns as needed and exported the logs to TIFF format, moving from raw spreadsheet data to stakeholder-ready 2D borehole logs in a quick and structured way.
Creating Well Construction Logs with Scripter
Drew then introduced Scripter, an automation tool that can speed up workflows in Grapher even more. With this tool, he executed a script to generate well construction logs for three wells in a single run—that way, he wouldn’t need to create them manually. From there, Drew exported selected well construction logs to TIF format for use in Surfer’s 3D View.
Part 2: Building 2D Maps and 3D Subsurface Models in Surfer
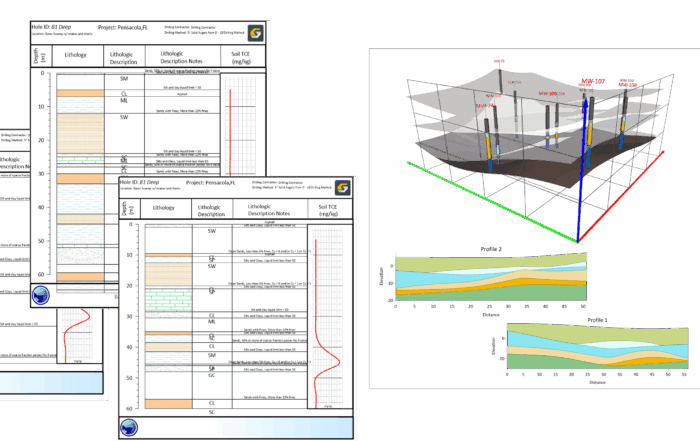
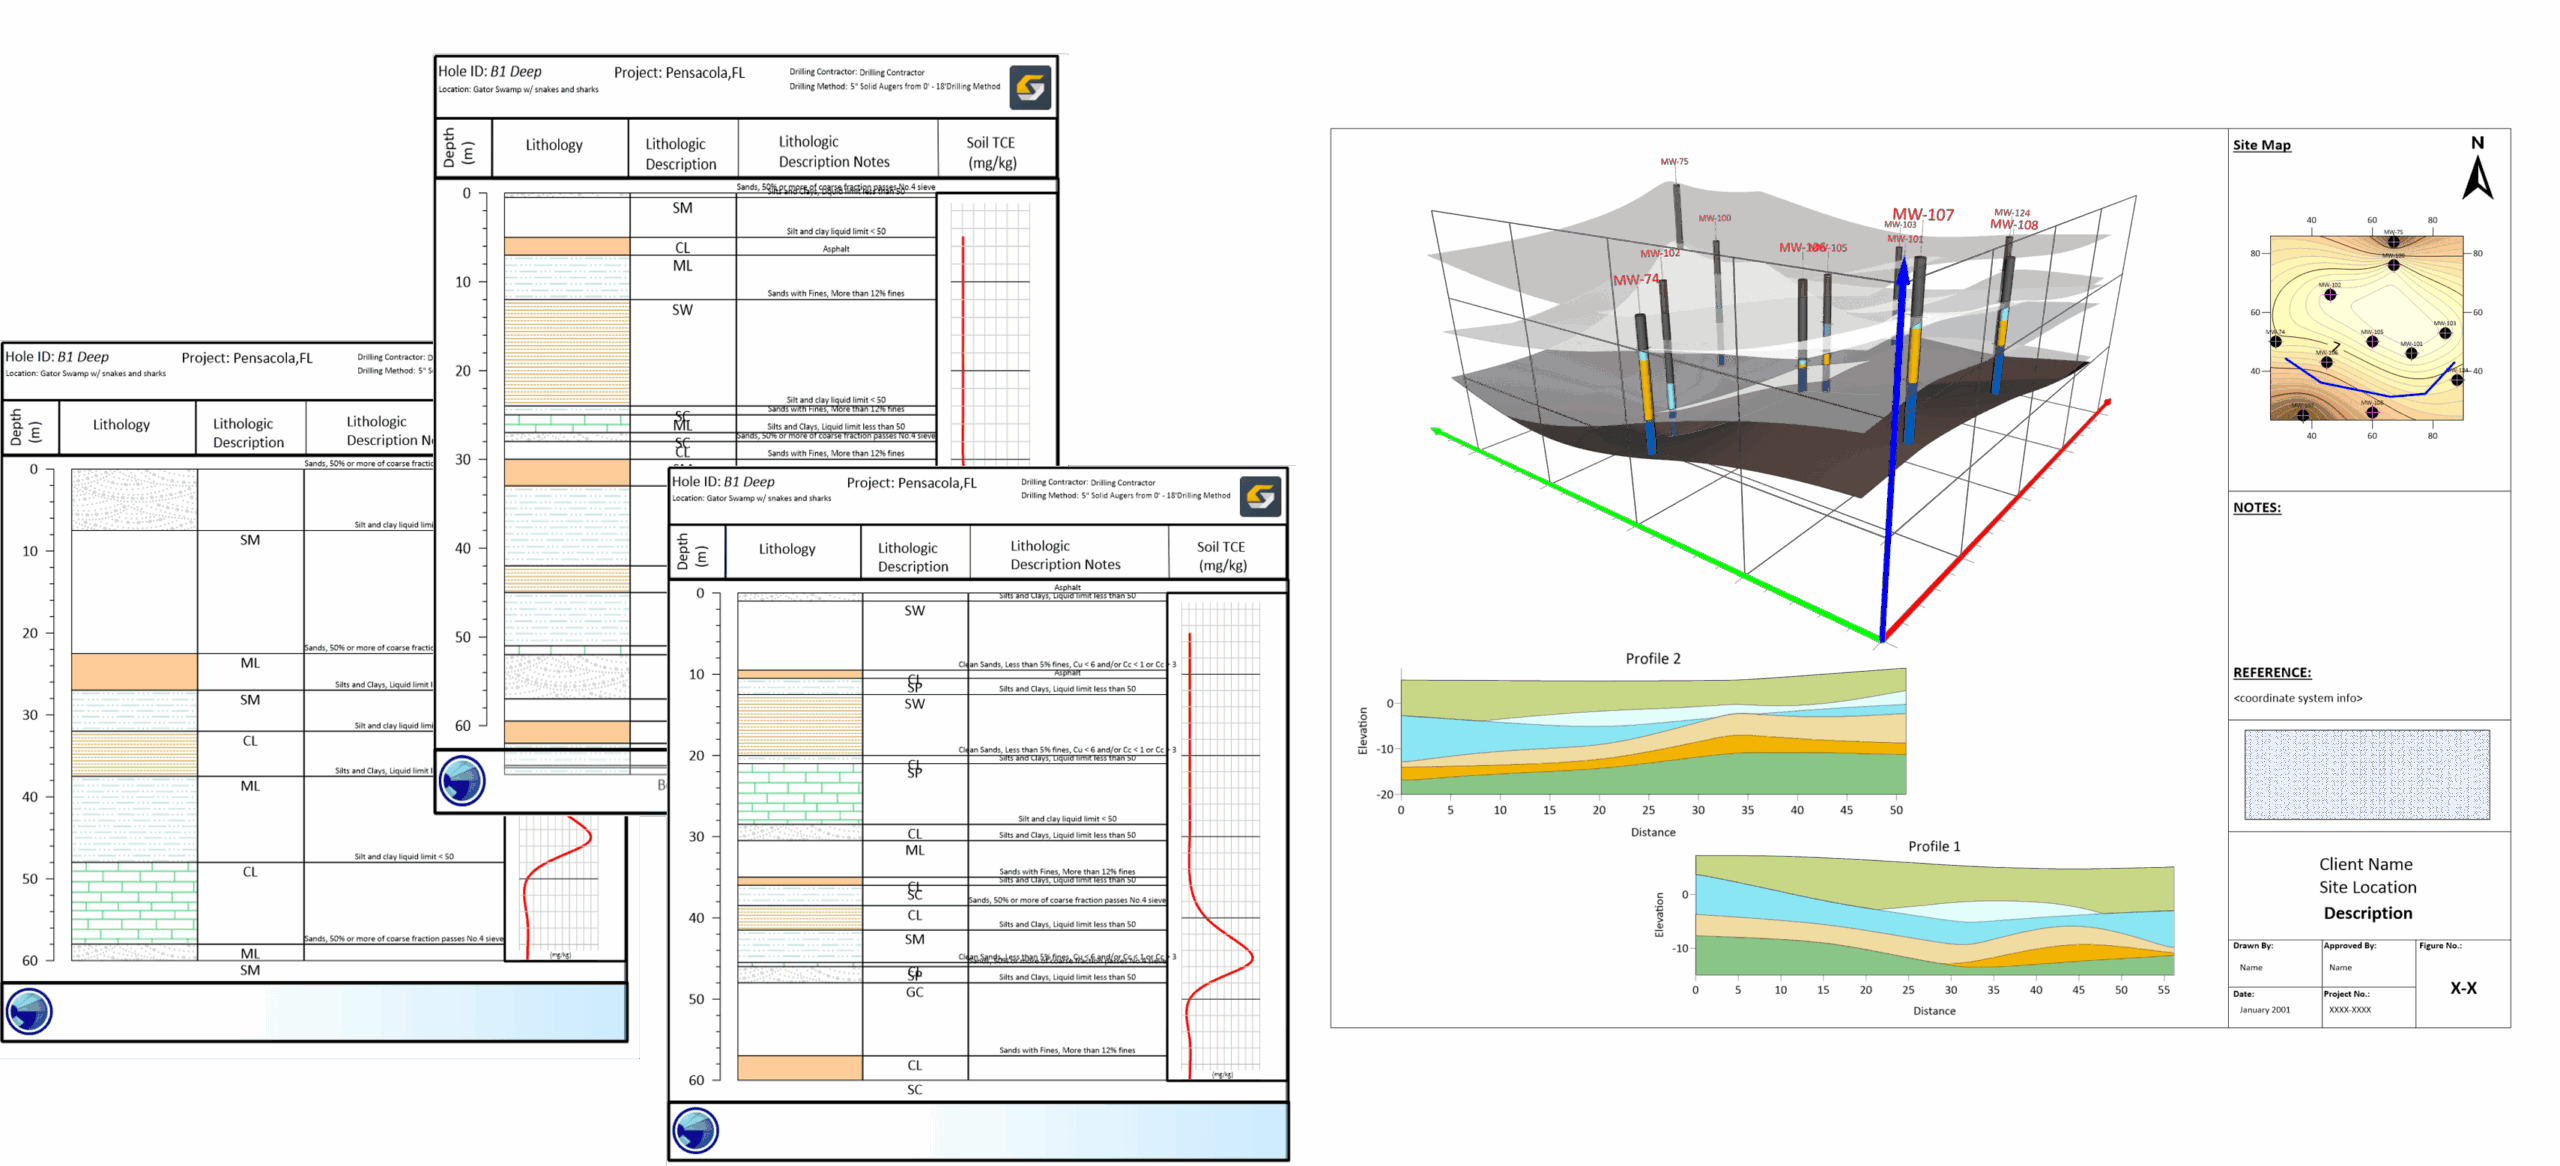
The rest of Drew’s work happened in Surfer. After building clean borehole logs in Grapher, his next steps focused on transforming those logs and associated data into mapped surfaces and interactive 3D subsurface models. Here are the main steps Drew walked through in the rest of the webinar.
Creating a Drillhole Layer and 2D Map
Drew began by creating a Drillhole layer inside Surfer. From there, he launched the 3D View and started building out the subsurface framework. Within his workflow, he did the following:
- Created Drillhole Contacts to define boundaries between lithologic units
- Generated Drillhole Surfaces to represent those contacts spatially
- Modified layer properties to refine the visualization
- Created a topographic surface for surface context
- Exported the generated surfaces
After exporting, Drew returned to the 2D view and added those surfaces into the map. He rearranged the drawing order to ensure the visual hierarchy made sense and created transects to generate profile views using Surfer’s Profile tool.
To keep the project organized, Drew also renamed layers and moved them strategically within the plot document before exporting the final 2D map output. At this stage, the workflow had progressed from raw borehole data to structured 2D maps that clearly communicated subsurface relationships.
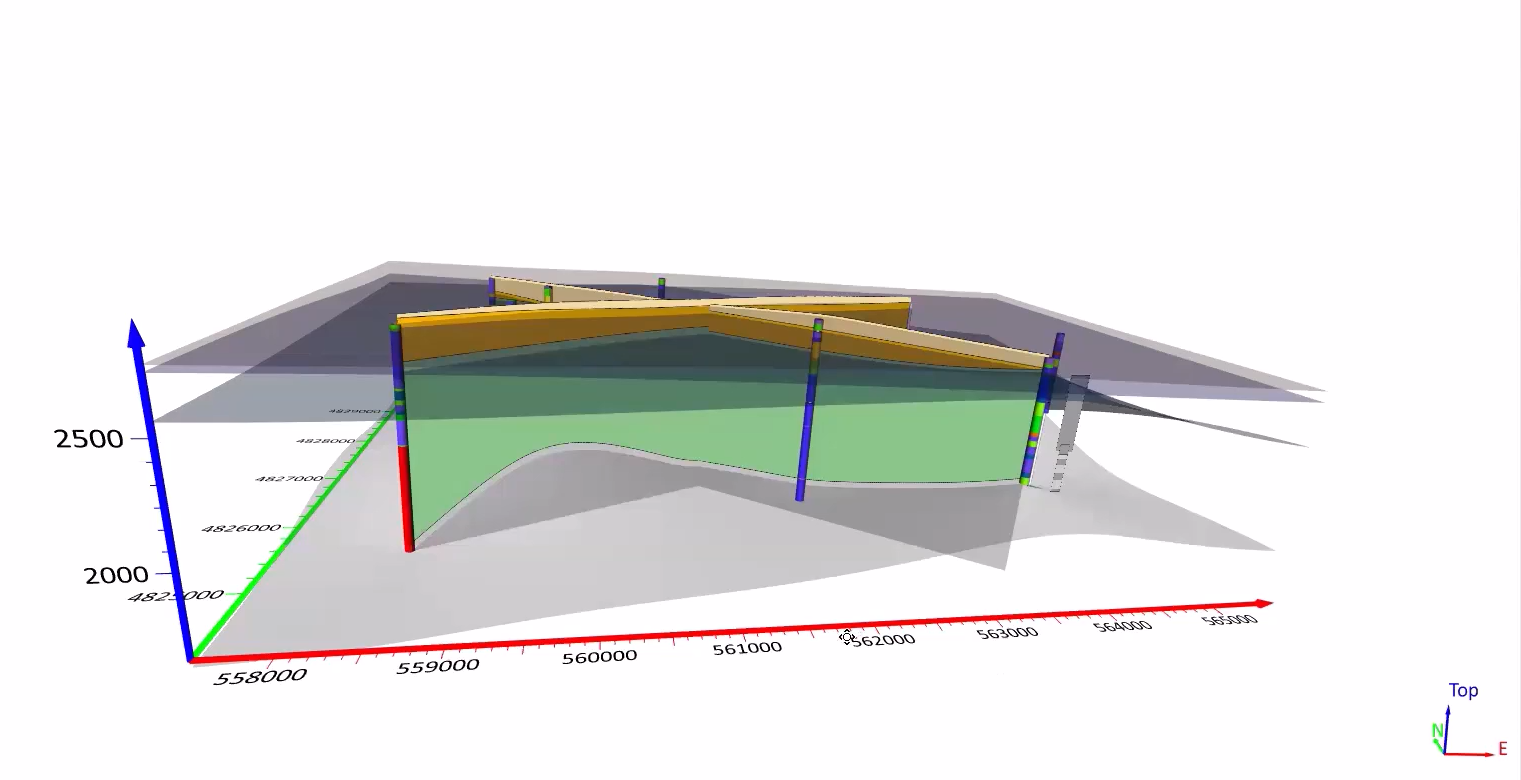
Visualizing Data in 3D
From there, Drew moved back into 3D View to create a fully interactive subsurface model. During this phase, he took several steps, including the ones below:
- Imported the generated surfaces into 3D View
- Imported the borehole log images created earlier in Grapher
- Added empty base layers for additional structure
- Renamed layers for clarity
- Imported images using file paths
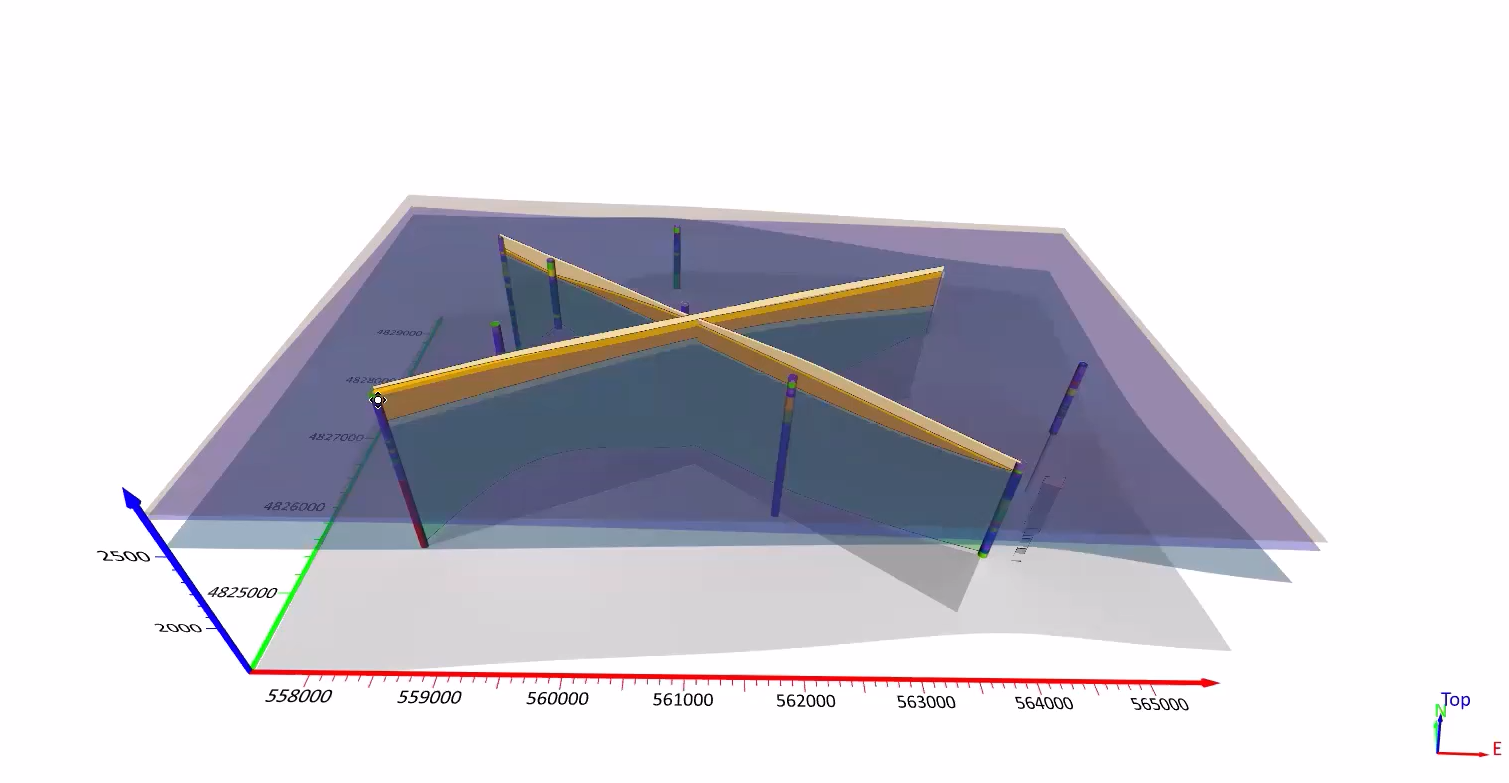
- Rotated and positioned the logs in 3D space
Seeing the borehole logs aligned with the interpolated surfaces added spatial context that’s difficult to achieve in 2D alone. Stakeholders could now understand how lithology and structure relate across space—not just within a single borehole.
Exporting for Stakeholders
The final step focused on deliverables. Drew demonstrated how to export drillhole maps into an interactive 3D PDF. This format is particularly impactful. It empowers clients and regulators to rotate, zoom, and explore the model independently without requiring specialized software. That means you can deliver an interactive subsurface visualization in a universally accessible format.
A Smarter Subsurface Workflow
What this webinar ultimately demonstrated is simple: a smarter subsurface workflow isn’t about using more tools. It’s about connecting the right tools intentionally. Grapher handled the structured, publication-ready borehole logs. Surfer transformed those logs into mapped surfaces and interactive 3D models. Together, they created a seamless path from raw borehole data to stakeholder-ready visuals.
That integration is where the real efficiency and clarity lives.
If you’re looking to strengthen your own subsurface workflow, you can adopt the same process Drew shared. Just start by exploring the templates available in Grapher’s Template Gallery. Then, experiment with Scripter to automate repetitive log creation, and consider how integrating 3D models into your reporting could elevate conversations with clients and regulators. When stakeholders see what’s happening underground, the quality of communication changes.
To see Drew’s full workflow in action, the webinar replay is available! Watch it to see each step Drew demonstrated and to explore how you can apply the same connected approach to your own projects.