How Drillhole Maps Provide Clearer Insight into the Subsurface
When working with drillhole data, you’ve likely used post maps or base maps to visualize your drillhole locations. After all, post maps let you plot XY coordinates to show where drillholes are located, while base maps from data give you a bit more flexibility in layering information. If you’re only interested in viewing drillhole locations in 2D and all your drillholes are perfectly vertical, these maps are an acceptable way to visualize your data.
But what happens when your drillholes are deviated? What if you need to show drillhole paths as they extend underground? Or what if stakeholders need a more complete understanding of what’s happening below the surface? In those cases, post maps and base maps aren’t the go-to data visualizations. That’s where drillhole maps come in.
The Purpose and Advantages of Drillhole Maps
A drillhole map goes beyond XY plotting, equipping you to visualize not only the starting point of a drillhole but also its path, endpoint, and the geological features it intersects with underground. With both 2D and 3D representations, this type of map lets you deliver clearer insights about your data. You can show everything from interval data to point sample data to survey or deviation data. This level of detail ensures you can deliver a clearer, more compelling, and more accurate representation of the subsurface to stakeholders, making this map type essential for resource exploration, environmental assessments, and geological modeling.
But the level of depth your drillhole map offers depends on whether it’s in 2D or 3D. For insights on how each format visualizes data, let’s discuss the differences between 2D and 3D drillhole maps.
What 2D Drillhole Maps Offer
In a 2D drillhole map, you can visualize both the starting and ending locations of drillholes. If your drillholes are vertical, the top and bottom locations will align, meaning they will appear as a single point—similar to what you’d see on a post map. However, if your drillholes are deviated, a 2D drillhole map will display both the top and bottom locations as points and use a connecting line to show the deviation path, as specified by azimuth and inclination data.
A drillhole’s true path is best determined by survey data, which includes measured depth, azimuth, and inclination at various points along the hole. When you have this type of data, the precise deviation path of a drillhole is displayed between the top and bottom of the hole. If you use different symbols on your drillhole map based on attributes like well type, drilling method, field name, or driller, you can also enhance your visualization so it’s more informative. Additionally, with 2D drillhole maps, you can create multiple labels for the top of the hole to indicate its name, type, elevation, XY coordinates, and more, making it easier to identify.
All in all, with a 2D drillhole map, you can showcase fundamental insights such as the following:
- Where the drillhole starts
- Where the drillhole ends
- How the drillhole path moves through the subsurface
- The type of well being used
- The name of the hole, driller, project field or other information
While a 2D drillhole map provides valuable insight, it still has limitations—especially when it comes to showcasing all the variations in depth and dips and any other twists along the way. But that’s where 3D drillhole maps take things to the next level.
What 3D Drillhole Maps Offer
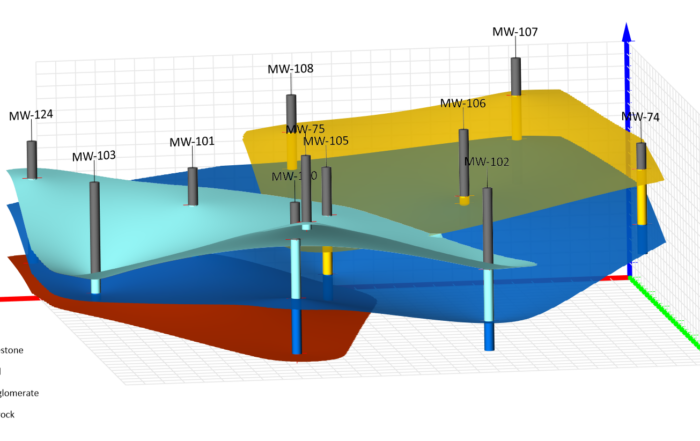
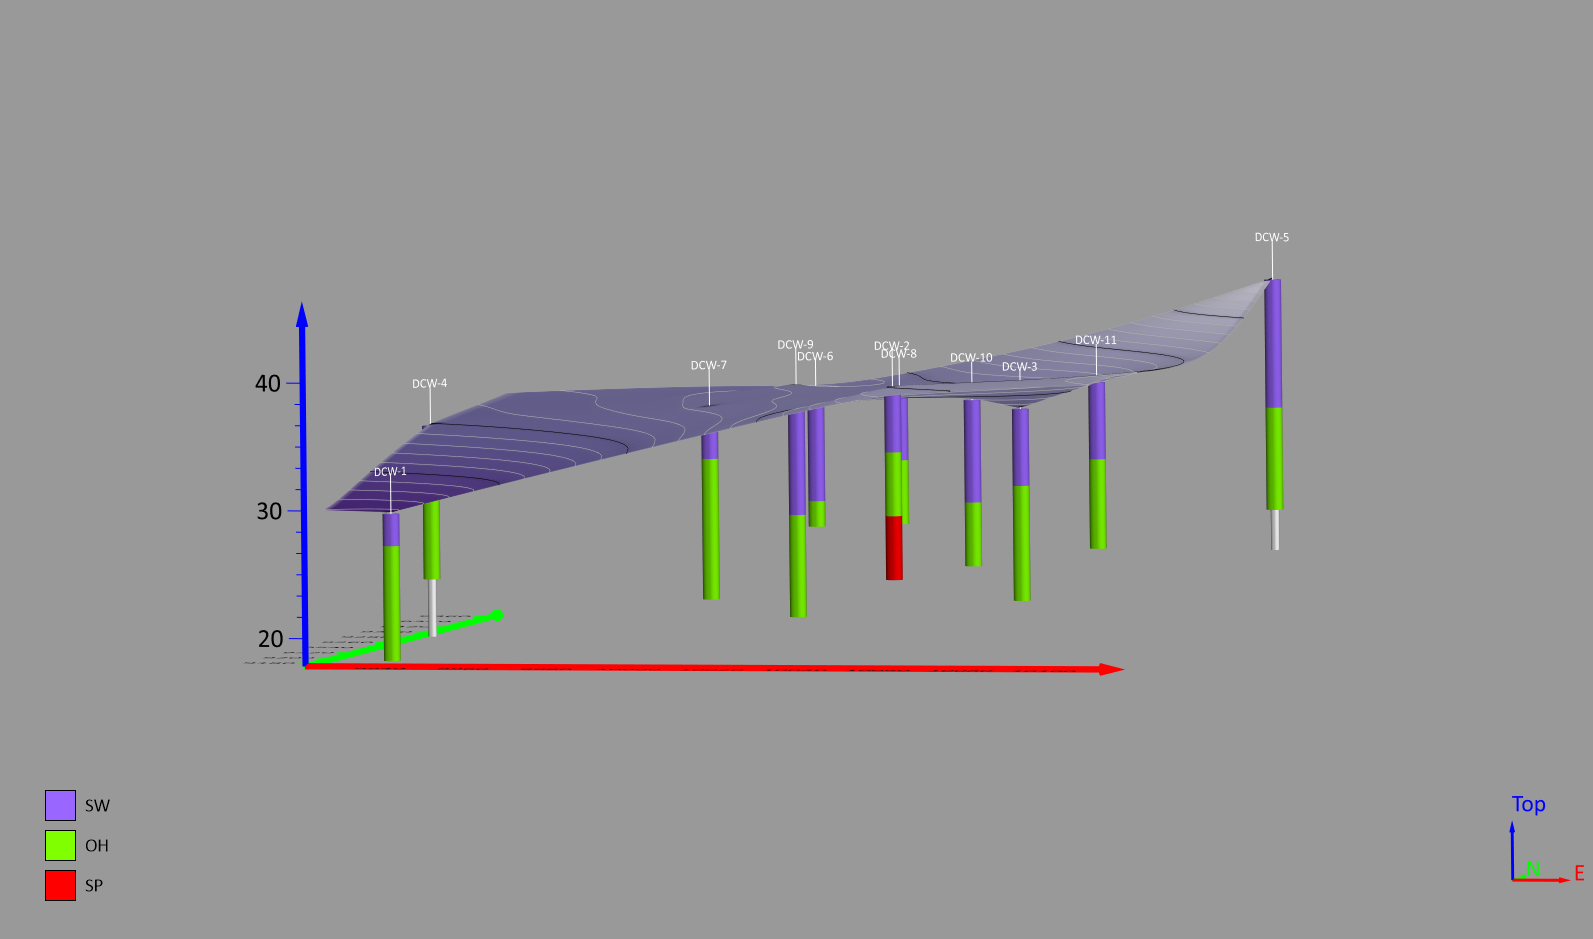
The real advantage of drillhole maps becomes apparent in 3D. In the 2D view, you see a flat representation of the drillhole’s deviation path, but in 3D view, you get the full picture. You can see the entire trajectory of the drillhole in 3D space, along with all the geological, point and interval data collected along the path. This provides a much clearer understanding of the following:
- How deep the drillhole goes
- The exact orientation of the drillhole path
- What formations, mineralization zones, or contamination layers the drillhole passes through
- How multiple drillholes relate to each other in a subsurface model
With 3D drillhole maps, you can correlate drillhole paths with other geological data, making it easier to analyze and showcase spatial relationships in the subsurface. So instead of just seeing a line connecting start and end points, you can visualize whether the drillhole is moving straight down, at an angle, or even curving as it extends underground. Sometimes, this comprehensive detail is just what stakeholders need to understand subsurface conditions and make informed decisions.
Do You Need a 2D or 3D Drillhole Map?
Now that you know what 2D and 3D drillhole maps offer, let’s tackle this question head on: should you use a 2D or 3D drillhole map for your specific project? Quite frankly, the answer depends on the depth of insight you need to showcase. If you need a very simple visualization of deviation paths, a 2D drillhole map is a good choice. On the other hand, if you require a complete, detailed view of the subsurface—showing drillhole paths and changes, interval data, and geological features in 3D space—then a 3D drillhole map is essential.
Here’s a quick breakdown to help you decide:
- Use a 2D drillhole map if you need a simple visual of drillhole locations, optionally including the deviation path, and want to display different symbols based on attributes like drillhole type, field location or drilling method.
- Use a 3D drillhole map if you need to see the full trajectory of drillholes, including depth, changes, and how they interact with geological formations.
Ultimately, choosing between a 2D and 3D drillhole map depends on the level of insight needed for your project. So keep that in mind when determining which format to use.
Where to Create 2D and 3D Drillhole Maps
Even though drillhole maps have a lot to offer, we’ll be honest—not all data visualization software is built to handle drillhole data. Many GIS tools let you create basic post maps or base maps from data in 2D to showcase drillhole locations, but they aren’t designed for drillhole analysis without specialized add-ons. Equally importantly, they don’t provide the capability to visualize drillholes in 3D. However, all these shortcomings make sense. GIS software is designed for spatial mapping, not for geological analysis. If you want a full picture of your drillholes—including their depth, deviation, and associated geological data—you need software specifically designed for that purpose.
Some massive packages exist to try to fulfill that purpose, but they often come with a steep learning curve. They can be incredibly complex to use, sometimes requiring hours to simply import data and learn important features. Additionally, they’re usually very expensive. Licensing fees can reach around $100 an hour, which means you need to be extremely proficient at using the tool to make the investment worthwhile. If your level of proficiency isn’t adequate, you may waste time and money.
Fortunately, that’s not the case with Surfer. It makes the process of creating 2D and 3D drillhole maps straightforward, walking you through each step—from importing your data to creating drillhole layers. Once your data is loaded, all it takes is a few clicks to visualize your drillholes in 3D. There’s no need to wrestle with complex data imports or spend hours learning key features. Instead, Surfer provides an intuitive workflow that lets you focus on what really matters: analyzing and presenting your subsurface data effectively to stakeholders.
Take Your Subsurface Visualizations to the Next Level
Drillhole maps provide you with a powerful way to visualize subsurface data, offering a level of clarity that traditional post maps and base maps simply can’t match. Whether you’re working in 2D to track drillhole deviation paths or diving into a 3D view to analyze geological formations in greater depth, these maps enhance your ability to communicate critical insights to stakeholders.
However, as we’ve discussed, not all software makes it easy to create drillhole maps. That’s why Surfer is a great solution—it provides a seamless, intuitive way to generate both 2D and 3D drillhole maps without the frustration of complex workflows or expensive licensing fees.
Ready to elevate your subsurface visualizations? Download a 14-day free trial of Surfer today and start creating drillhole maps that provide clearer, more insightful data to your stakeholders.