The Latest Features You Can Enjoy in Surfer Beta (September 2025 Edition)
At Golden Software, we’re constantly looking for ways to make your work more efficient, intuitive, and impactful. That’s why we’re always refining our tools, and one of the most powerful ways we do that is with Surfer Beta.
If you’re not already familiar with it, Surfer Beta gives you early access to upcoming features and improvements while also giving you a voice in how those tools evolve. You get to test new functionality in real-world workflows, send us your feedback, and directly shape the future of the software you rely on for complex projects.
There are currently eight brand-new features in Surfer Beta designed to streamline your visualization process, improve cross-software compatibility, and help you communicate results with more clarity and control. Curious to check them out? Here’s what you can try right now in Surfer Beta—and how each feature can help you work smarter.
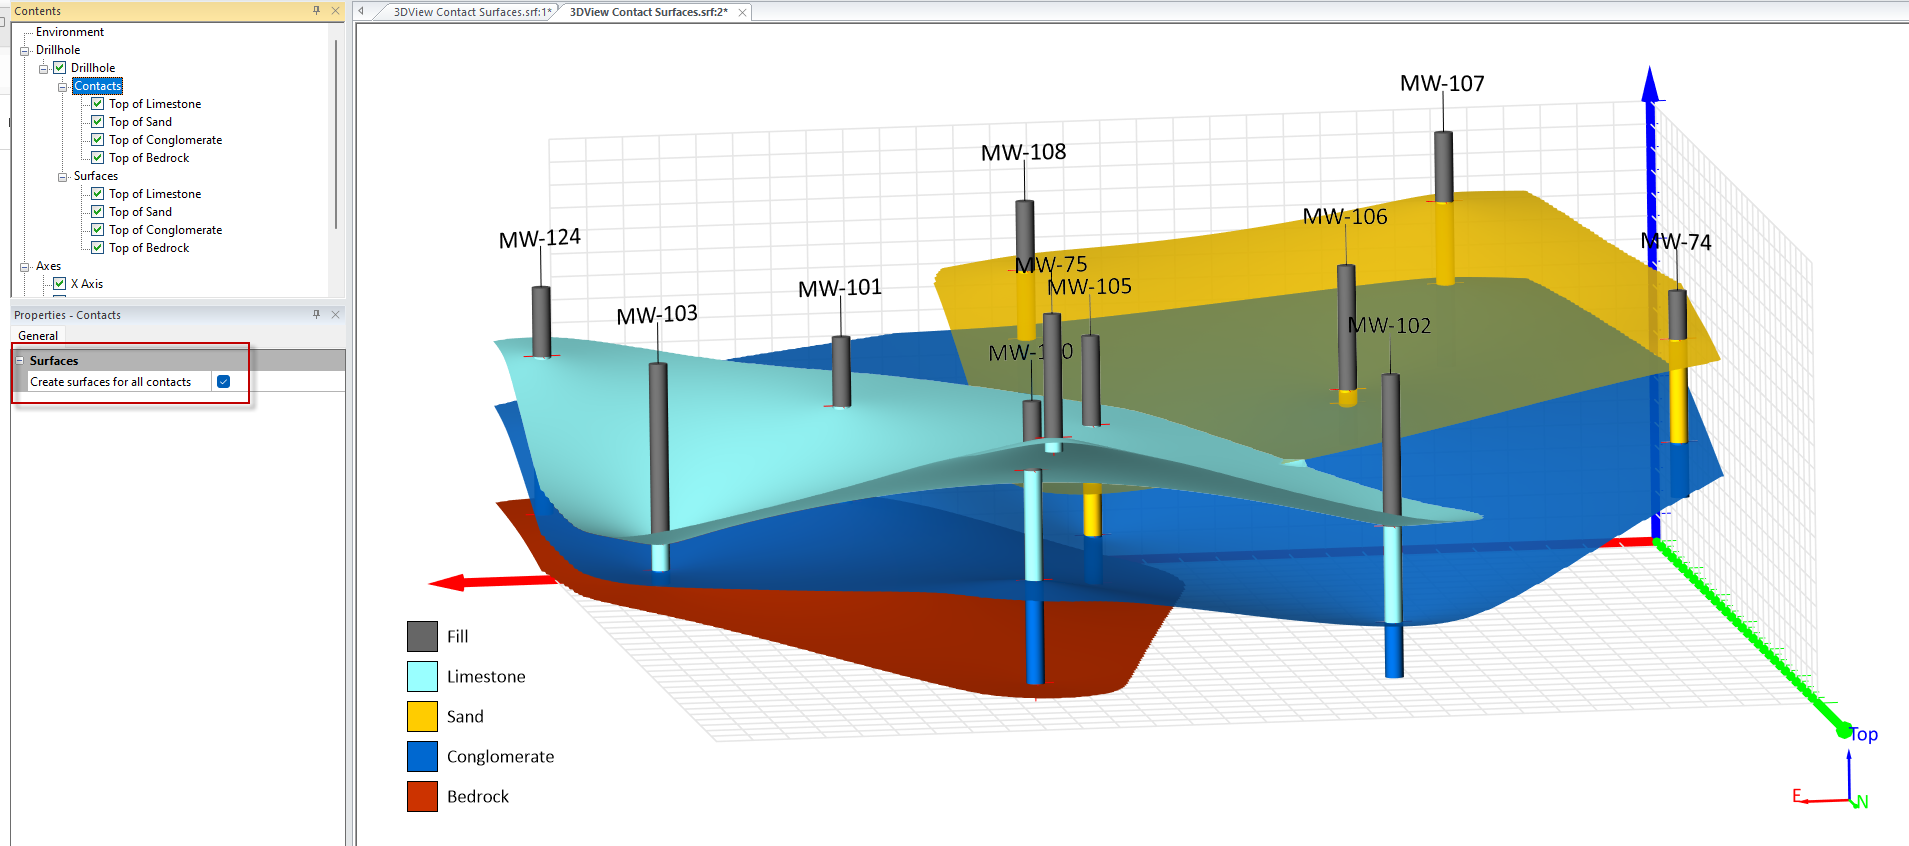
1. 3D View: Create Contact Surfaces
Clarity in 3D visualization just got an upgrade. With this new feature, you can now create contact surfaces from drillhole data in the 3D View. This equips you to showcase how lithologies and other relevant horizons across drillholes stack up with one another, providing critical insight into how geology could influence contamination, mineralization, and other variables.
Why it matters: Creating contact surfaces is critical when you’re trying to visualize geological boundaries, model plume behavior, or clearly show interactions between multiple subsurface features. With this new tool, you can define those interfaces in the same 3D workspace you already use—making it easier to build realistic models and communicate them to stakeholders.
2. Legends: Descriptive Entries for Single Samples
When you add a single point or post map layer to your project—say, a star that marks a sample location—your legend should communicate what it is, not just deliver a numeric value. To ensure that happens, this new feature automatically pulls the layer name into your legend. That means instead of displaying a symbol and a data value like “23.4,” your legend will now show a blue star labeled “Sample Locations”—or whatever your layer name is.
Why it matters: Legends are more than decoration. This improvement helps give your stakeholders and other viewers context at a glance, with less manual formatting on your end.
3. Legends: Pie Chart Fill Improvements
Previously, if your map included pie charts, the legend only showed the fill color, not the line around it. This caused confusion when your pie slices had both a fill and a border. But now, Surfer Beta displays the fill and the outline of a pie chart in your legend, making it easier for stakeholders to match legend entries to pie chart slices.
Why it matters: Small visual inconsistencies can lead to big misunderstandings. This fix ensures the pie charts in your legends reflect exactly what’s on your map. By displaying both the fill and the outline in your legend, your visuals stay consistent and easy to interpret, especially for stakeholders who aren’t as familiar with your data.
4. Legends: Add Drillholes Without Symbology
In previous versions, drillhole layers only appeared in your legend if they had symbology applied. Now, Surfer Beta lets you add drillhole layers to your legend even without symbology. So, if you only have a simple black dot on your map to represent drillholes, it’s no worries. They’ll still show up in your legend.
Why it matters: This update improves clarity for your stakeholders. They no longer have to constantly ask, “What are these black dots on your map?” A quick glance at your legend now clears that up. This feature makes it easy to label drillholes, so your stakeholders can understand what they’re viewing.
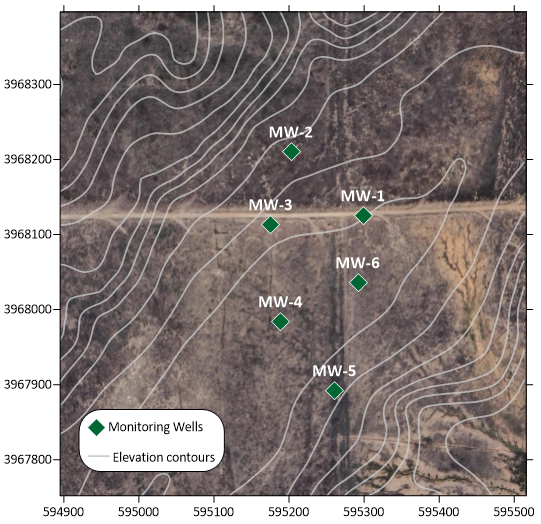
5. Legends: Add Contour Layers
A color scale on your contour map is great, but it’s not always necessary. If you’re creating a contour map where all the contours are gray, you may want to simply include the contours in your legend so stakeholders know what the gray lines mean.
Surfer Beta now gives you the power to do just that—you can include contours directly in your legend without doing any manual steps. Whether you’re showing major and minor contour lines or a gradational color scheme, this improvement lets you communicate your data more effectively and efficiently.
Why it matters: By including contours directly in your legend, you quickly provide context for gray or colored lines that represent elevation, depth, concentration levels, or other variables. You also improve stakeholder understanding so they can make informed decisions.
6. DWG Import & Export Support
Without a doubt, this is one of the most anticipated features in Surfer Beta. Today, the software supports direct import and export of DWG files, the native format for AutoCAD. That means no more dealing with compatibility issues or exporting to or resaving documents as DXF files. You can skip all that and just import and export DWG files into Surfer Beta.
Why it matters: DWG is the industry standard for CAD drawings, and now Surfer Beta works with it directly. This ensures you enjoy fewer steps, fewer conversion errors, and smoother collaboration with engineers, architects, and CAD professionals. You also save time and maintain design integrity across platforms.
7. Import Layers into Separate Base Layers for DWG
DWG files often contain multiple layers—roads, buildings, contours, water bodies, and more. Previously, importing them into Surfer would combine all those layers into one base layer. However, that’s not the case anymore. Now, each DWG layer can be imported into a separate base layer in Surfer Beta, preserving the original organization.
Why it matters: You can isolate and import individual DWG layers as separate base maps into Surfer Beta, ensuring easier management of DWG files with many layers. This granular control helps enhance your visualization, clarify categories, and simplify editing and analysis by letting you focus on the data layers that matter most and equipping you to turn off anything that’s not relevant.
8. Exporting 3D Geometry from 2D Plot View to DXF and DWG (While Retaining 3D)
Surfer Beta now retains 3D geometry when exporting a DXF or DWG from the 2D plot view, a significant upgrade. Previously, whenever you exported from the 2D window, the 3D objects you created would flatten into 2D geometry. The only workaround was to open the 3D View and export from there. But now both export methods preserve your 3D geometry.
Why it matters: Because you’ll preserve elevation (Z) data during export from the 2D or 3D View, you can rest assured your 3D surfaces and structures will be accurate and reusable in Surfer Beta or CAD environments. Also, you don’t have to worry about flattening the 3D geometry in your maps whenever you send your project files or reports to stakeholders and colleagues.
Tech Tip: Ever used a beta software that operated like broken junk, becoming a hindrance to your workflow instead of a help? You don’t have to worry about the same thing with Surfer Beta. It’s designed to function in real workflows and provide really great outputs along the way.
Learn why you can trust Surfer Beta for mapping and modeling →
Ready to Try These Features?
These updates in Surfer Beta are designed to make your workflow easier, your maps clearer, and your visuals even more professional. Whether you’re collaborating across platforms, preparing deliverables for stakeholders, or streamlining your own process, there’s something in Surfer Beta for you.
To take advantage of these new capabilities—and help us continue to make Surfer even better—download the latest version of Surfer Beta today. Test out the features, send us your feedback, and help shape what’s next!