The Hidden Bubbles: Quantifying Greenhouse Gas Emissions From Degrading Permafrost
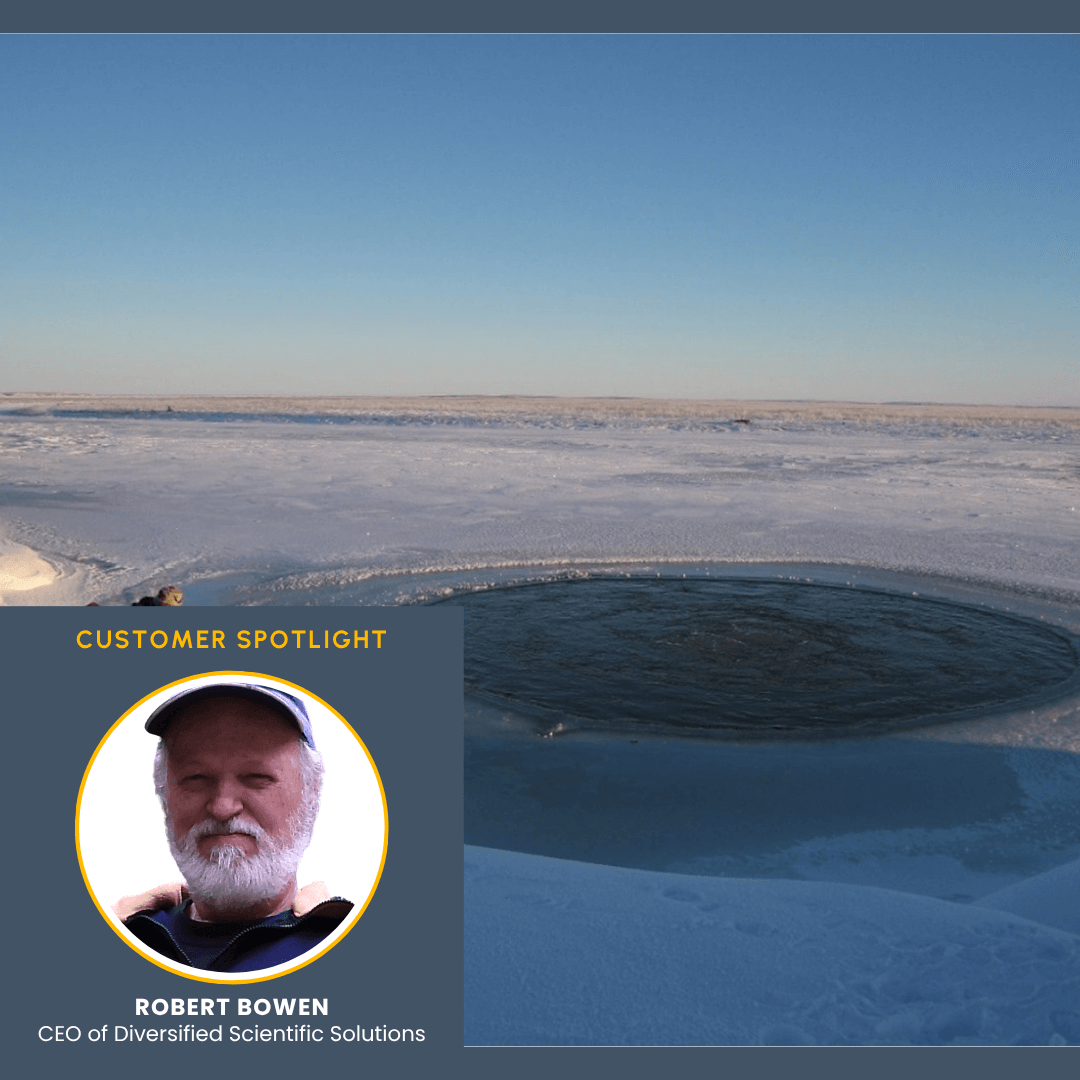
The Earth’s permafrost is a vast expanse of frozen ground that holds a massive reservoir of greenhouse gases. As global temperatures rise and the permafrost thaws, these gases—primarily methane—are released into the atmosphere. But how do you measure these emissions, especially in the remote and harsh landscapes of the Arctic? For the CEO of Diversified Scientific Solutions, Robert Bowen, the answer lies in a blend of innovative engineering, diligent field research, and powerful data visualization tools like Surfer.
The Seeps of the Mackenzie Delta
Bowen was tasked with a multi-year contract for the Pacific Geoscience Centre—Geological Survey of Canada. His mission was the following: to quantify greenhouse gas emissions from degrading permafrost in the Mackenzie Delta, Northwest Territories. The study spanned from 2006 to 2011 and focused on “seeps” or gas emissions found in some of the region’s lakes.
“On these lakes, some of these seeps were so vigorously emitting methane that they appeared on the surface as large bubble plumes ,” Bowen explained. “These were deep gas hydrates, meaning they were methane—and they were working their way up to the surface and bubbling up, contributing to high-latitude greenhouse gas. We wanted to determine the gas flux, an important contributor to climate modeling, so we needed to know how much of this very important greenhouse gas was being emitted into our atmosphere.”
The seeps Bowen studied, some of which had been observed for decades, were so forceful that they created strong upwelling currents that kept the water from freezing, even when the surrounding ice was six feet thick. As Bowen put it: “the bubbling was so vigorous it looked like a jetted hot tub.”
The “Seep Sucker” and Other Innovations
To accurately measure the gas flux coming from the seeps, Bowen and his team needed a way to capture and quantify the bubbles. His solution was a unique contraption he designed just for the project.
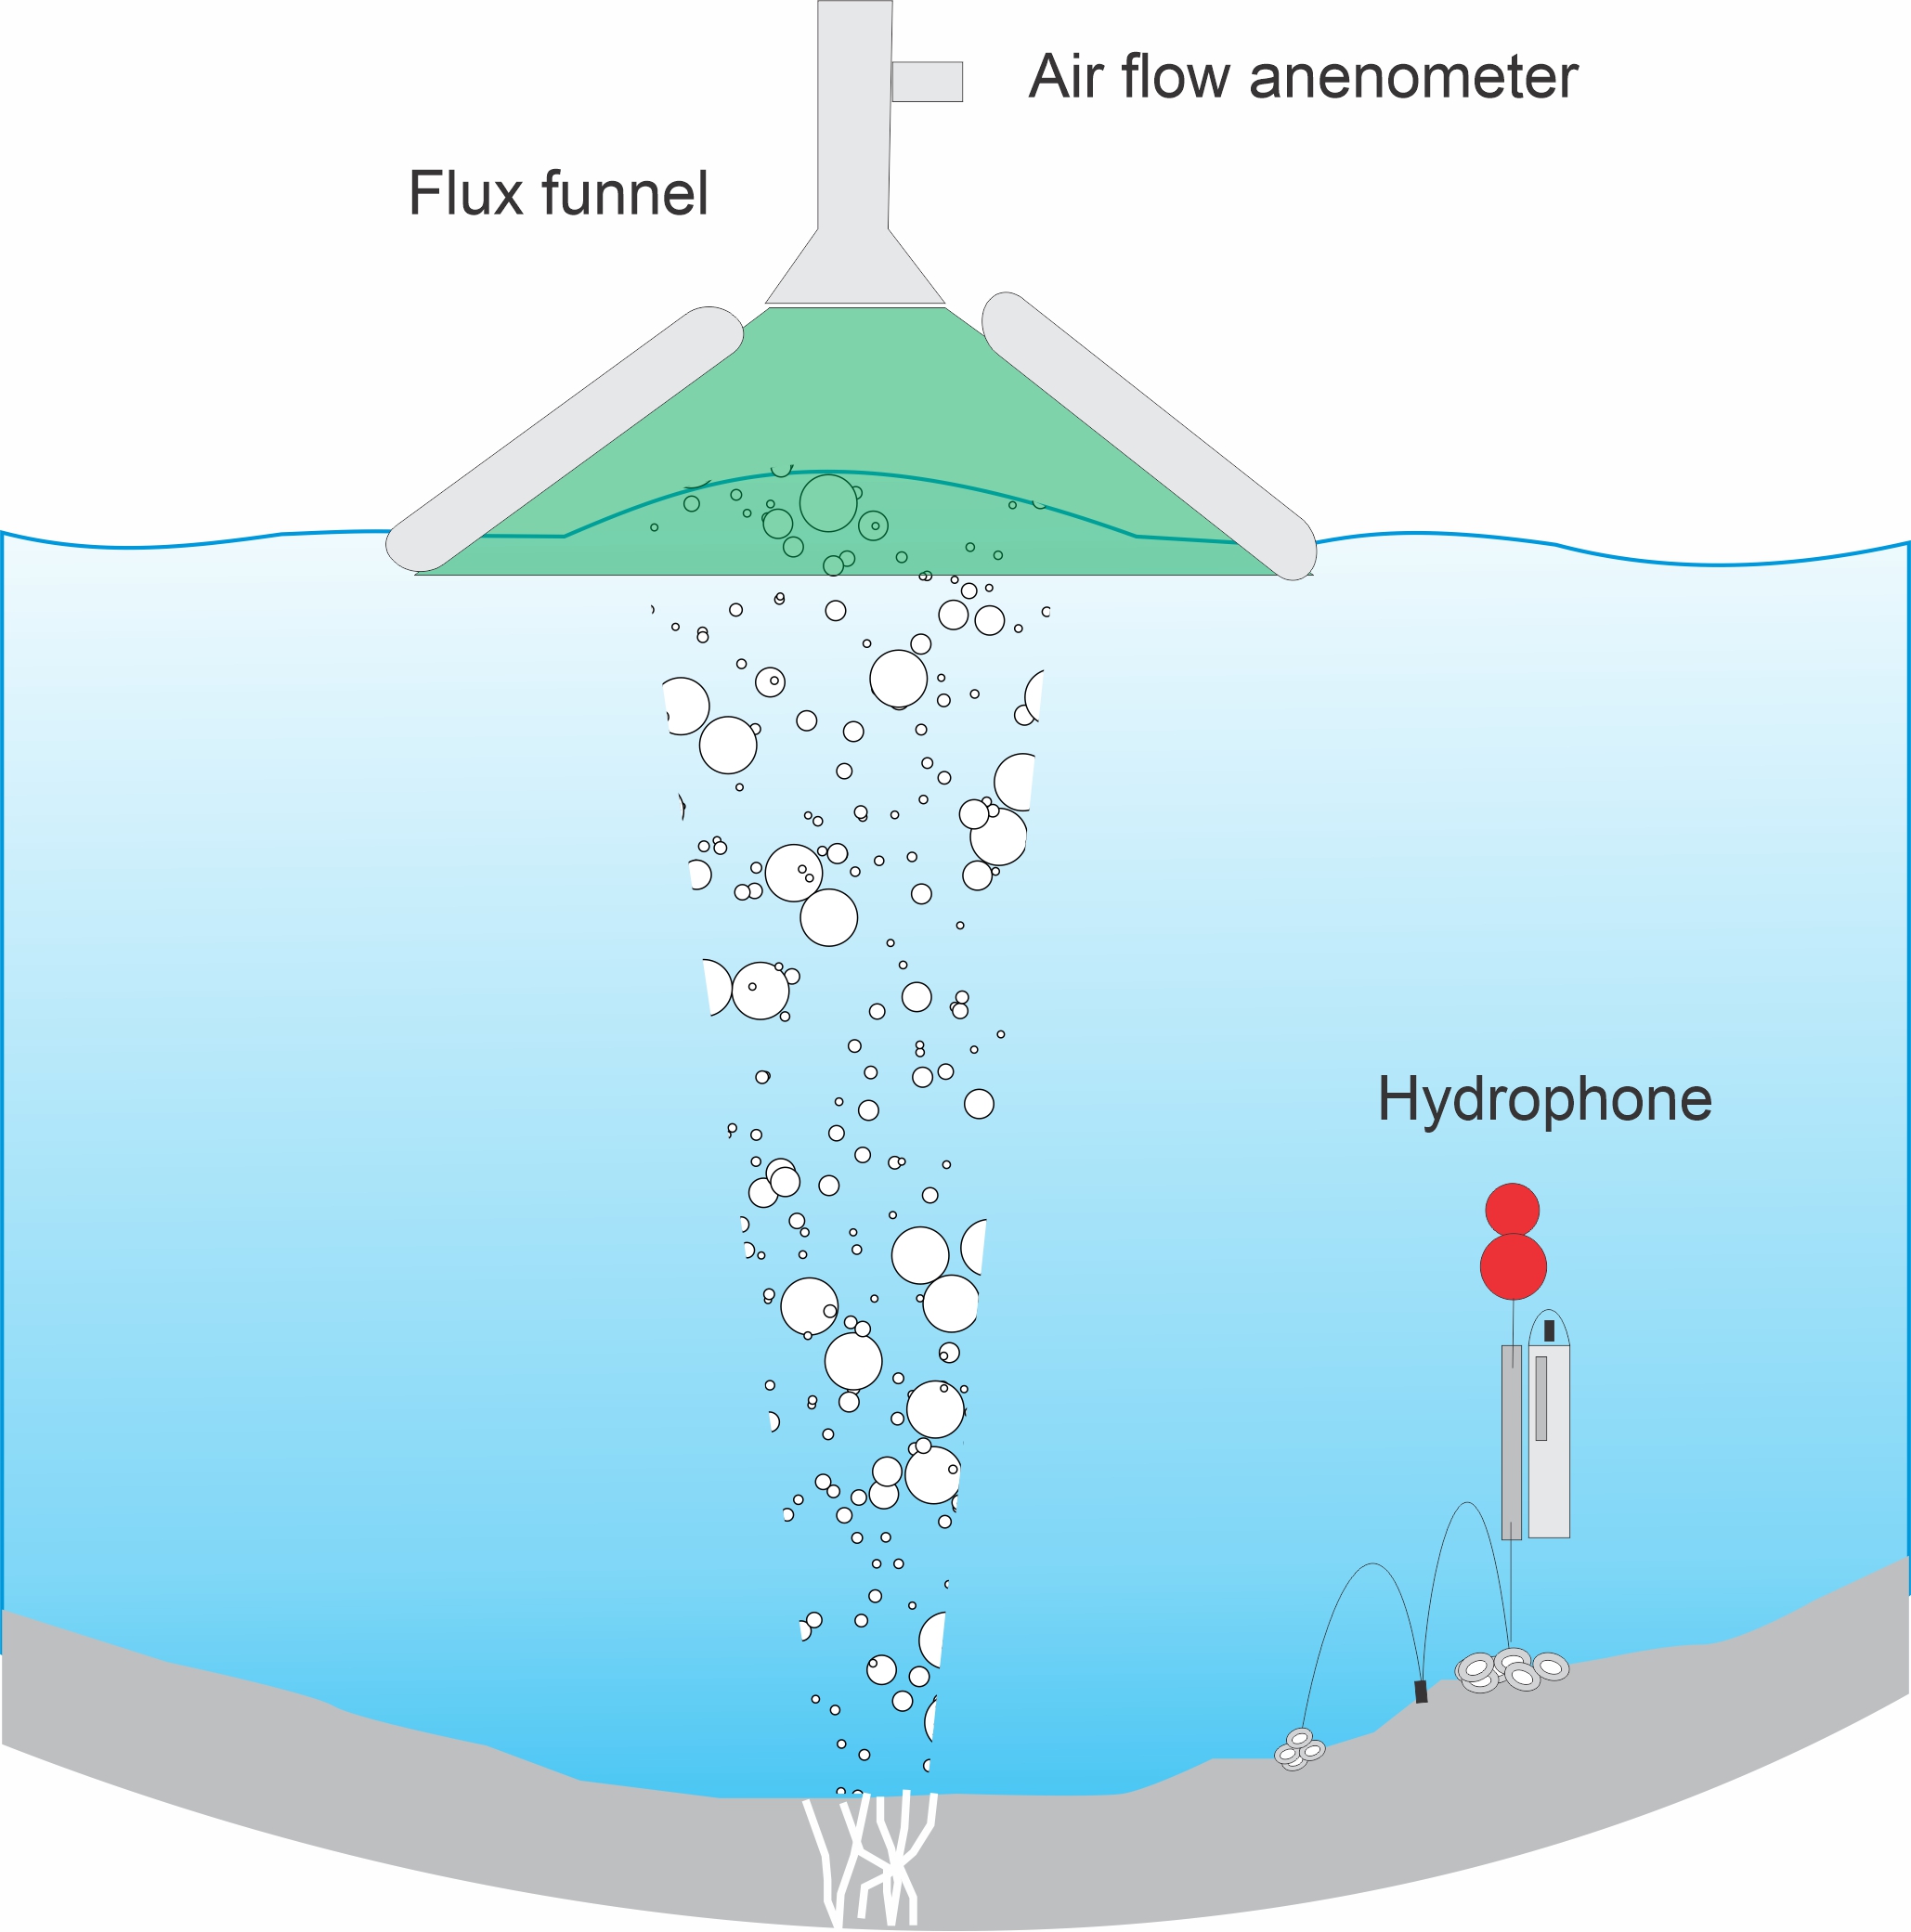
“Part of my role was to develop something called the ‘flux funnel’ or the ‘seep sucker,’” Bowen said. “It was nine meters across, so it was quite a large funnel. And we floated it over the water in the summertime to look at the amount of gas coming up from the floor of a lake on the Mackenzie Delta near the Beaufort Sea.”
Bowen designed the flux funnel with airflow sensors that would measure the gas emissions. He also utilized acoustics to detect bubbles, noting that, “Small bubbles have a high-frequency pitch, and large bubbles have a low-frequency pitch, so I was able to discretize the bubble events and actually create flux data from that.”
Visualizing the Invisible with Surfer
Beyond the field work, a critical part of the project involved understanding the physical features of the seeps themselves. This is where Surfer became an indispensable tool.
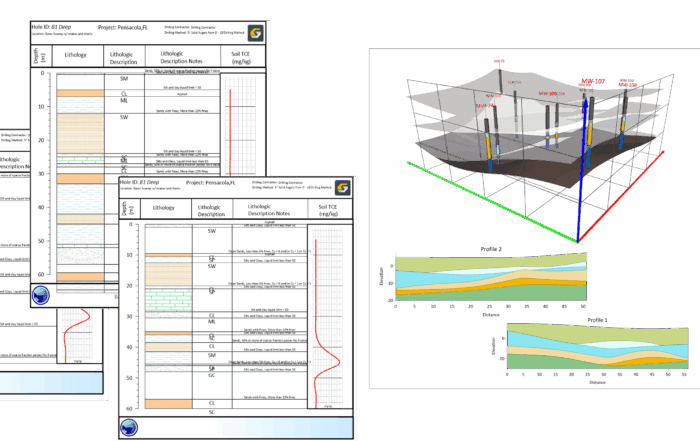
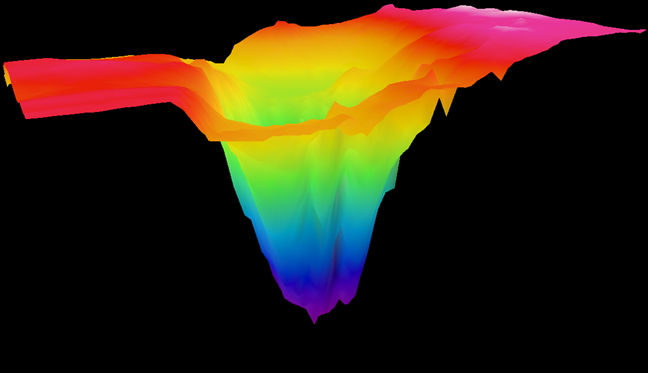
“I used Surfer to create digital elevation models to look at the seeps, which was kind of cool,” Bowen says.
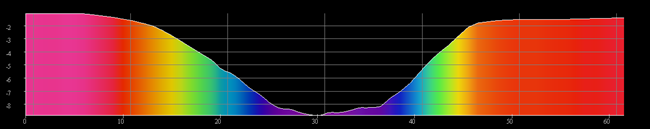
After conducting a bathymetric survey of the lake, he used Surfer to visualize lake bottom “pockmarks”—features created by the constant, vigorous release of gas. At one time, the lake bottom would have been flat. But these gas features were so vigorous that they actually excavated the lakebed and produced deep pockmarks. Surfer’s ability to create and manipulate digital elevation models in 3D was a game-changer in showcasing these features.
“I love Surfer for the ability to rotate these things in three dimensions to give an interesting look at this feature,” Bowen says.
The Power of Ingenuity and Sophisticated Software
Bowen’s work is a testament to the importance of meticulous field research and the power of data visualization. From designing a giant “seep sucker” to using Surfer to bring seeps and invisible pockmarks to life, his project showcases the critical role that innovative scientific methods and powerful software play in addressing complex environmental challenges. Consequently, it’s no surprise that Bowen continues to approach his projects with innovative techniques for field research and effective tools like Surfer.
“Surfer has been a solid tool in creatively expressing and visualizing data throughout my career,” Bowen said. “Now, 35 years later after first using it, Surfer is still part of my workflow—having worked with sonar, multibeam, satellite altimetry, weather, air photo interpolation and modeling of water quality parameters as they relate to a eutrophic lake with significant algal blooms.”
Want to read more stories about scientists and engineers who are using innovative techniques and tools to impact the world of geoscience? Subscribe to our blog so you never miss an article!