Visualizing Boreholes: How to Boost Efficiency and Visual Quality
When you’re interpreting the subsurface, boreholes are one of your most valuable sources of truth. They help reveal lithology changes, groundwater conditions, contamination pathways, and mineralized zones. But while the data inside a borehole is essential, the way you visualize that data is just as critical. Clear, professional visuals are what help stakeholders understand what the subsurface is doing so they can make informed decisions.
Unfortunately, borelogging tools can make creating those visuals harder than necessary, forcing you to accept inadequate outputs or spend time on tedious workarounds. The good news? There’s a faster, more flexible way to get the exact look you need to inform and equip stakeholders.
The Problem With Visualizing Boreholes Today
Before diving into the solution, let’s briefly discuss the problem. Current borelogging tools don’t offer the customization and visual quality you need to highlight your drillhole data. Despite how critical borehole logs are for subsurface interpretation, most software only lets you produce a basic log. They don’t give you the tools to customize your visuals so you meet stakeholders’ expectations and requirements.
On the surface, this might seem like a cosmetic issue, but it’s not. When a borehole is visually inadequate, it becomes harder for stakeholders to interpret your findings. That affects understanding, confidence, and ultimately the decisions being made.
The Cost of Not Having the Right Tools to Visualize Boreholes
Now, what happens if you want to overcome the issues that traditional borelogging solutions present so you can produce clear, professional visuals? Most geoscientists and engineers end up taking one of two paths.
The first is simply accepting low-quality outputs that don’t communicate the subsurface clearly. While the quickest path, this doesn’t typically lead to a final output you’re excited to share with stakeholders.
The second is fixing everything manually, often by editing logs in external design tools or piecing together formatting in programs never intended for technical visualization. This particular route is not only time-consuming but also hard to standardize across projects and teams. On top of that, after doing all the additional work, the end result still tends to fall short of the clean, modern visuals stakeholders need to understand your data and make informed decisions.
A Better Way Forward: Customizable Borehole Log Templates
Because borehole visuals directly shape how stakeholders interpret the subsurface, it’s critical to elevate their quality. That’s where customizable borehole log templates come into play.
Templates give you a clear bridge between the raw data you collect and the professional-quality visuals you need to communicate it. They equip you to start from a presentation-ready foundation and customize details so you can provide borehole logs that foster confident interpretation and decision-making. What does that actually look like in practice? Here’s a breakdown of the specific ways templates elevate the visual quality of boreholes.
1. Clear, Customizable Lithology Styles
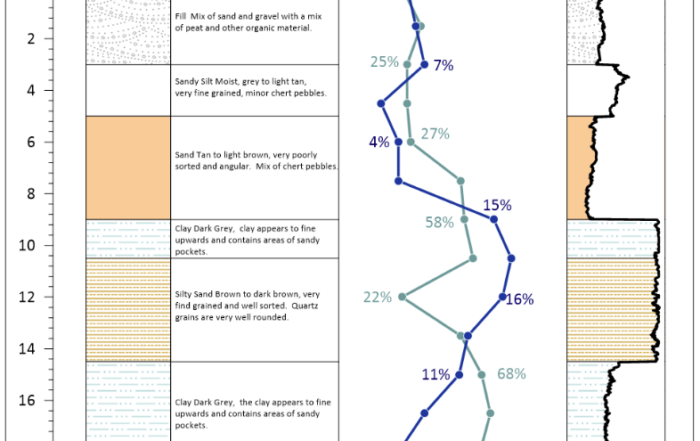
Because user-friendly tools like Grapher give you full control over lithology colors, symbols, labels, axes, and other template elements, you can tailor visuals to highlight important data and meet project standards and requirements. This ensures critical insights like subsurface changes and patterns are easier to interpret, reducing ambiguity and strengthening understanding.
Tech Tip
Grapher has extensive customization tools that you can use to tailor templates from the Golden Gallery, a growing library of templates designed for and by scientists and engineers. The types of templates available include the Mining Logs Template, Drillhole Logs Template, and the Environmental Template. If you want to create the professional-quality visuals you need, download templates from the Golden Gallery and customize them in Grapher to get the exact look you’re seeking.


2. Consistent Formatting Across All Boreholes
You need to keep borehole logs visually consistent, especially across large projects. Templates help with this by standardizing depth scales, column widths, symbology, and layout structure. If you’re comparing dozens of boreholes, for example, uniform formatting helps patterns stand out and ensures cleaner, more credible interpretation.
3. Clean Alignment, Labeling, and Typography
Templates maintain precise alignment between columns, ensure labels are presented clearly, and apply typographic consistency throughout the log. These small but meaningful details give your visuals a polished, professional look that resonates with stakeholders. When your borehole logs look refined, they’re more likely to trust your analysis.
Templates Enhance Efficiency—They Don’t Slow It Down
Another benefit of templates is that they don’t take away from your efficiency as they improve visual quality; in fact, templates enhance it. They streamline your workflow in several meaningful ways, which you can find below.
1. Fast, Consistent Generation of Multiple Borehole Logs
Templates eliminate repetitive formatting work. Once your structure is set, you can quickly produce multiple logs with identical styling. There’s no need to rebuild layouts or manually align anything from scratch.
2. No More Screenshots or Manual Image Editing
Because templates are already presentation-ready, you can export clean, high-quality visuals directly from your software. This removes the need for putting screenshots together or fixing formatting in external design tools.
3. Effortless Updates When New Data Arrives
Whether you’re resampling a well or adding drilling phases, templates let you swap in refreshed data without overhauling your layout. Your visuals update instantly, leading to faster iteration and reducing the chance of errors.
4. Easy for Teammates to Use Without Extensive Training
Templates make collaboration easier and smoother. Sharing a template gives teammates a structured, ready-to-use starting point that helps them create professional-quality logs without extensive guidance from you. That’s especially true when a template comes with instructions on how to use it.
5. A More Repeatable, Scalable Workflow Overall
By standardizing your borehole visualization process, templates help your entire team work more efficiently when similar projects arise. Instead of starting from scratch, future initiatives can rely on the same template foundation.
Where the Difference Really Shows Up
Although templates are great, when should you actually use them? In short, they shine in moments when clarity, consistency, and speed matter most. Here are a few example scenarios where you’d want to consider them.
Client-Facing or Regulatory Deliverables Where Visual Clarity Matters
When your visuals need to stand up to scrutiny—whether from clients, regulators, or multidisciplinary teams—templates help provide borehole logs that are polished, legible, and easy to interpret. High-quality visuals reduce confusion, build credibility, and help stakeholders trust your conclusions.
Multi-Borehole or Multi-Site Projects That Require Consistency
If you’re working across several wells, sites, or datasets, templates keep everything consistent. Instead of manually recreating formatting for each log—which can be an error-prone process—you can maintain the same color schemes, symbology, depth scaling, and layout to make comparisons straightforward.
Recurring Monitoring or Reporting Workflows
Projects involving quarterly sampling, long-term remediation, groundwater monitoring, or repeated exploration phases benefit tremendously from templates. You can quickly recreate the same visuals with new data, ensuring an identical structure each reporting cycle.
When Borehole Visuals Shape Technical or Operational Decisions
In many cases, borehole visuals aren’t just explanatory but also actionable. When logs inform remediation strategies, drilling locations, safety planning, or resource allocation, there’s little room for ambiguity. Templates help ensure those decisions are grounded in visuals that are consistent, precise, and easy to interpret, reducing the risk of missteps caused by unclear or inconsistent graphics.
Better Borehole Visuals, Better Outcomes
Clear, professional borehole visuals are an essential part of subsurface interpretation and decision-making. When the tools you rely on produce boreholes that are visually inadequate, the burden falls on you to either bridge the gap with manual fixes or settle for an output that doesn’t meet standards. Templates change that dynamic entirely. They give you a strong, customizable foundation for visual quality so your borehole logs communicate insights clearly, without requiring more effort on your end.
So whether you’re comparing dozens of wells or updating monitoring logs with new data, use templates to make high-quality visuals efficiently. Your stakeholders will gain the clarity they need to understand your data and make informed decisions with confidence.
Ready to see the difference that templates make for yourself? Explore the Golden Gallery’s borehole log templates, and use them in Grapher to create clearer, more compelling visuals!
FAQ: Borehole Visualization & Templates
Boreholes are narrow shafts drilled into the ground to collect information about subsurface conditions. They’re commonly used to investigate soil, rock, groundwater, and contaminants beneath the surface. Boreholes provide direct, physical insight into what’s happening underground, making them a foundational data source for many geoscience and engineering projects.
Boreholes are used across environmental, geotechnical, hydrogeological, and resource exploration projects. Common uses include identifying subsurface stratigraphy, monitoring groundwater levels, assessing contamination, evaluating foundation conditions, planning drilling or remediation strategies, and estimating resource potential. In short, boreholes help teams make informed decisions about what’s below the surface.
Templates can help you create any visual. They offer a clean, customizable starting point, specifically for your borehole visuals. You can tailor lithology colors, patterns, symbols, labels, and layout elements to match your project’s needs. Because templates enforce consistent formatting across logs, they also make it easier to compare wells and interpret patterns.
Templates can save you significant time. They eliminate repetitive formatting and update visuals instantly when new data comes in. They also provide a starting point, so you don’t have to start from scratch every time.
If you collect new samples from your borehole log every month, quarter, or year, templates let you refresh your visuals with new data instantly—without redesigning anything. This is especially useful for long-term monitoring, remediation projects, or exploration programs.
Not at all. Templates provide structure, but you can customize every detail, including colors, patterns, axes, symbols, layout spacing, headers, and more. Think of templates as a strong foundation that speeds up your work while still giving you full creative and technical control.
Templates bring value to:
- Geoscientists producing client-facing or regulatory deliverables
- Teams working across multiple boreholes or multiple sites
- Projects requiring consistent formatting and repeatable workflows
- Anyone whose borehole visuals influence decisions, budgets, or engineering design
A shared template ensures everyone starts with the same structure and styling. Even less experienced team members can produce professional logs, reducing bottlenecks, eliminating rework, and decreasing the time it takes to train. Templates create a shared visual standard that improves alignment and efficiency across teams.
You can explore customizable borehole log templates in the Golden Gallery. All of the templates can be used if you have Grapher 26 or higher.
If you don’t have access to Grapher, you can download a 14-day free trial.