Top Ways 3D Data Visualization Is Innovating Water Resource Management
Water resources—whether aquifers, rivers, or lakes—don’t exist in flat layers. They move, interact, and evolve in three-dimensional space. Yet, for decades, it’s been common to try to visualize and understand these systems using 2D maps that can’t fully capture waterbodies. The result? The inability to effectively communicate insights, reducing stakeholder understanding and informed decision-making.
That’s where 3D data visualization changes everything. By transforming complex water data into realistic visuals that precisely reflect relationships, movement, and scale, 3D helps relay information clearly so stakeholders can easily grasp it and take the best steps forward.
Why 2D Falls Short for Communicating Water Data
First, let’s dive deeper into why 2D maps fall short in visualizing water data. When it comes to understanding water systems, 2D can only take you so far, primarily because it presents flat representations of three-dimensional features, leading to challenges in stakeholder understanding and decision-making.
For example, a traditional contour map or set of cross-sections requires stakeholders to mentally reconstruct depth, elevation, and thickness to visualize what’s really happening underground. Even with technical stakeholders, this process can be frustrating and prone to error. One misread contour line or incorrect assumption about groundwater can lead to inaccurate conclusions.
However, the limitations of 2D maps become even more apparent when sharing findings with non-technical audiences. A flat map visualizing water data might show declining groundwater or the spread of a contaminant plume, but it doesn’t fully capture the magnitude of the problem. Decision-makers—such as city councils, funding agencies, or regulatory boards—often need more intuitive visuals to grasp what’s at stake. Without a clear, realistic picture of the issue, communicating urgency or gaining project approval can become a major challenge.
That’s why the transition from 2D to 3D is such a significant breakthrough in visualizing water data that stakeholders at any technical level can understand and act on.
How 3D Visualization Is Transforming Water Resource Management
3D data visualization is redefining how water resources are communicated and understood. By turning complex datasets into clear, spatially accurate models, 3D data visualization helps you showcase what’s really happening above and below ground. To make that more practical, here are some ways 3D communicates water data effectively so stakeholders understand and move forward in the right direction.
1. Delineating the Hidden Aquifer Geometry
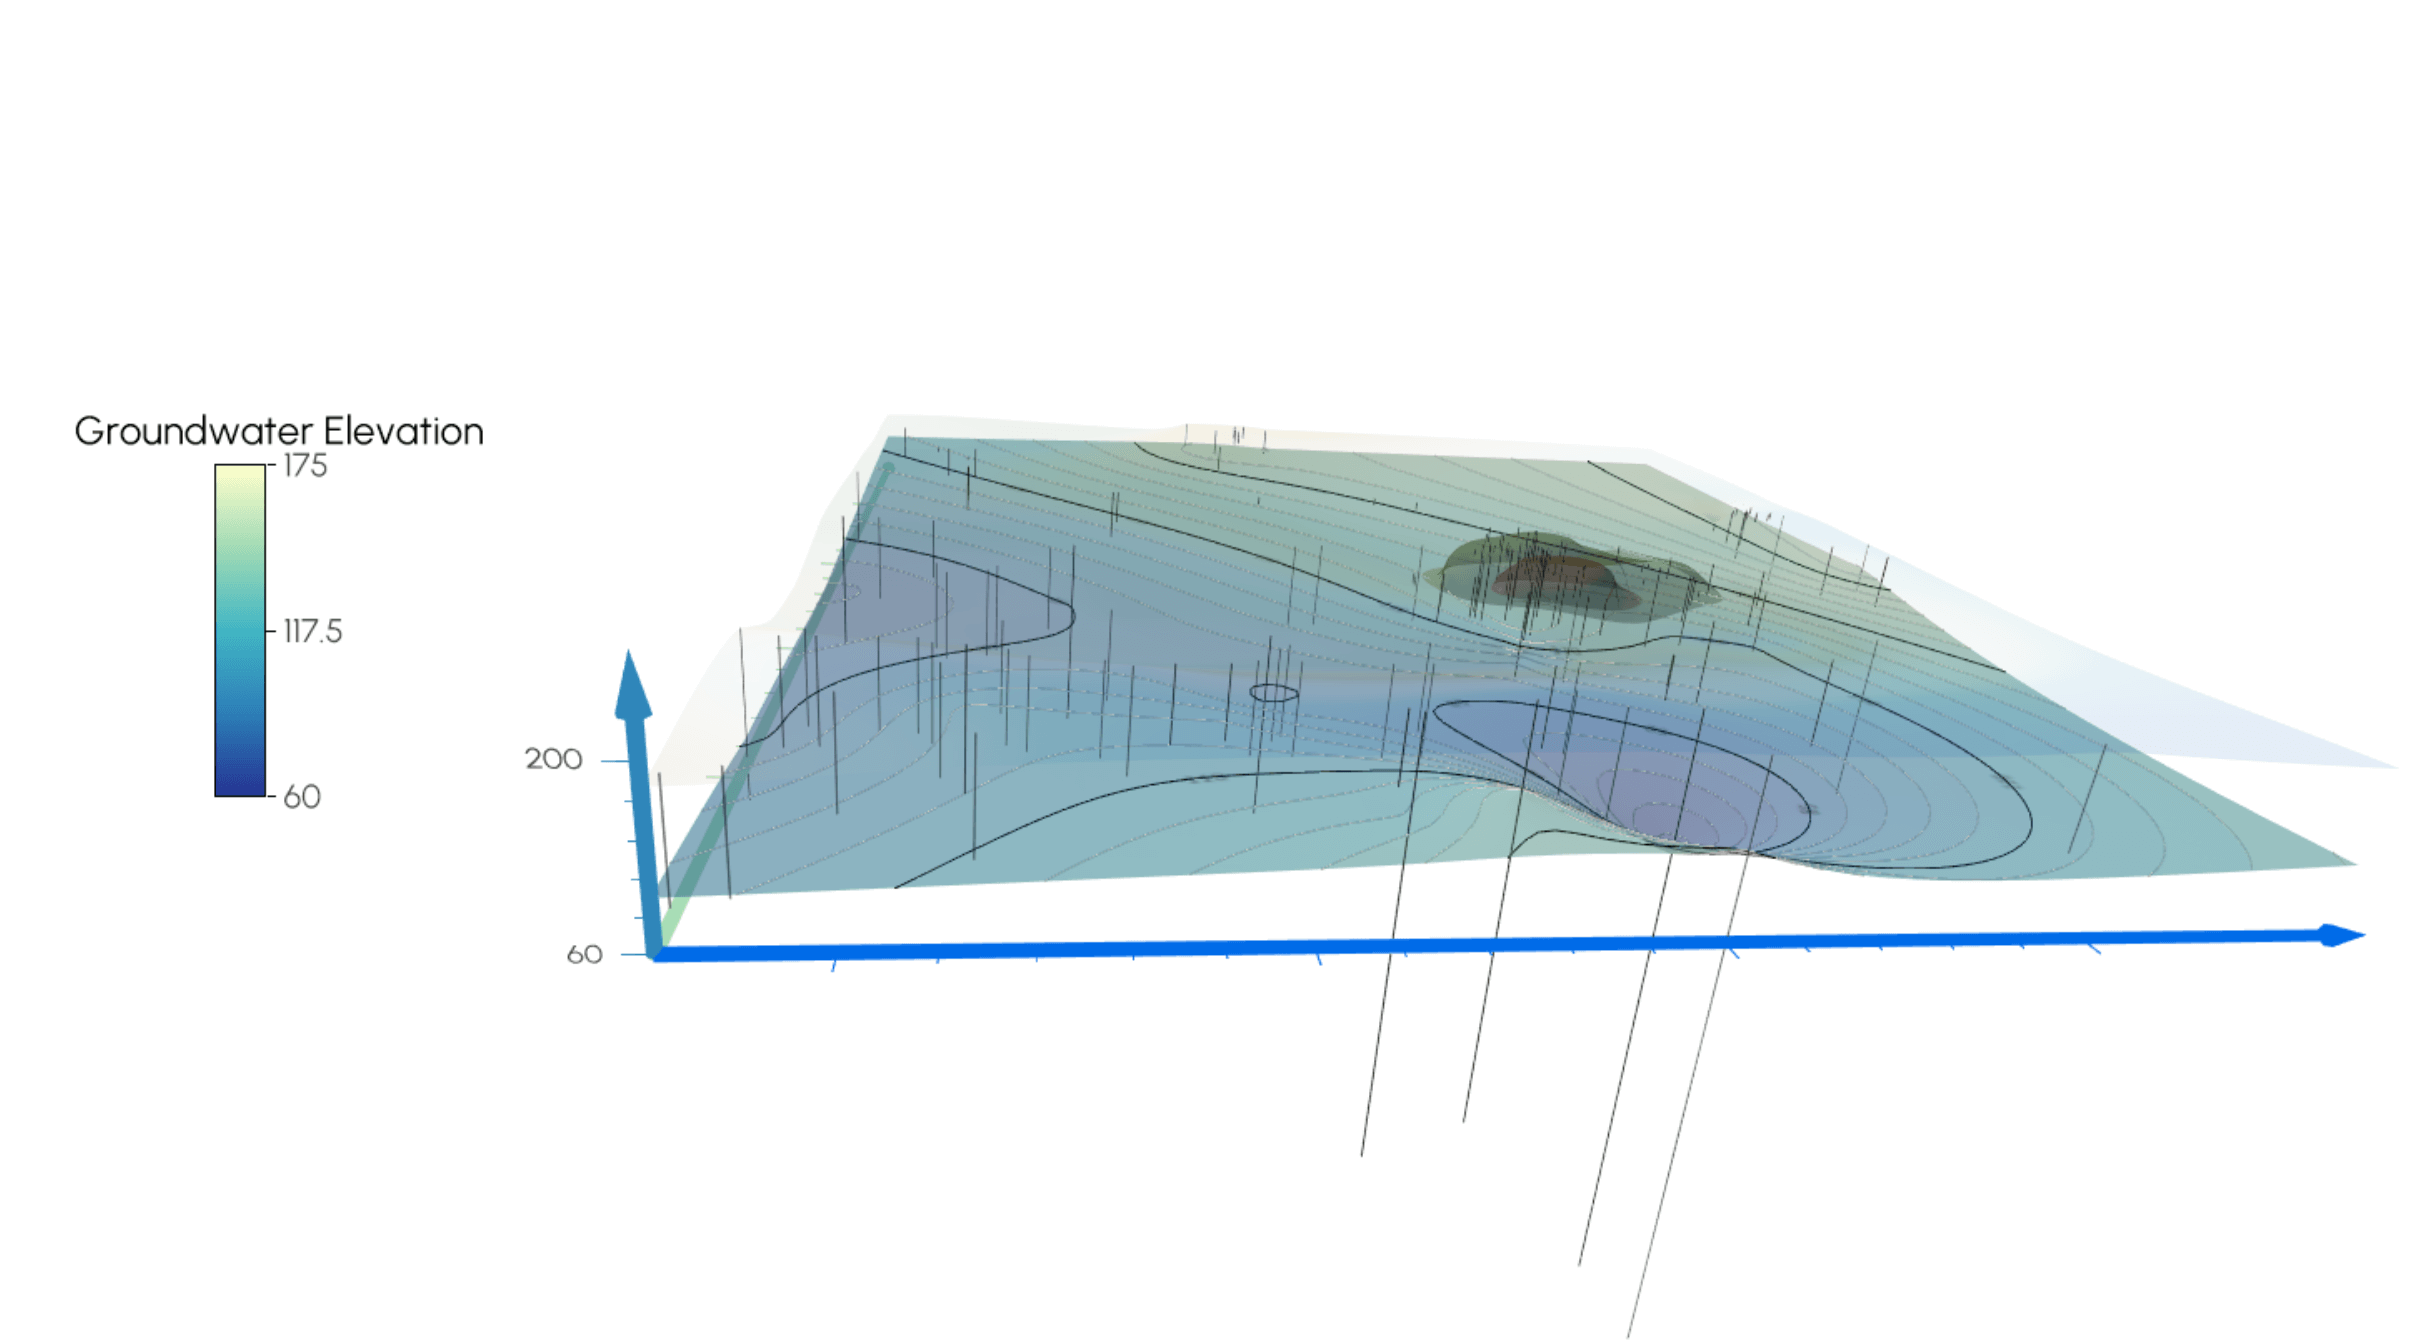
A key challenge in groundwater management is understanding the shape and structure of aquifers that lie hidden below the surface. By constructing 3D models of hydrostratigraphic units using well logs, drill cores, and geophysical surveys, you can visualize the true geometry of aquifers and aquitards. This enables stakeholders to clearly see thickness, depth, and boundaries, all of which are crucial for identifying storage capacity and vulnerable recharge zones. The result? More accurate water budgeting, improved regulation, and a stronger foundation for sustainable pumping practices that prevent over-extraction.
2. Visualizing Surface Water–Groundwater Interaction
The relationship between rivers and aquifers is complex. And in 2D, it’s often misunderstood. Integrating surface topography, river bathymetry, and subsurface models into a single 3D data visualization reveals how and where these systems interact. For instance, you can pinpoint where a river is gaining water from an aquifer or losing it to recharge the groundwater below. This visual clarity leads to better environmental protection, equipping resource managers to define minimum environmental flows, mitigate drought impacts, and safeguard ecosystems that depend on balanced water exchange.
3. Tracking Contamination for Targeted Remediation
When contamination occurs, response time and precision matter. 3D data visualization helps you create volumetric renderings of contaminant plumes based on monitoring well data. By overlaying these plumes with geological layers and satellite imagery, you clearly see the full path and spread of contamination in context. This helps you strategically place recovery wells in the most effective locations while giving regulators and nearby communities a transparent, easy-to-understand visual of the risks and remediation plan.
4. Illustrating Watershed Runoff and Flood Risk
Flood risk management depends on understanding how water flows across terrain—and 3D data visualization delivers that insight with clarity. Using high-resolution elevation models, hydrologists can create 3D watershed models that visualize flow paths, drainage basins, and inundation depths during flood events. These models highlight high-risk areas for erosion, overflow, or deep flooding, helping planners design safer infrastructure, develop targeted mitigation strategies, and create more intuitive evacuation maps that could save lives.
Seeing Water Clearly With 3D Data Visualization
At its core, 3D data visualization helps you do one thing that 2D maps can’t: see water as it truly exists and behaves. From the depth and shape of aquifers to the movement of contamination plumes, 3D visualization communicates complex data in an understandable way to drive informed decision-making. If you’ve ever needed a reason to start incorporating 3D into your workflow when visualizing water data, let effective communication that drives understanding and results be the inspiration you need to take that step.
Want to try using 3D to visualize your water data? Download the 14-day free trial of Surfer to explore 3D tools that’ll help bring your insights to life!