Latest Articles
- May 20, 2026|Gabbie Rhodes|14 min read
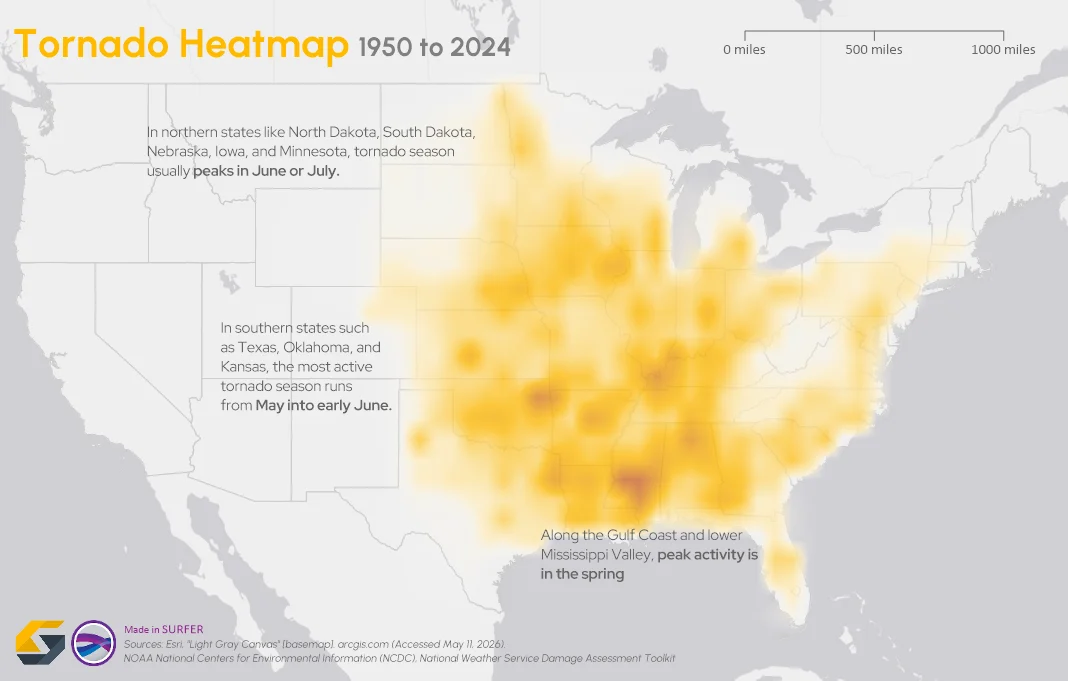
To truly answer the question, "what damage can a tornado cause," the first step is analyzing broader patterns across communities and landscapes.
Trending articles
- By Jake Stachewicz
- By Jake Stachewicz
- By Jake Stachewicz
- By Gabbie Rhodes
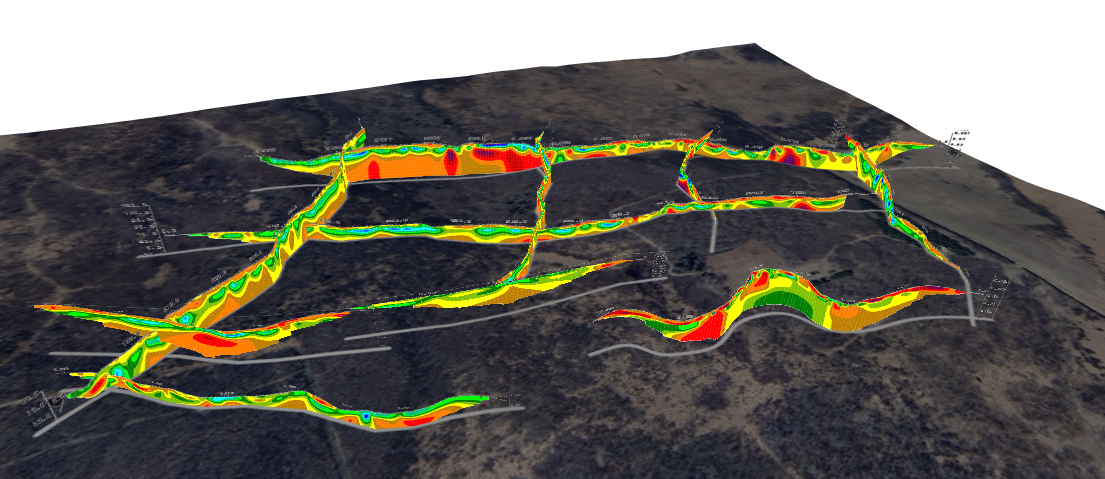
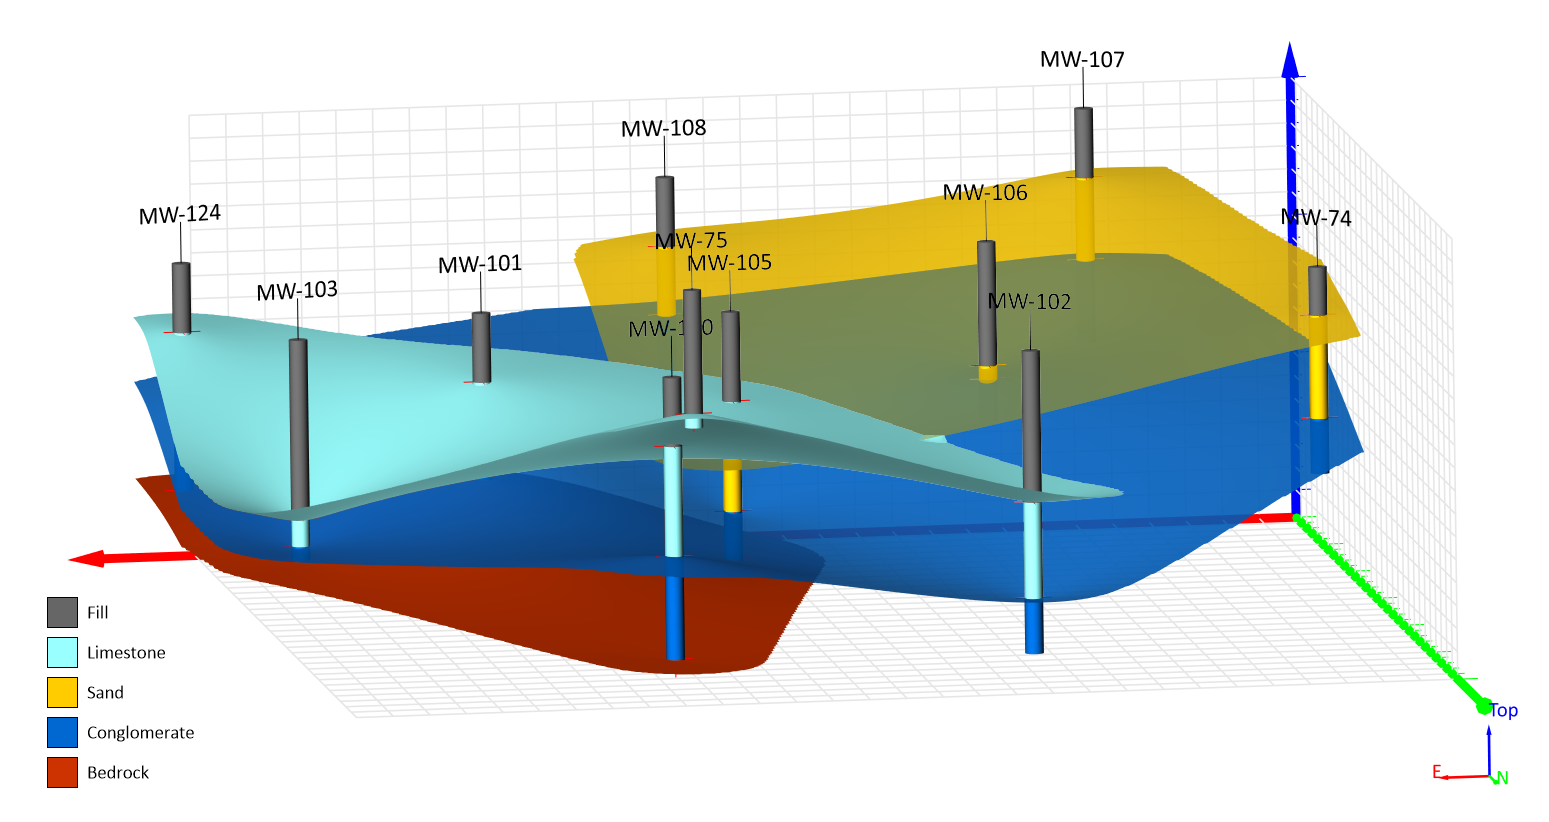
- May 20, 2026|Gabbie Rhodes|7 min read
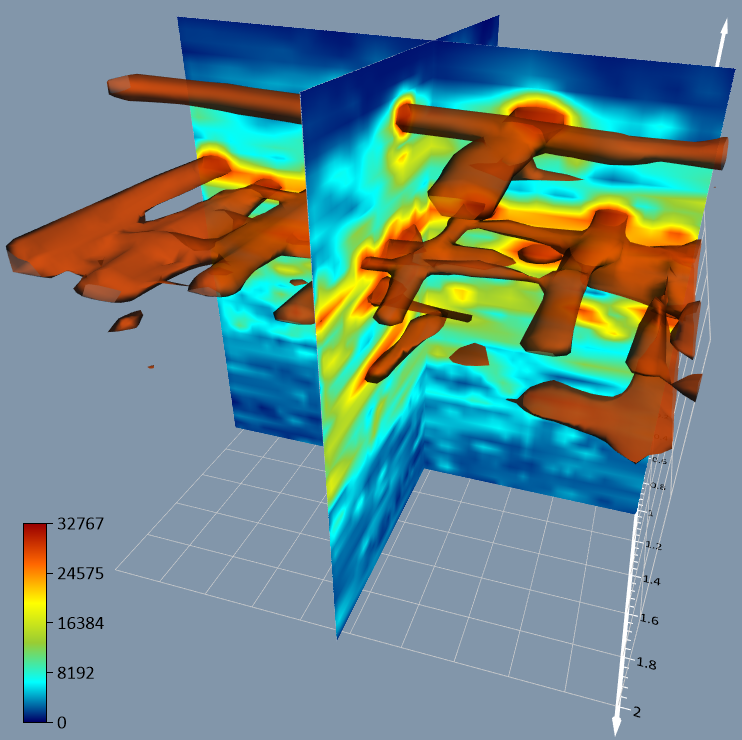
The gap between analysis and true spatial understanding has real consequences in subsurface mapping. 3D modeling closes that gap.
- May 14, 2026|Gabbie Rhodes|10 min read
Should you create a grouped, stacked, or a simple bar chart? The structure you choose matters. Discover bar chart examples to guide your choice.
Data Visualization
- May 14, 2026|Gabbie Rhodes|10 min
Should you create a grouped, stacked, or a simple bar chart? The structure you choose matters. Discover bar chart examples to guide your choice.
- May 14, 2026|Gabbie Rhodes|7 min
Discover how a scientific bar chart translates technical datasets into structured, understandable insights for stakeholders.
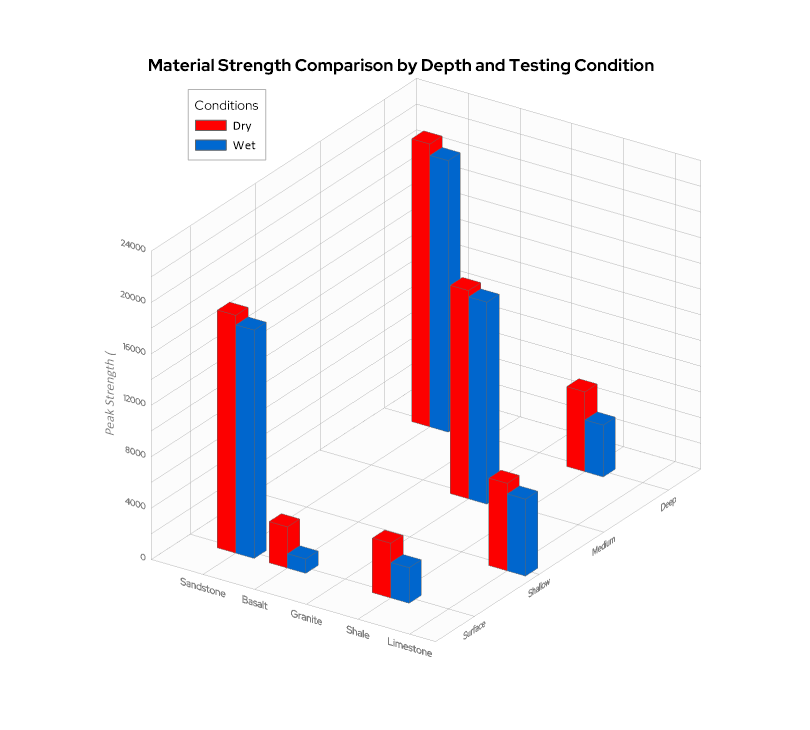
- Apr 29, 2026|Gabbie Rhodes|10 min
When you’re working with three variables that interact with one another—a 3D bar chart can reveal patterns that a flat chart can’t fully capture.
- Apr 23, 2026|Gabbie Rhodes|16 min
The strongest candidates are often in high demand. But with the right approach, you can attract and recruit top talent to build a stronger team.

Spotlights
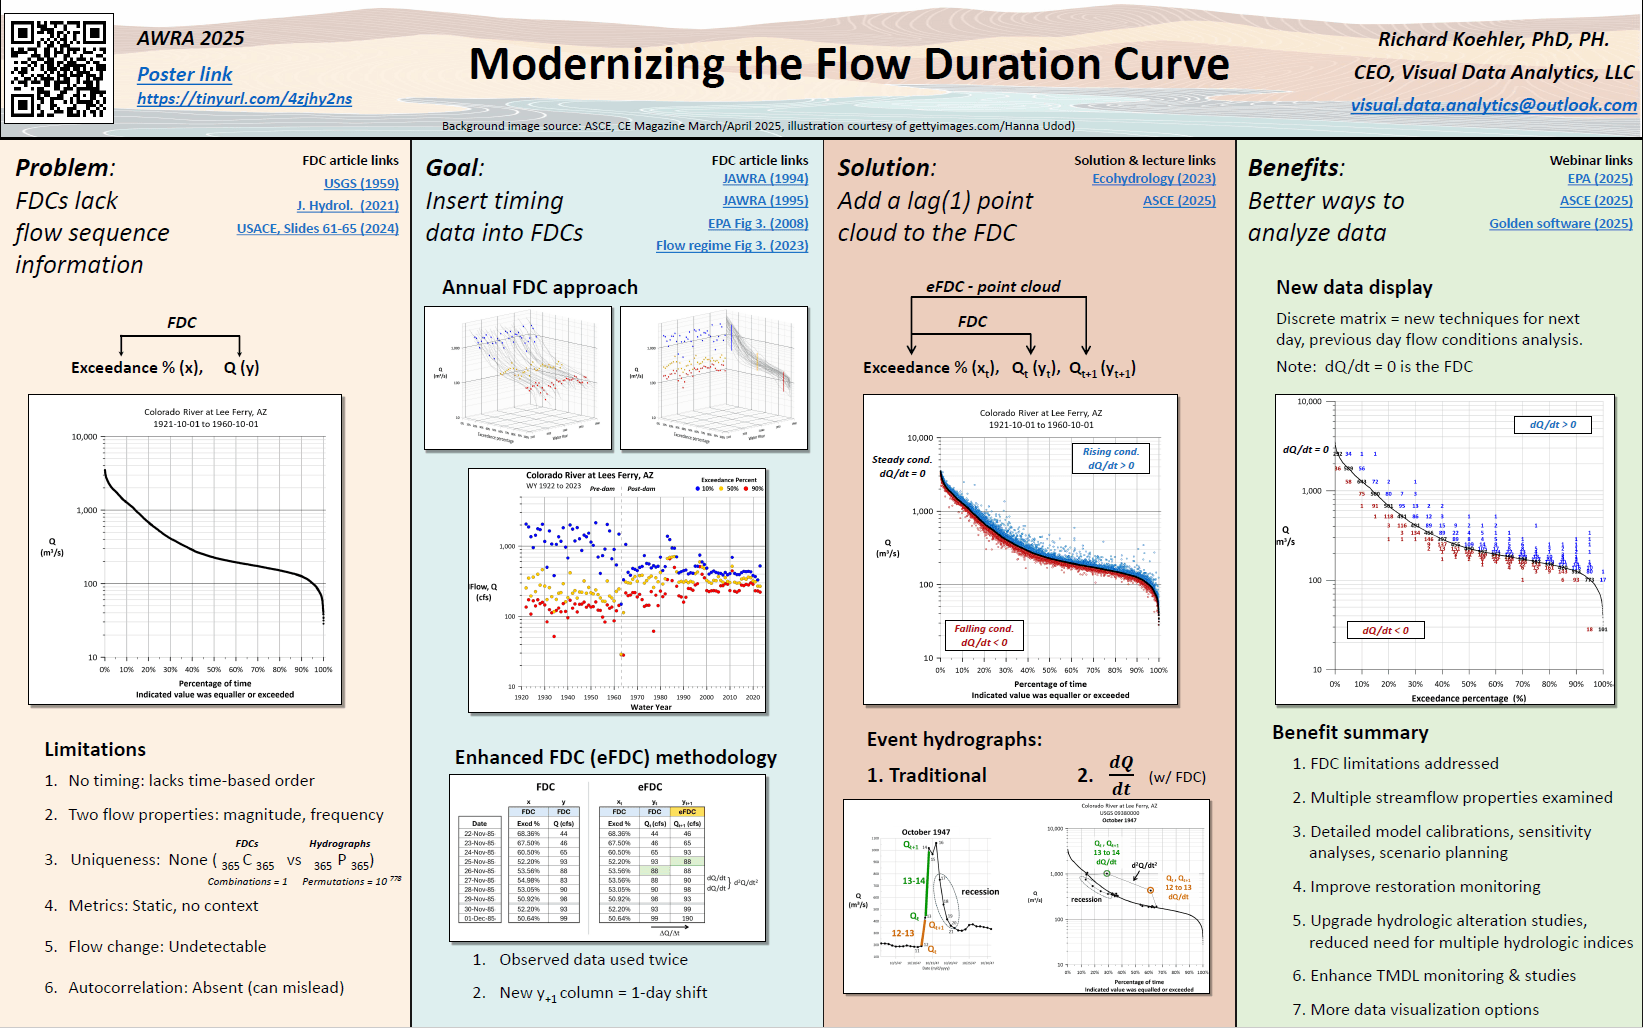
- Apr 8, 2026|Gabbie Rhodes|5 min read
At large conferences, posters compete for attention. Rick Koehler, Ph.D., PH, understands this well and uses information design to stand out.
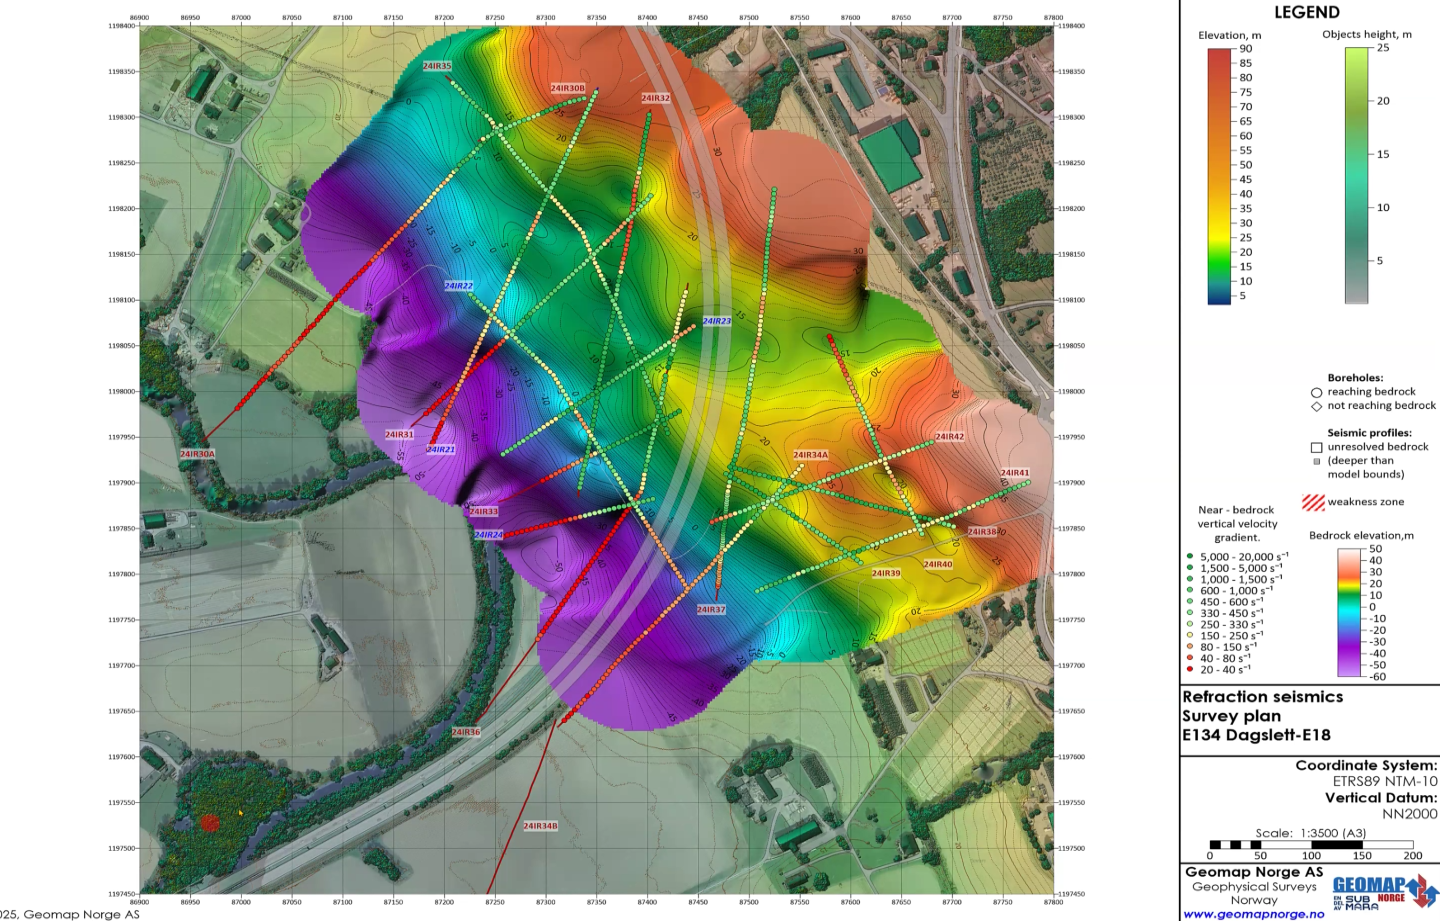
- Apr 1, 2026|Gabbie Rhodes|6 min read
From surface to subsurface features, Alexey Shulgin translates geophysical measurements into clear insight to drive stakeholders' decision-making.
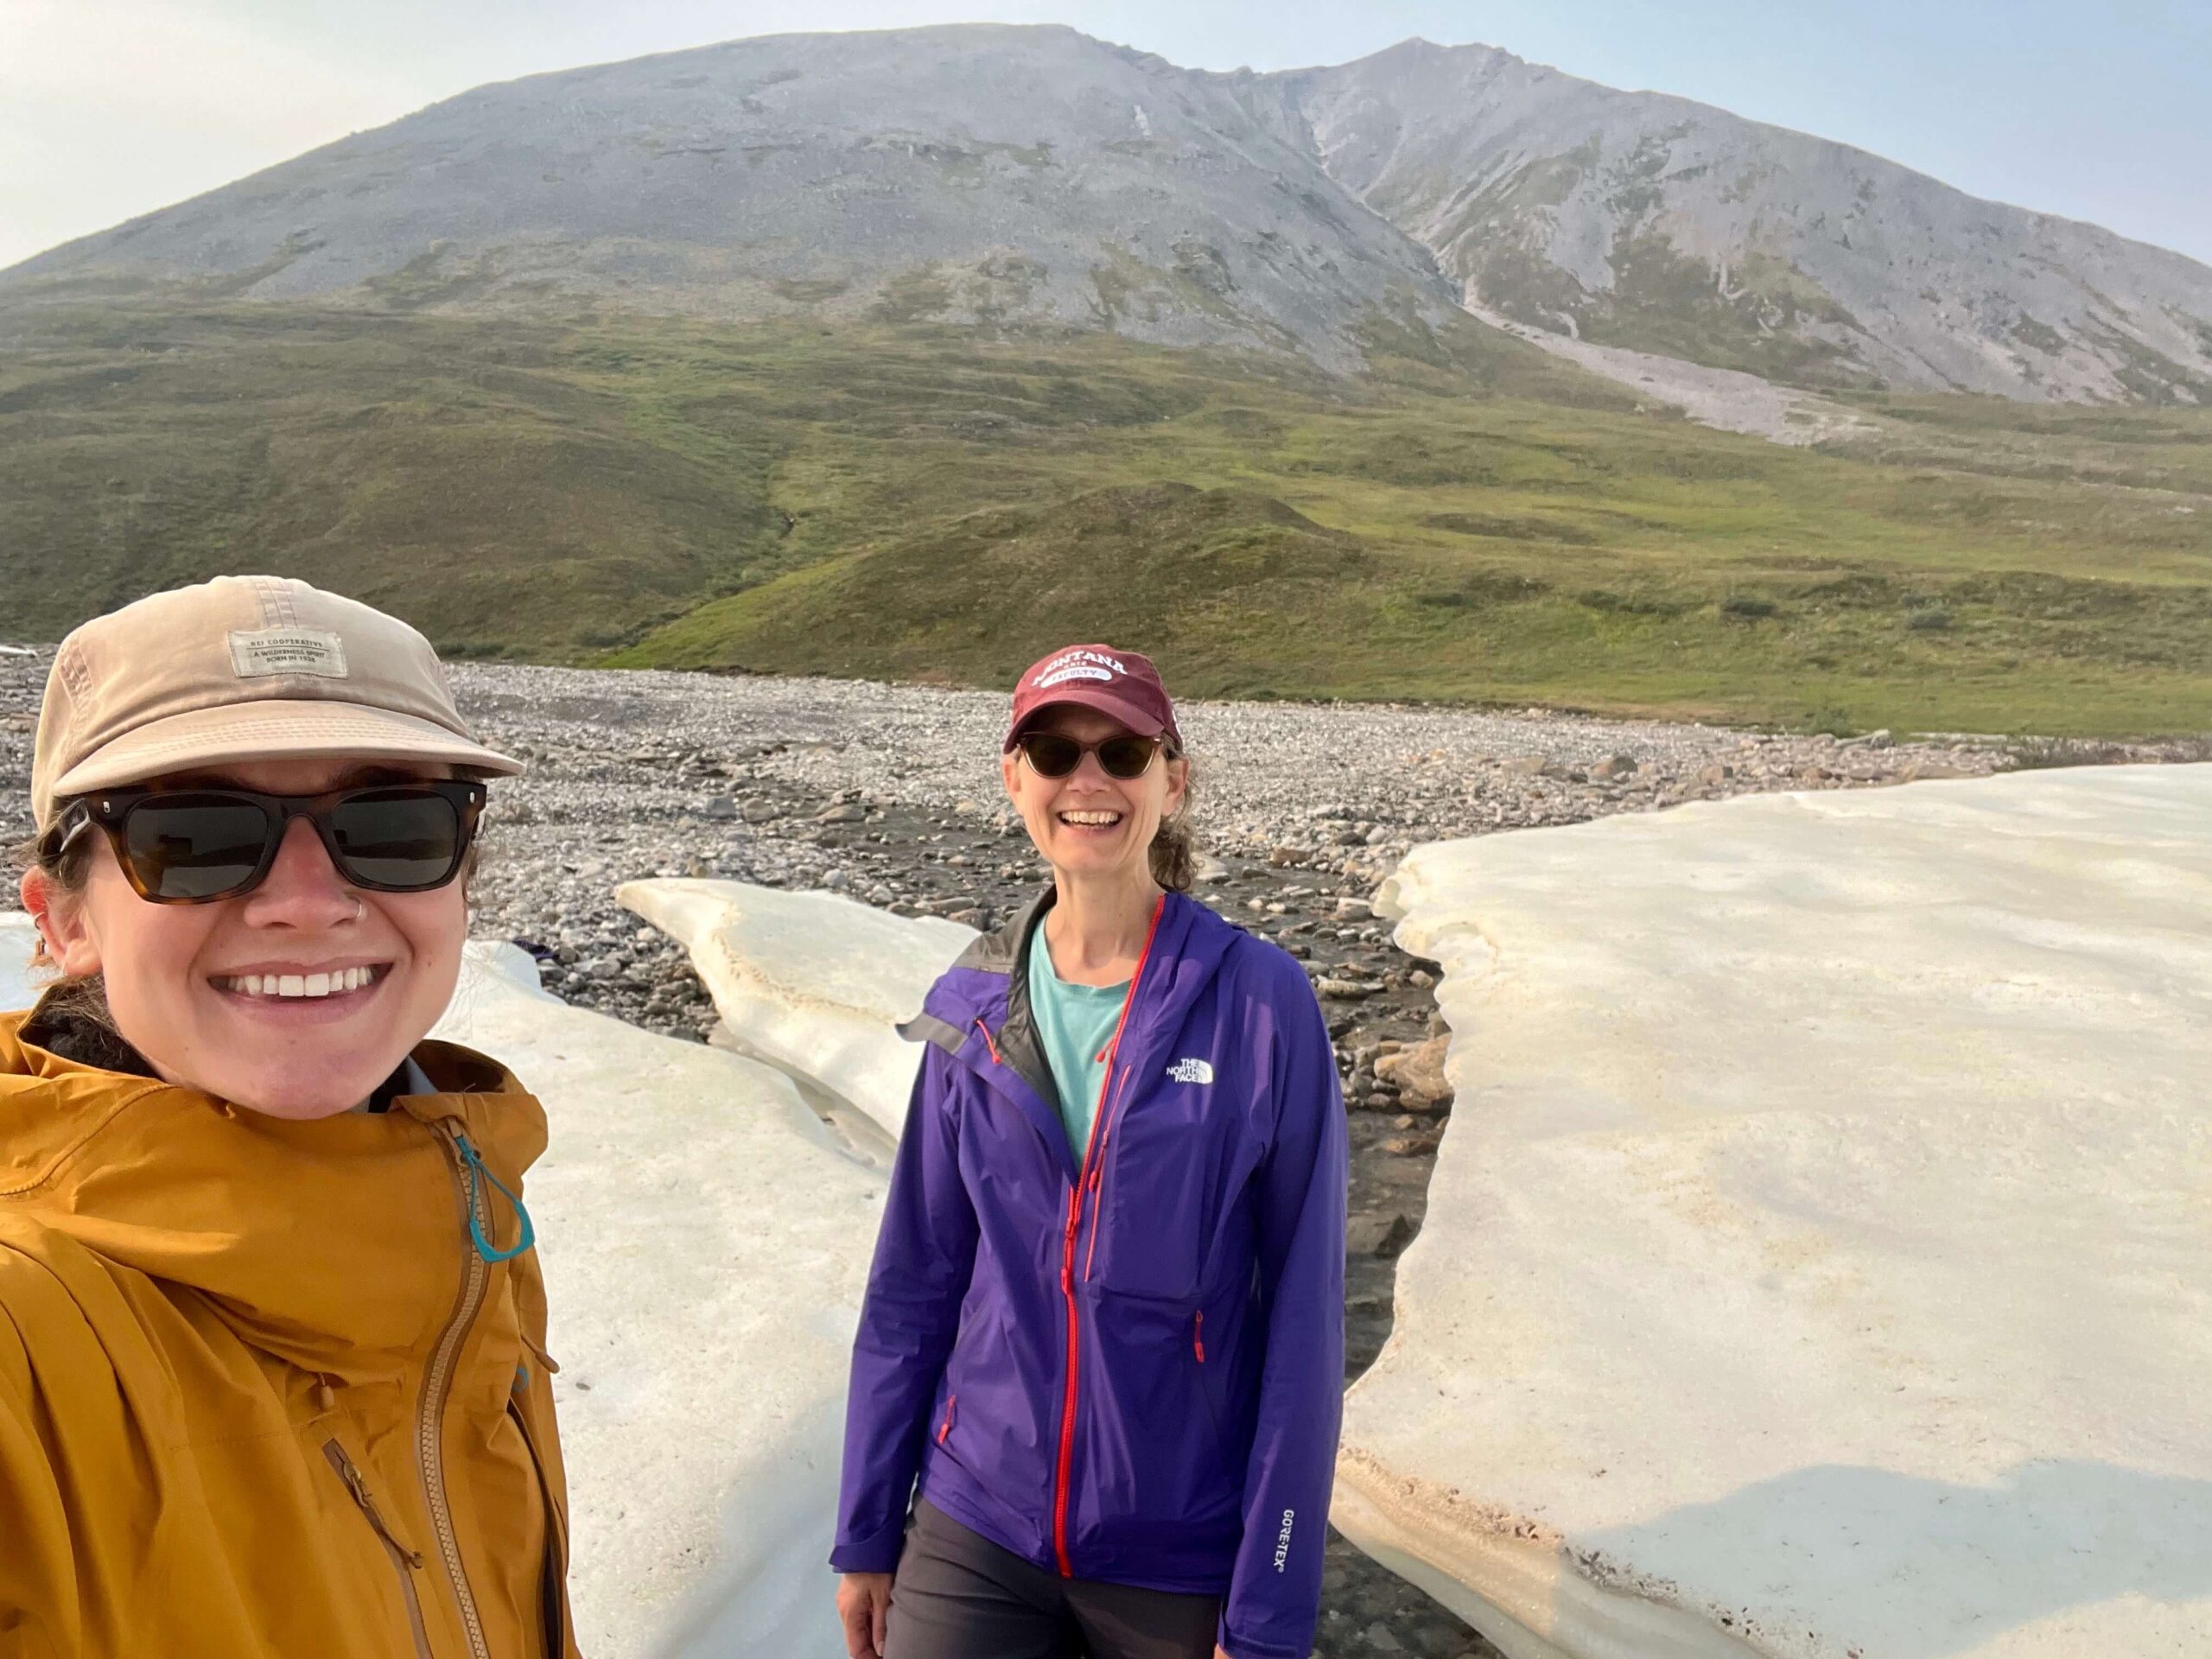
- Jan 27, 2026|Gabbie Rhodes|5 min read
Scientists and students at the University of Montana are helping update an archive that’s empowering engineers, communities, and more.
Announcements
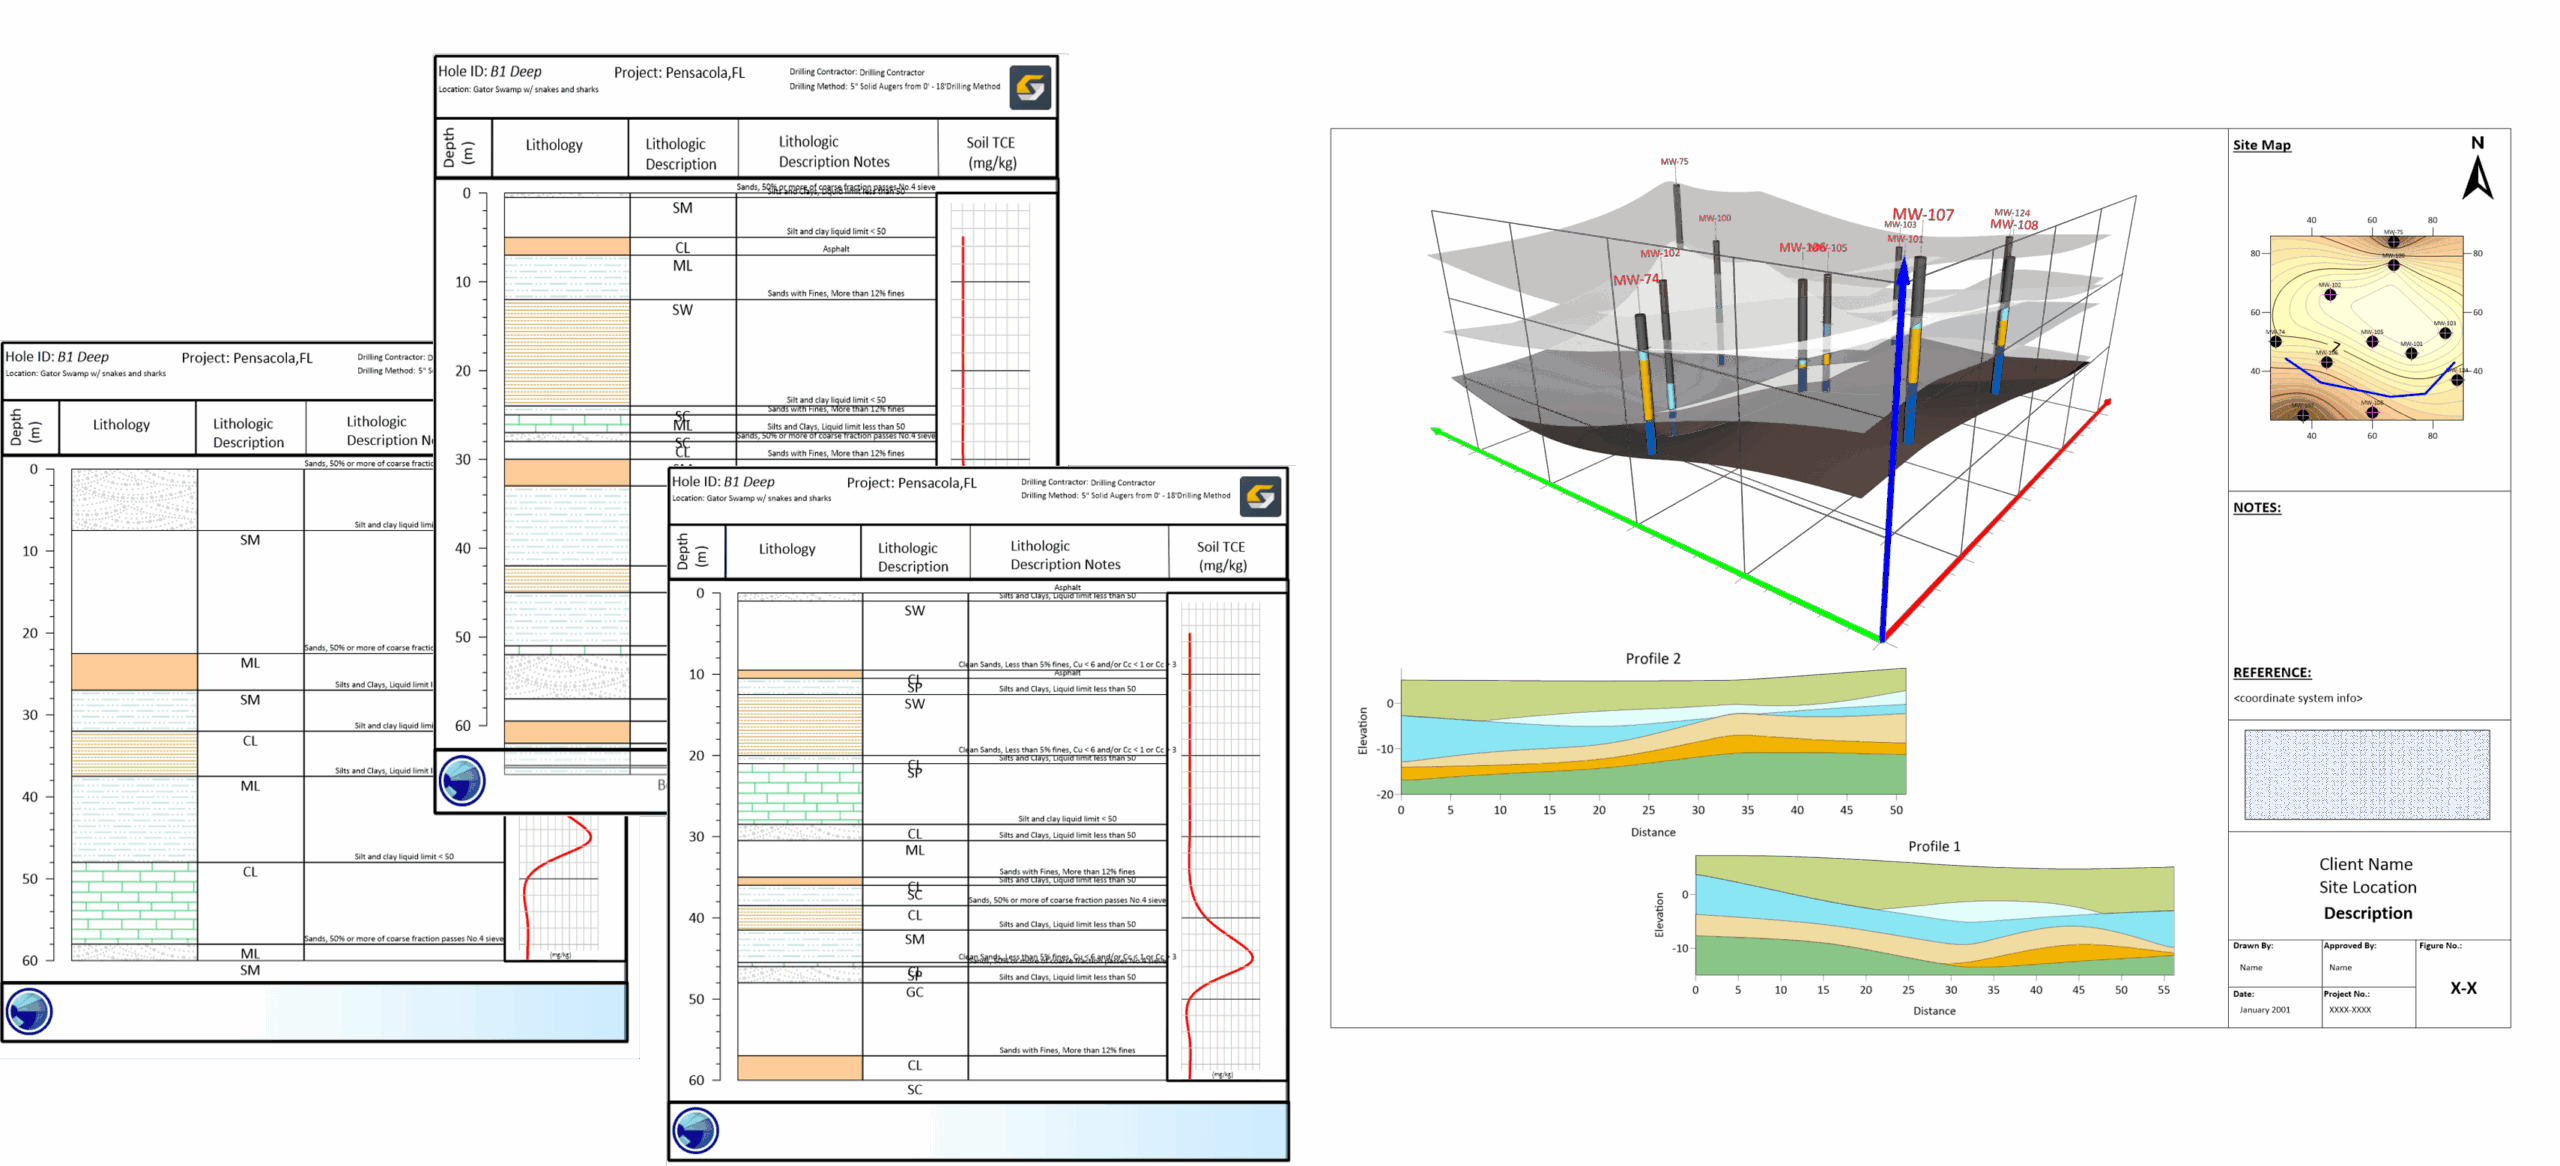
- Mar 20, 2026|Gabbie Rhodes|6 min read
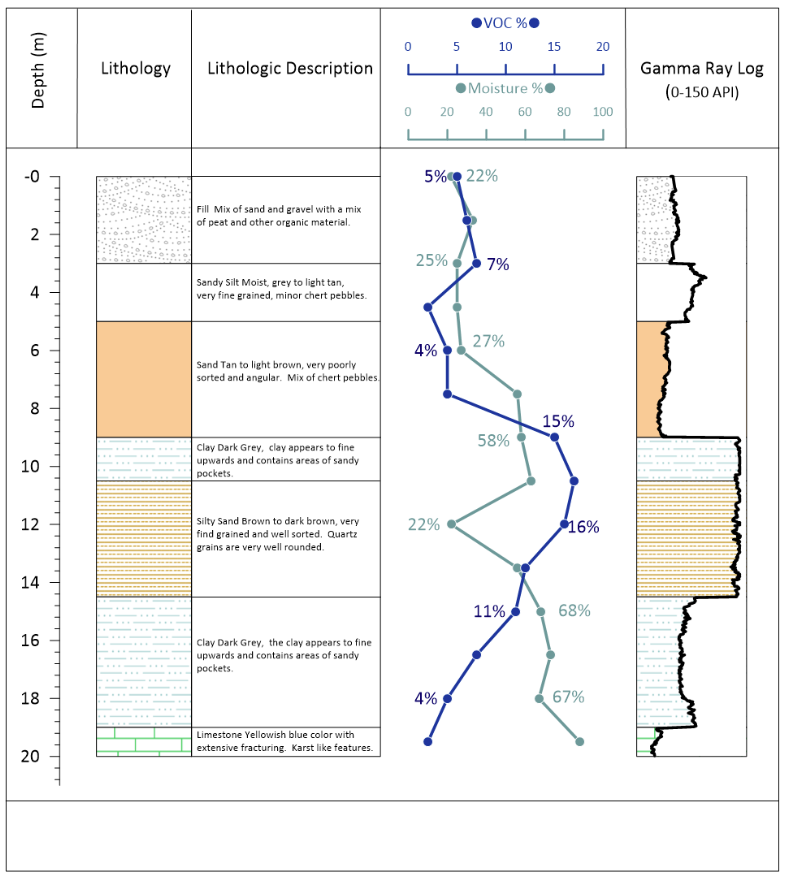
In a recent webinar, Drew Dudley showed how to transform raw borehole data into polished 2D borehole logs and 3D models.
- Mar 10, 2026|Gabbie Rhodes|7 min read
The latest version of Surfer is available and packed with features to boost the clarity of your visuals and communication, while enhancing efficiency.
Resource Exploration
- Mar 4, 2026|Gabbie Rhodes|7 min
Designing boreholes can be time consuming and difficult. Fortunately, there's a way to boost efficiency and visual quality when visualizing boreholes.
- Feb 25, 2026|Gabbie Rhodes|3 min
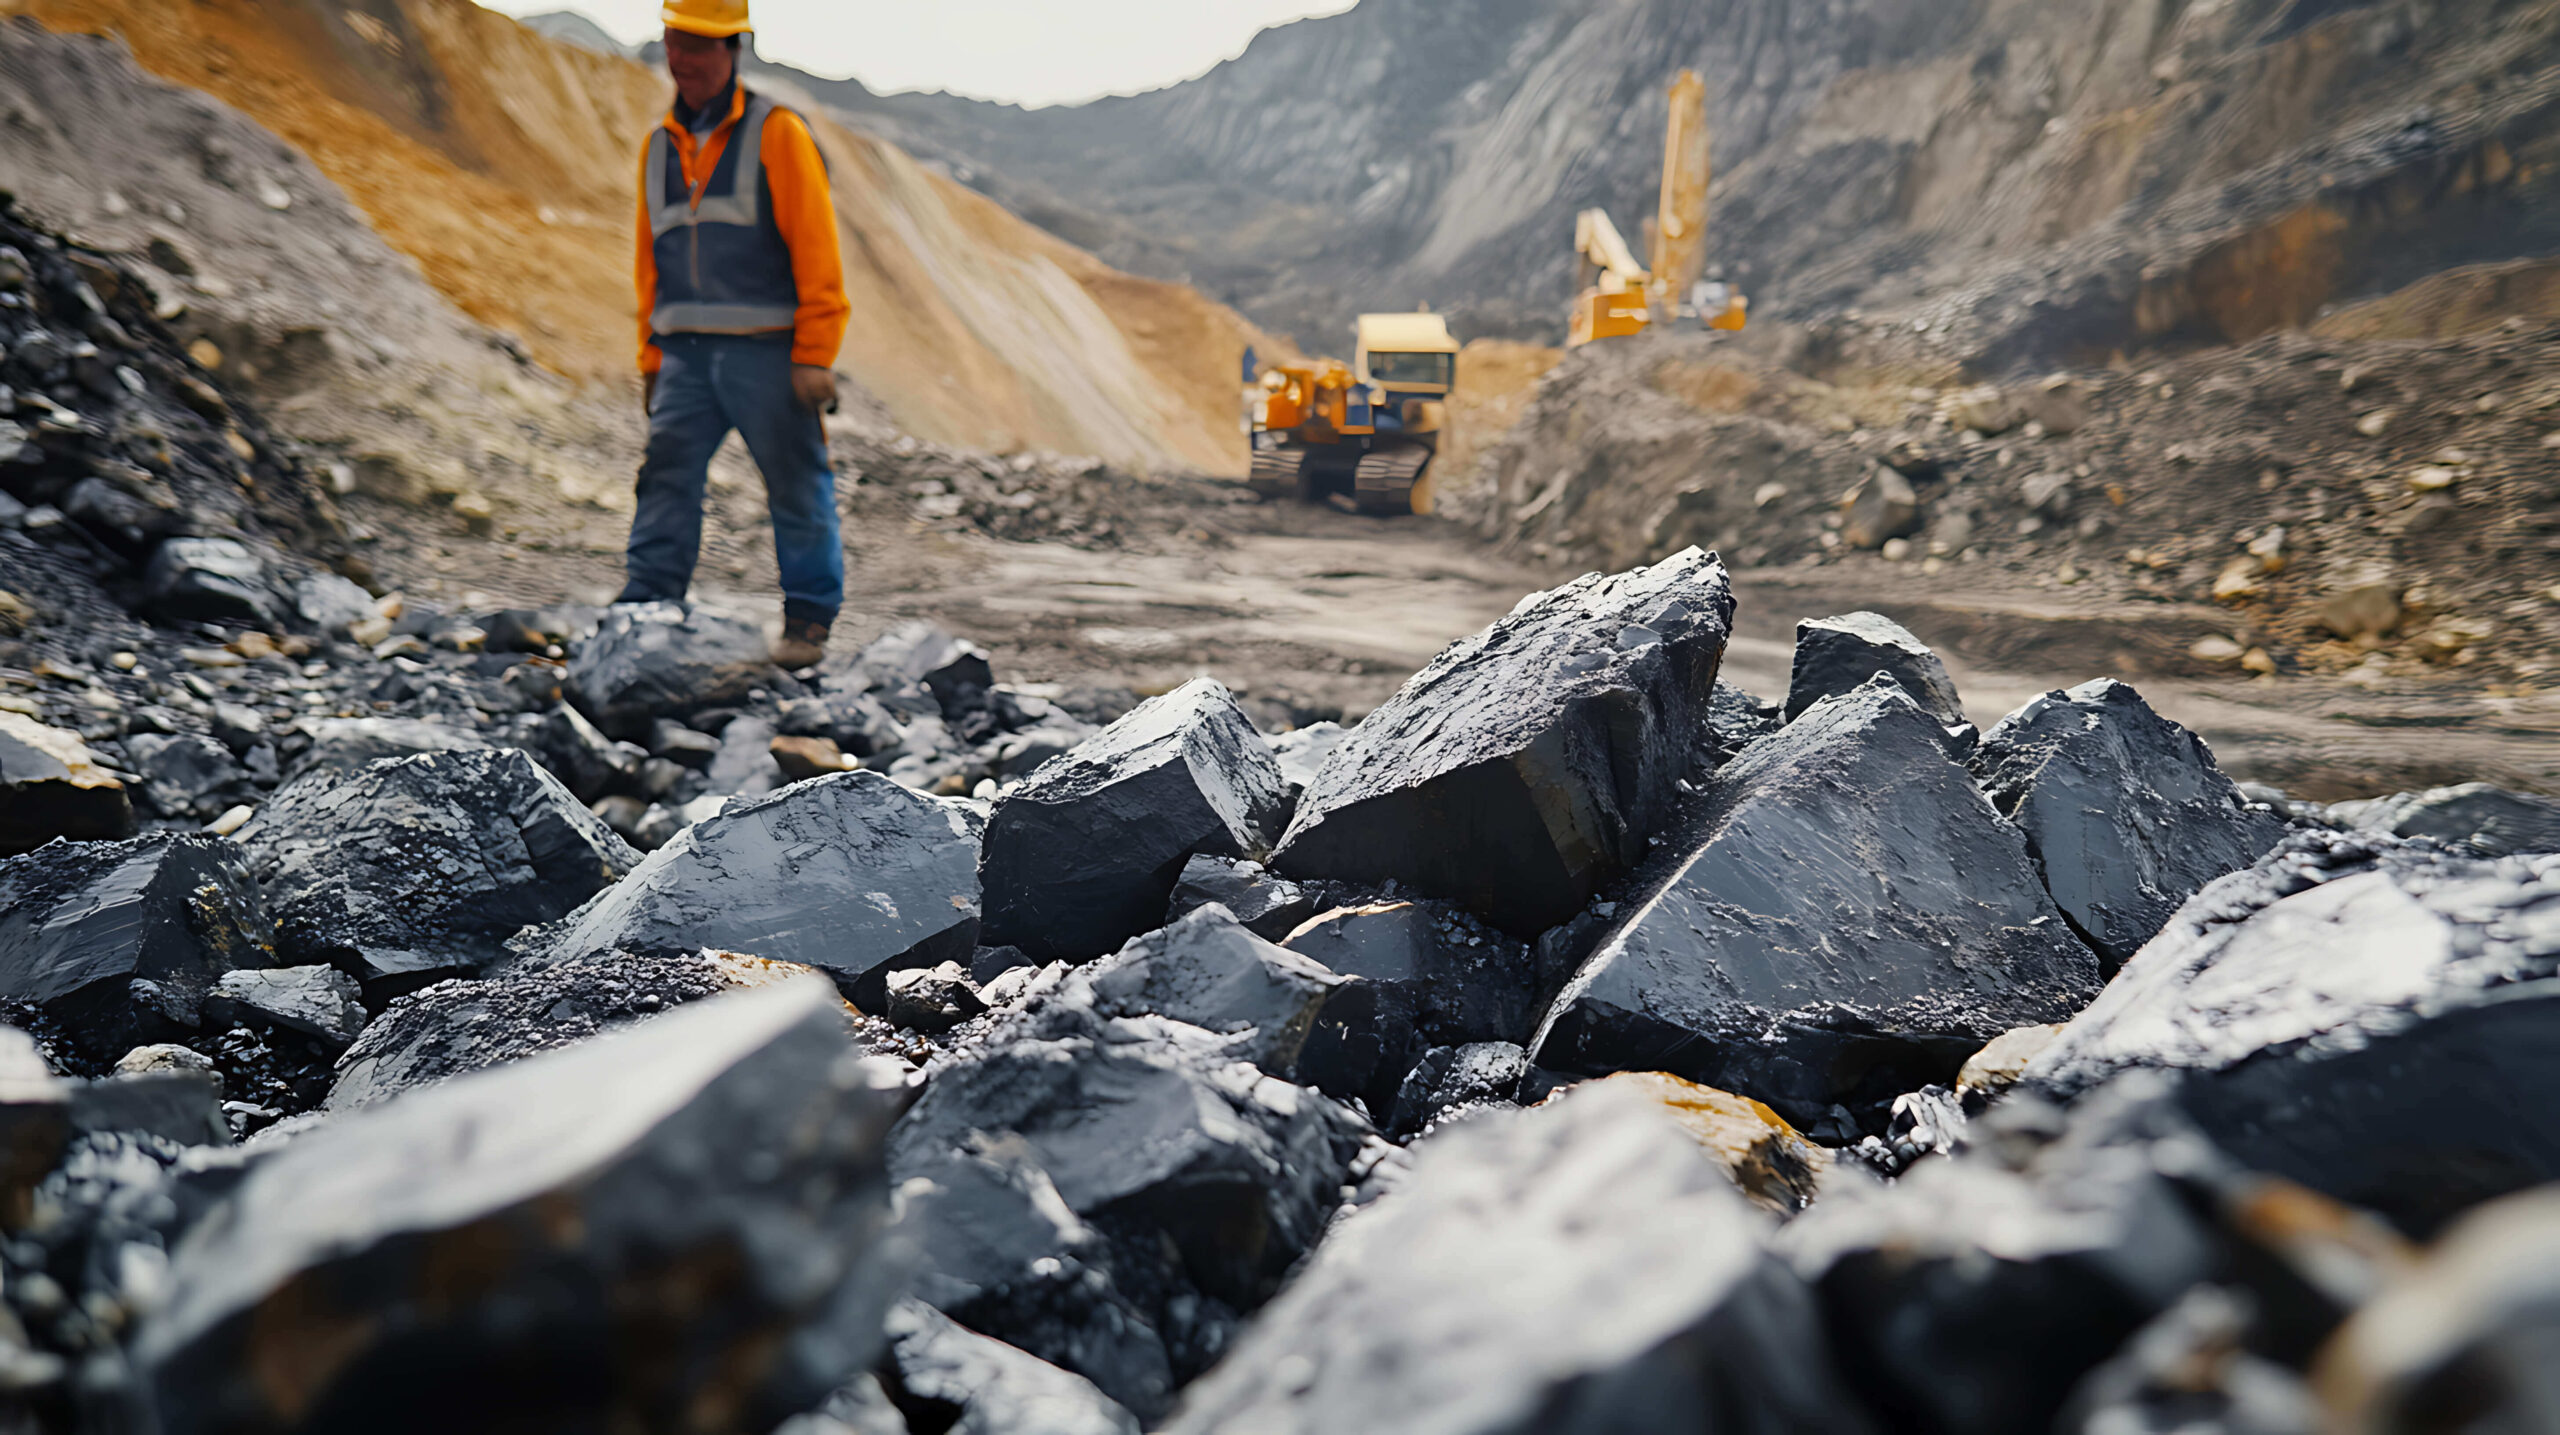
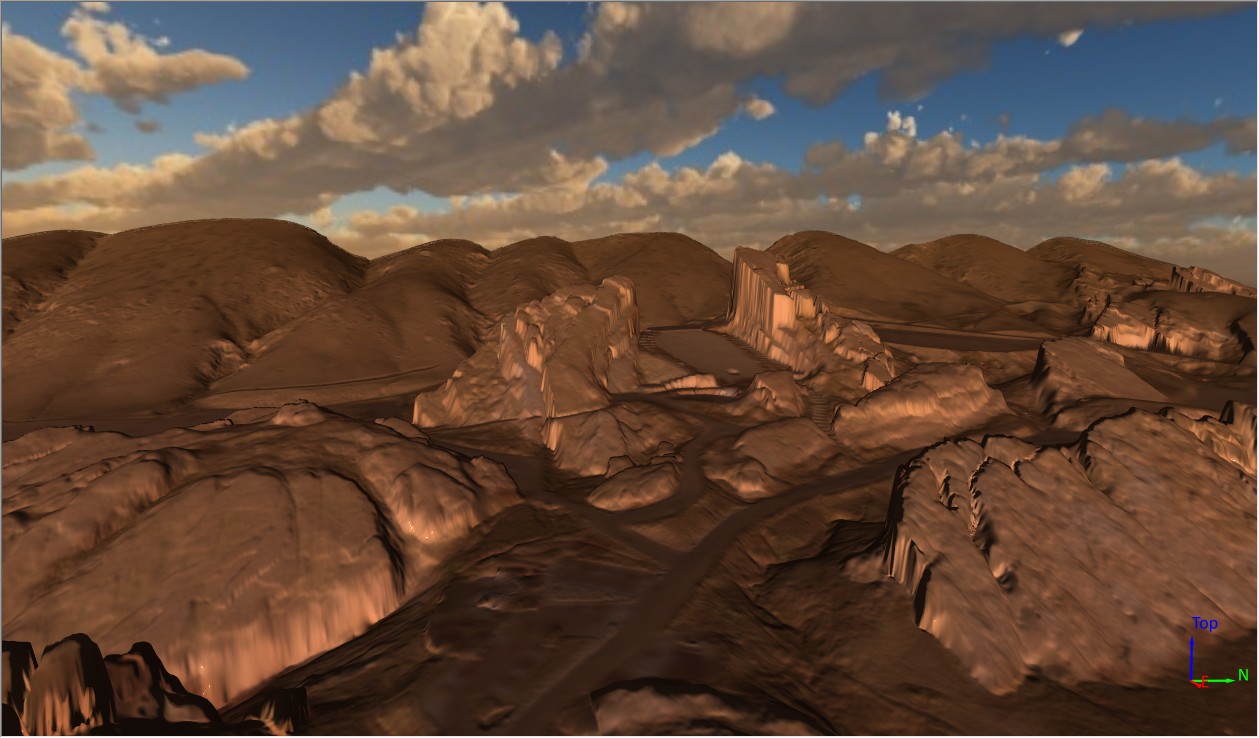
You work with geophysical surveys, core samples, and more. To make sense of it, learn how 3D is innovating resource exploration.
- Dec 4, 2025|Gabbie Rhodes|5 min
John Andersen is a Senior Geologist with O’Chiese Energy LP. He helps guide drilling decisions using subsurface data. Learn how.
- Oct 21, 2025|Gabbie Rhodes|6 min
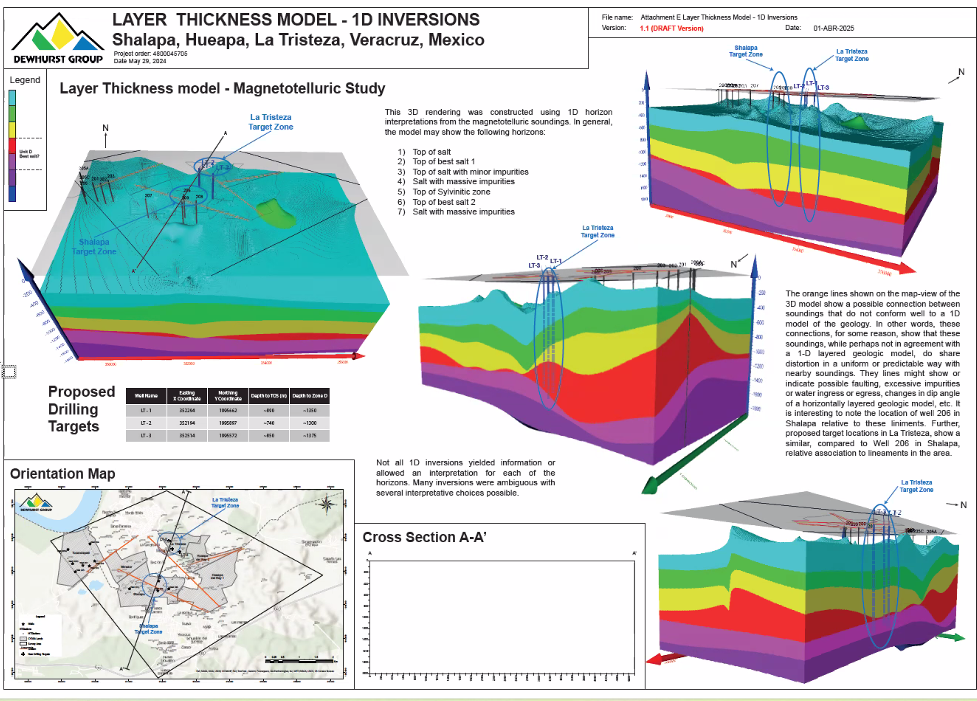
Recently, the Dewhurst Group had to take an untraditional data analysis approach to create a monster map that visualized pure salt in Mexico.