How Point Cloud Layers Are Helping Showcase Insights Efficiently & Clearly
More than ever before, professionals are turning to drones equipped with LiDAR sensors to gather high-resolution data. But collecting LiDAR data is just one part of the equation — visualizing it effectively is another. To do it well, you need to use a point cloud layer in Surfer, but if that’s something you’ve never created before, don’t worry. This article is here to help!
Why LiDAR Data is Becoming Increasingly Popular
First, let’s set the stage. Why is LiDAR even becoming popular? The answer is easy to see when you think about what surveying was like when LiDAR wasn’t around. Before it existed, you had to walk an entire site with a GPS unit, gathering data points one by one. This process was not only time-consuming but also physically demanding and resulted in limited data coverage. It was nearly impossible to capture every small elevation change or subtle geological feature, leading to visualizations that met project needs while still leaving much more to be desired.
Now, thanks to LiDAR-equipped drones, surveying and data visualization have both been revolutionized. Instead of spending days, weeks, or months gathering elevation data, you can fly a drone over a site in minutes to collect millions of data points. These high-resolution scans can lead to dense, detailed representations of terrain far beyond what traditional survey methods could ever achieve. On top of that, LiDAR data also ensures a high level of accuracy. Since its sensors can penetrate through vegetation, they can reveal hidden landforms, such as fault lines, sinkholes, and subtle elevation changes that might have gone unnoticed in manual surveys. This level of precision can be crucial for geological mapping, environmental monitoring, resource exploration, and much more, which is why more people are utilizing LiDAR data for their projects.
The Best Way to Visualize Lidar Data: Point Cloud Layers
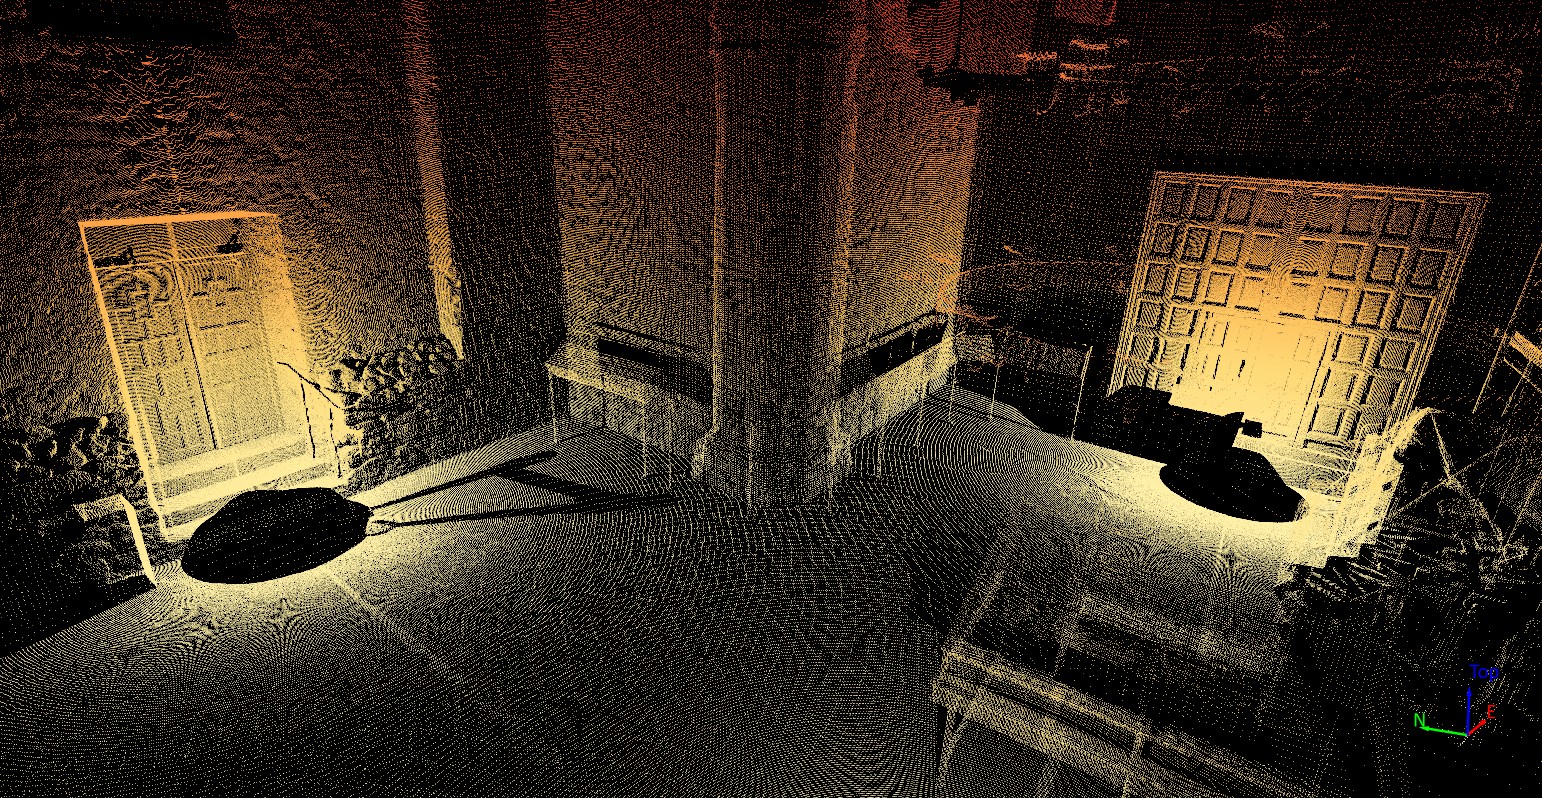
While collecting LiDAR data is becoming increasingly popular, you have to bring it to life somehow. A great path to doing so is with a point cloud layer in Surfer— a powerful way to view and process millions of data points effortlessly.
Surfer’s point cloud layer makes working with LiDAR data simple and efficient. One of its biggest advantages is its ability to handle many LAS or LAZ files at once. You can import multiple datasets—whether five files or ten—and merge them together to create a single point cloud layer. This eliminates any hassles you may experience when dealing with separate files while allowing for seamless analysis across an entire dataset.
Another major benefit? You can refine your LiDAR data by filtering it upon import. That way, your point cloud layer only highlights the most important information for stakeholders. For example, you can decide to only showcase buildings, railroads, and vegetation. You can also filter by return type, meaning you can choose to include only every Nth value in your point cloud layer, ensuring your visual illustrates the most critical data so decision-makers aren’t overwhelmed.
The final big benefit worth noting is that you can create a grid from a point cloud layer quickly and simply. With just a click of a button, your grid can appear in seconds, and it doesn’t matter if you have a large dataset.
Industries Primed to Benefit from LiDAR—and Point Cloud Layers
So, what industries may find it most beneficial to visualize their LiDAR data using a point cloud layer in Surfer? Given the various real-world applications of LiDAR data, professionals across many industries can transform dense datasets into clear, actionable insights. Here’s a look at just some of the top fields where point cloud layers can make a big impact in bringing LiDAR data to life:
1. Environmental Science
Environmental scientists use LiDAR data for multiple reasons, including understanding subtle terrain changes—they can analyze slopes, elevation, and contours that are essential for everything from land use planning to assessments. And if environmental scientists bring their LiDAR datasets into Surfer as point cloud layers, they can efficiently filter, grid, visualize, and interpret their datasets, resulting in faster, more accurate insights to guide decision-making.
2. Urban Planning
One of the best things about LiDAR is that it helps city planners and developers understand the current urban layout and determine future changes. By visualizing buildings, road networks, and vegetation, professionals in this industry can plan for infrastructure expansions without ever breaking ground. Using point cloud layers in Surfer can also equip planners to isolate specific elements like buildings or trees, enhancing the design and review process.
3. Infrastructure Design and Construction
From roads to bridges, LiDAR data equips civil engineers to identify the most viable paths for new development. Point cloud layers can fit into this process by helping visualize data so it’s easier to assess ground conditions in detail, helping avoid obstacles, reducing excavation costs, and designing safer, more efficient routes. Whether it’s filtering or return-type analysis, Surfer simplifies the process so teams can plan effectively, stay on schedule, and budget.
4. Disaster Management and Response
LiDAR data can make a significant difference in preparing communities for challenges. Emergency managers can use it to build detailed visualizations of terrain that support early warning systems and evacuation planning. With Surfer’s point cloud layers, teams can also visualize and analyze elevation data to predict flood zones and improve emergency response—a critical advantage in areas prone to severe weather changes or rapid flooding.
5. Archaeology
Archaeologists are increasingly embracing LiDAR technology to uncover the past—literally. Because LiDAR can penetrate dense vegetation, it’s uniquely suited to revealing what lies beneath forest canopies, including hidden structures, roads, and settlement patterns long lost to time. In Surfer, point cloud layers can make it easy to filter out vegetation and focus on ground-level features, equipping archaeologists to visualize lost ruins and landscapes with remarkable clarity. This opens the door to discovering and mapping ancient civilizations in remote or overgrown areas, all without disturbing the ground.
Bringing LiDAR Data to Life with Surfer’s Point Cloud Layers
LiDAR is transforming how to analyze and interpret terrain data, but the ability to visualize it effectively is just as important as collecting it. By leveraging point cloud layers in Surfer, you can take raw LiDAR data and turn it into highly detailed visualizations that highlight critical surface features. Whether you need to merge large datasets, filter unnecessary points, or quickly generate a grid to get the final output you need, Surfer provides a simple yet powerful way to process and showcase LiDAR datasets.
If you’re ready to take advantage of Surfer’s point cloud layers for your own LiDAR data, try it for yourself. Download a free 14-day free trial of Surfer to start transforming raw LiDAR data into insightful visualizations.