Should You Use 3D View or 3D Surface Maps? Here’s the Definitive Answer
For years, you may have relied on 3D surface maps to represent elevation, topography, and subsurface features. And it makes sense—3D surface maps have been around for a long time, becoming an industry standard simply because they existed before more advanced 3D visualization features. However, just because something is widely used and the traditional option doesn’t mean it’s the best option.
With the introduction of 3D View in Surfer, you now have access to a more dynamic and interactive way to explore and visualize your data. Unlike traditional 3D surface maps, which display a simplified, static representation, 3D View equips you to do much more, including experiencing full rotation, zooming in and out, and uniquely interacting with your dataset, making it easier to interpret complex spatial relationships. So, if you’re still using 3D surface maps as a go-to visualization, it might be time to rethink your approach.
The Limitations of 3D Surface Maps
Now, we won’t lie and say 3D surface maps are void of any advantages. They can be effective in a couple of ways, but they still come with significant drawbacks that limit how much insight you can actually gain from your data. To put these limitations into perspective, let’s take a closer look at a 3D surface map created in Surfer’s 2D View. This example will highlight exactly where this type of visualization falls short and why it may not be the best choice for modern geological analysis.
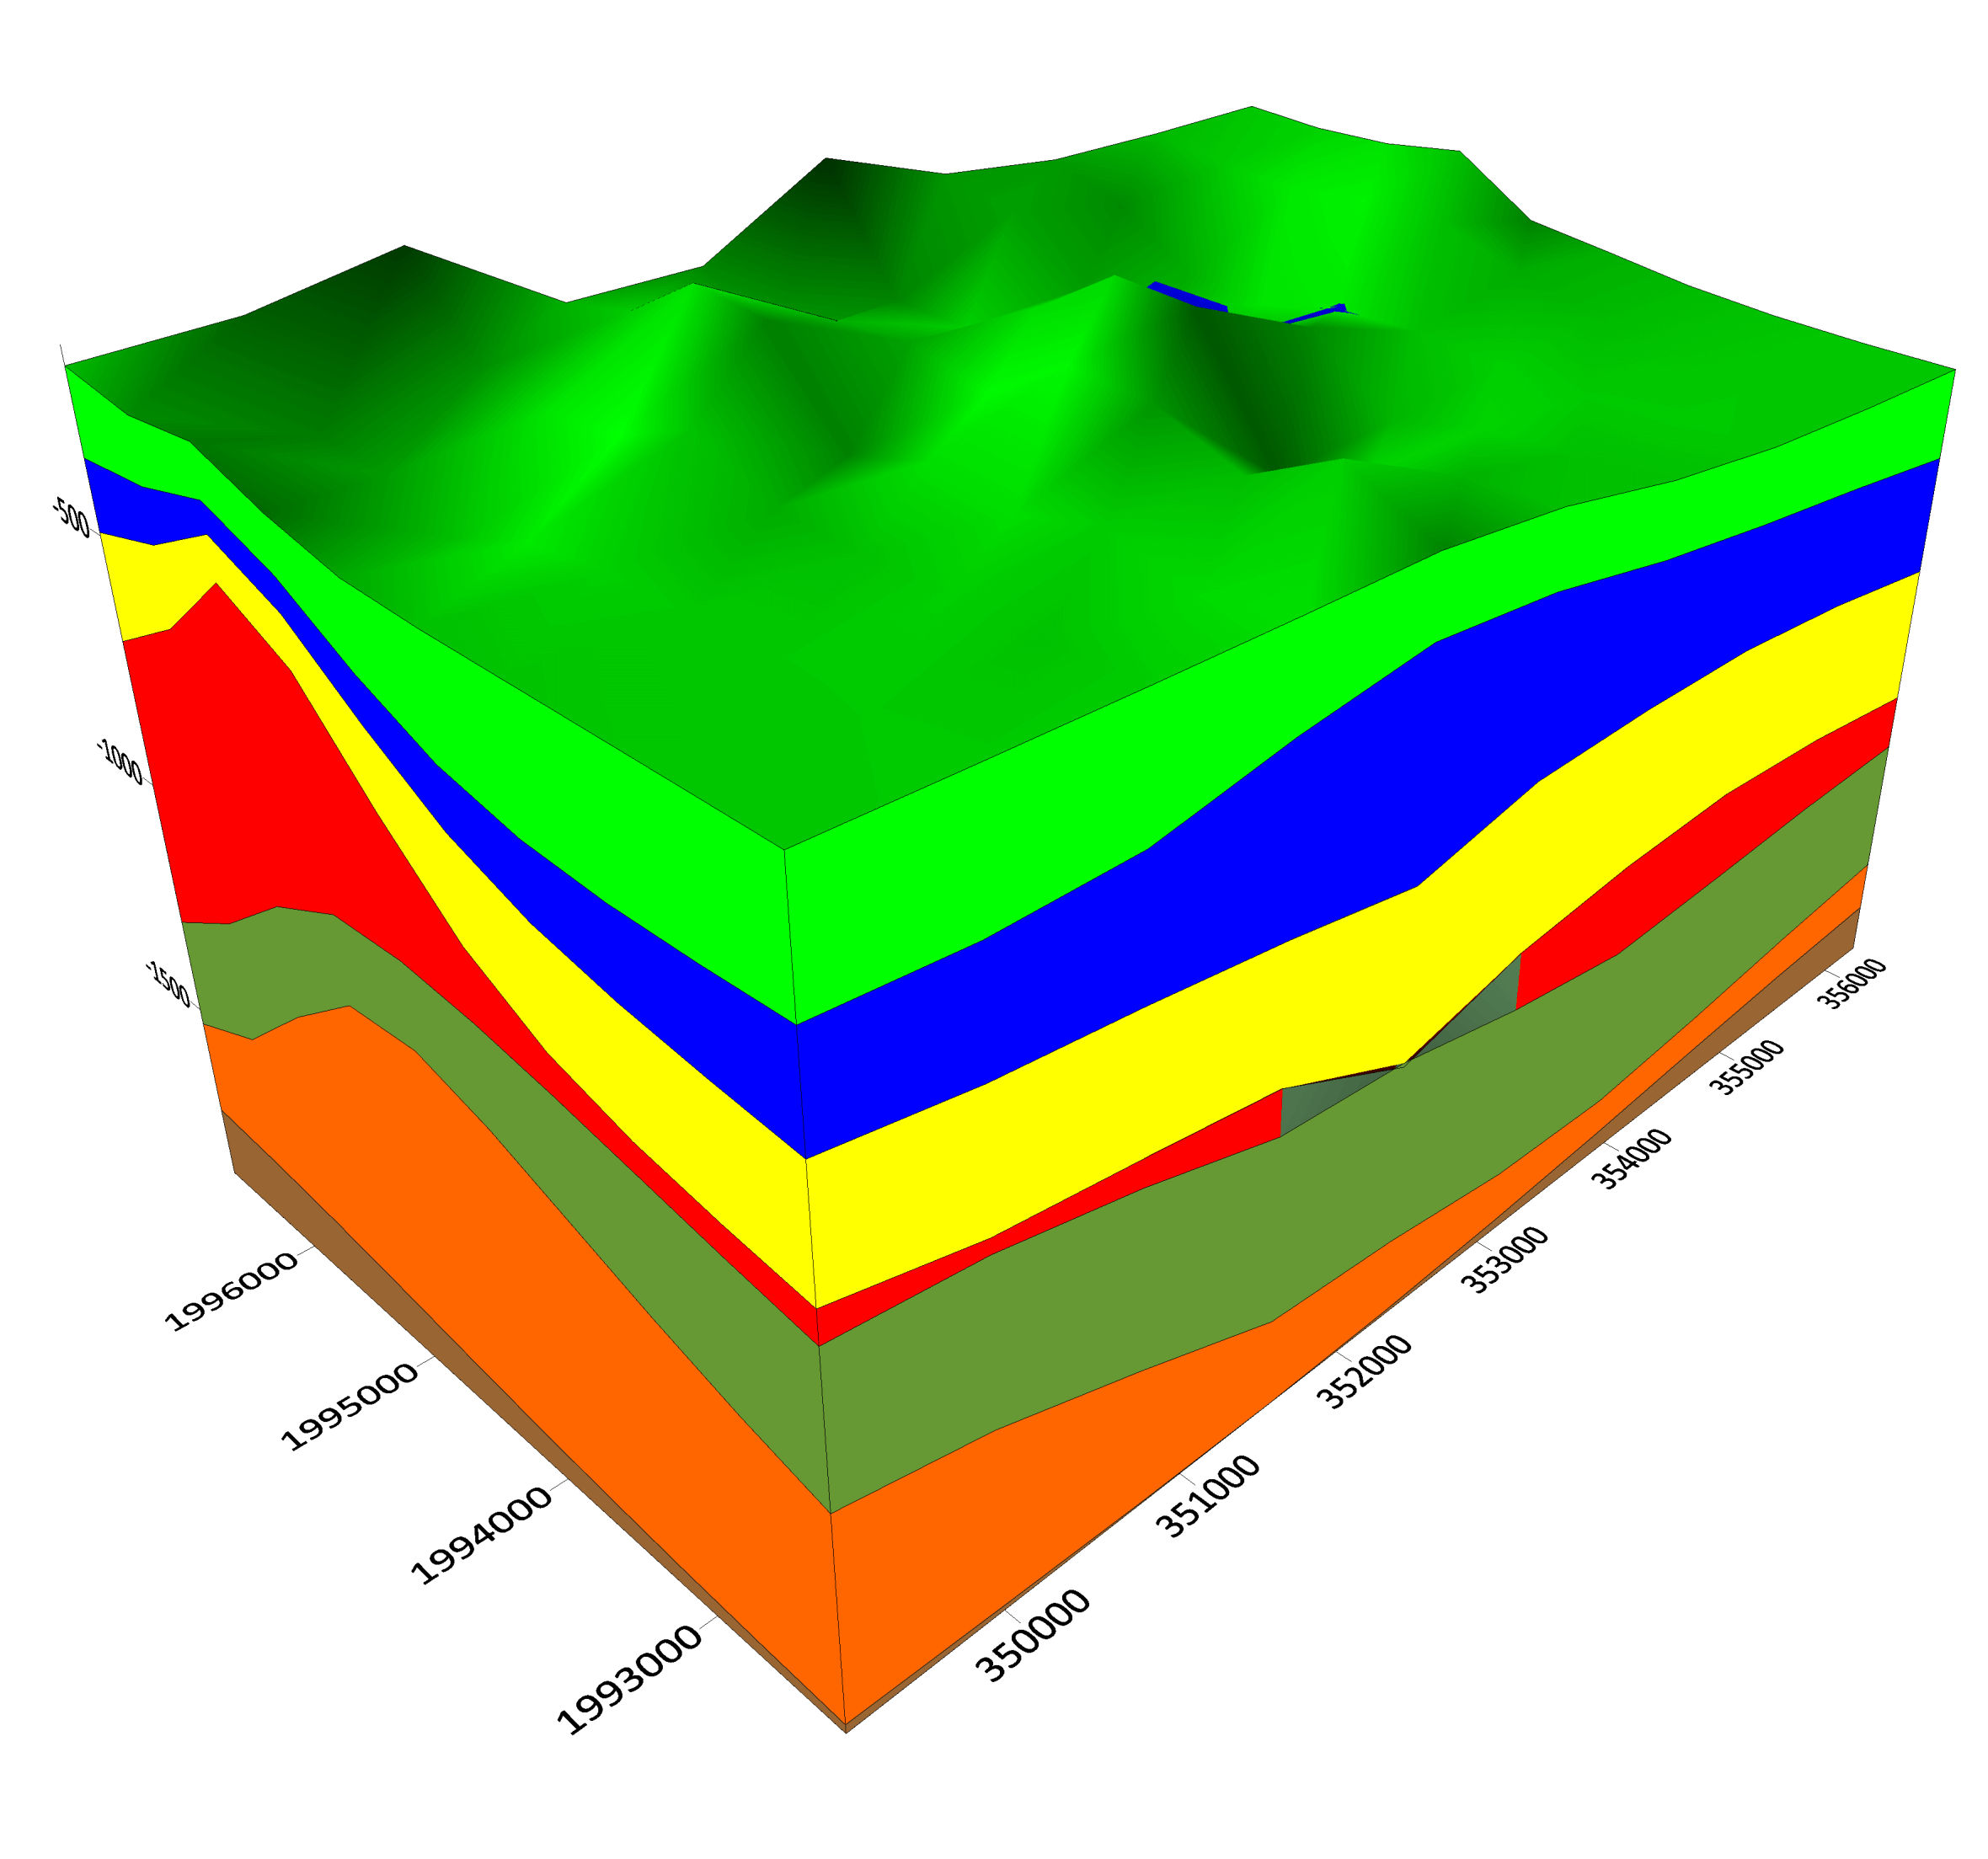
Stacked Layers in a 3D Surface Map
This visualization is a 3D surface map that contains multiple stacked layers. Each layer represents a different geological stratum, stacked on top of one another to create a block-like representation of the subsurface. While this might seem like a useful way to showcase layers, there are several issues:
- Lack of Rotation Capability – You can rotate the visualization to the left, right, top, or somewhere in between, but you can’t rotate underneath the stack to see what’s happening beneath the layers. This makes it difficult to analyze subsurface features from all angles.
- Rigid Fill-Down Effect – The stacked layers can be filled down to the bottom, creating a more visually complete model. However, this process requires carefully ordering each layer, and it doesn’t allow for flexible data exploration.
- No Coordinate System Support – The biggest issue with 3D surface maps is that they don’t support coordinate systems. This means if you’re working with datasets from different sources, they may not overlay correctly. If your project involves combining multiple datasets with varying spatial references, this can lead to significant misalignment and inaccurate interpretations.
- No Measurement Capabilities – Since there’s no coordinate system assigned, you can’t measure distances within the visualization. Surfer’s measuring tool can’t even be enabled, limits can’t be set, and critical spatial relationships cannot be quantified.
These drawbacks make the stacked-layer 3D surface map more of a static illustration than a truly interactive, three-dimensional visualization.
Why These Limitations Matter
It’s true that 3D surface maps can offer a basic visual representation of terrain and subsurface structures, but this map type still comes with significant constraints. The lack of rotation flexibility, missing coordinate system support, and inability to measure distances make them less effective for in-depth analysis. Fortunately, there’s a better solution: Surfer’s 3D View. By switching from 3D surface maps to 3D View, you can overcome these limitations, unlock more interactive exploration capabilities, and gain a clearer understanding of your data.
Leveling Up With 3D View and Its Many Advantages
3D View takes visualization to the next level, offering everything from enhanced property controls to coordinate system support to greater analytical power. To put all these benefits into greater perspective, let’s walk through seven key advantages of 3D View using two visualizations created in Surfer.
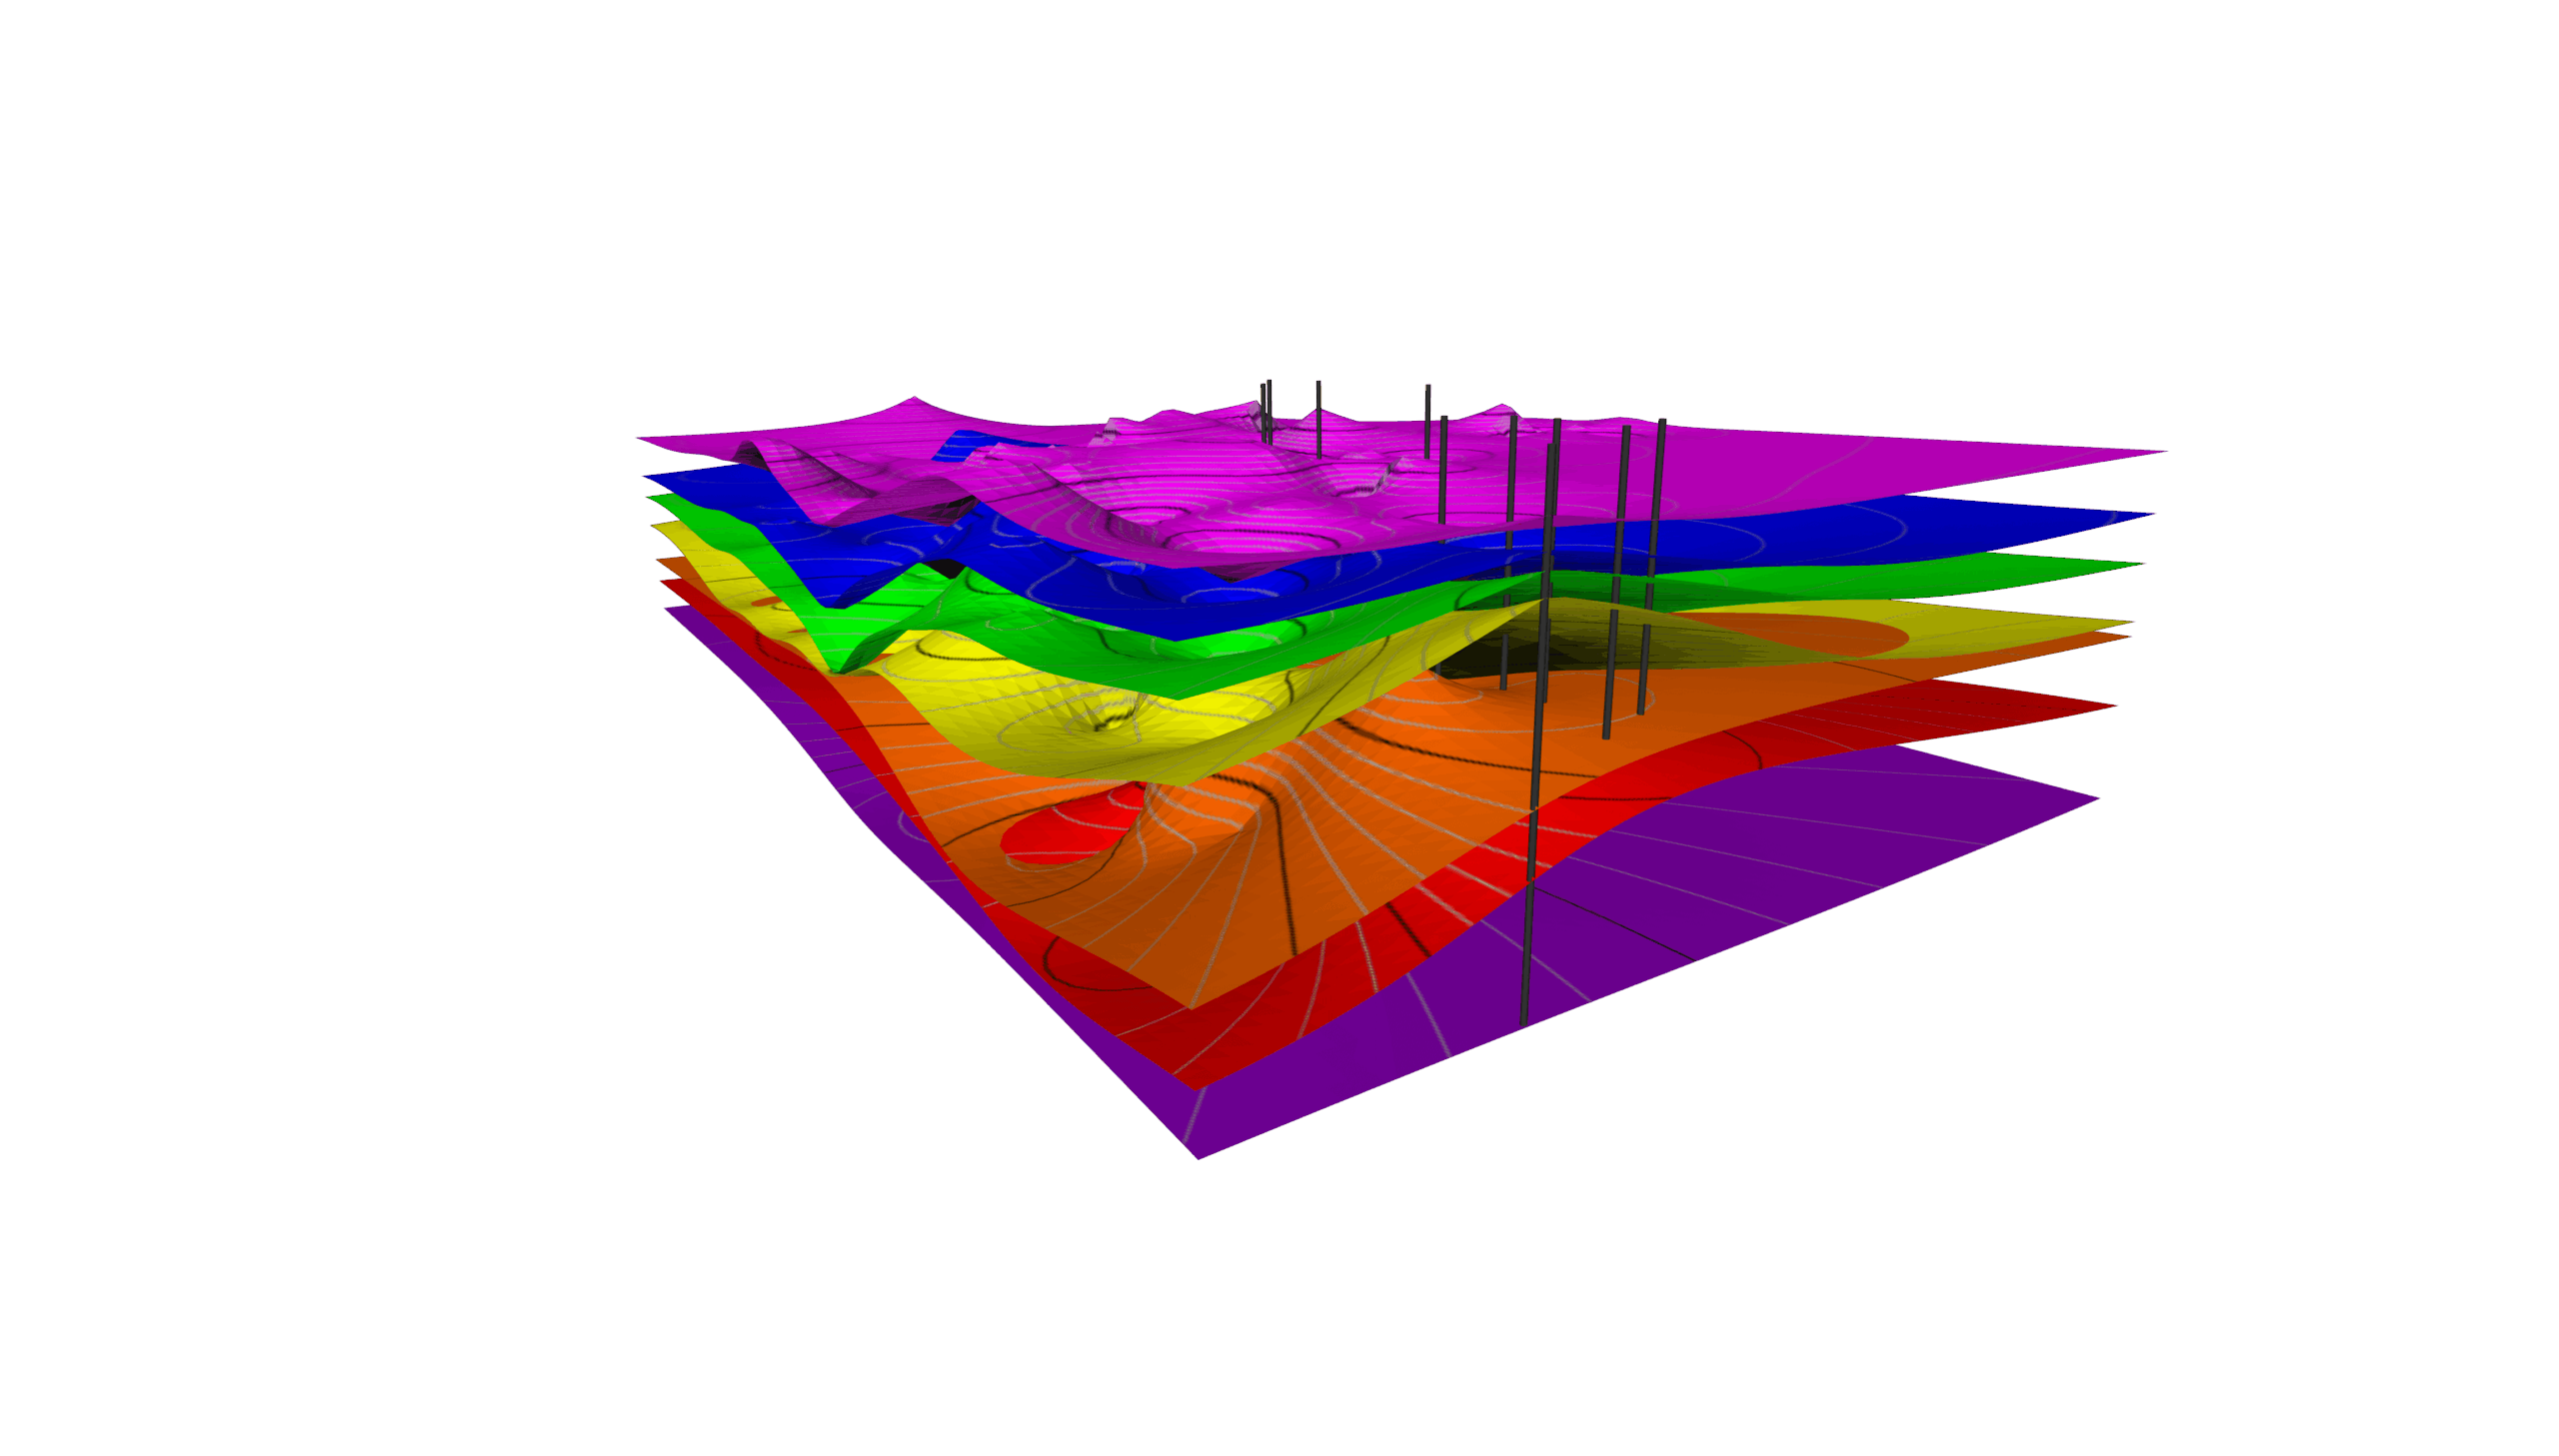
1. Full 3D Rotation: See Every Angle of Your Visualization
With traditional 3D surface maps, rotation is limited—you can only tilt the view at fixed angles. But with 3D View, you have full rotational control. With both visualizations, you can rotate them to see what’s happening at every angle. You can even rotate the view downward to inspect subsurface layers from a unique perspective. The best part? This capability will help you analyze your visualization more closely to ensure you fully grasp your data and the story it’s telling. With the tools to assess your model from every angle, you can ensure you notice critical details and have the understanding you need to present your work effectively to stakeholders so they make informed decisions.
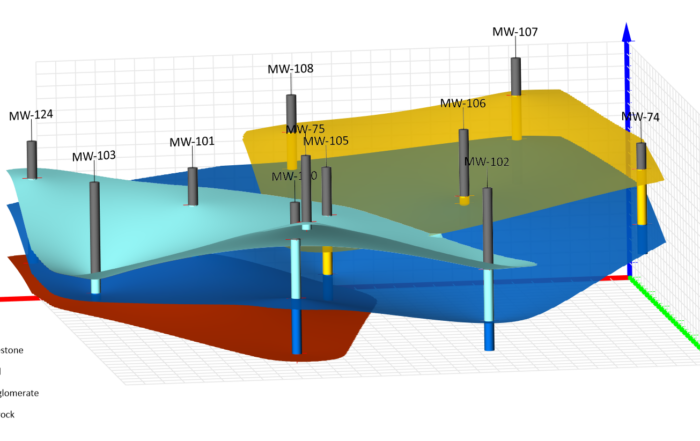
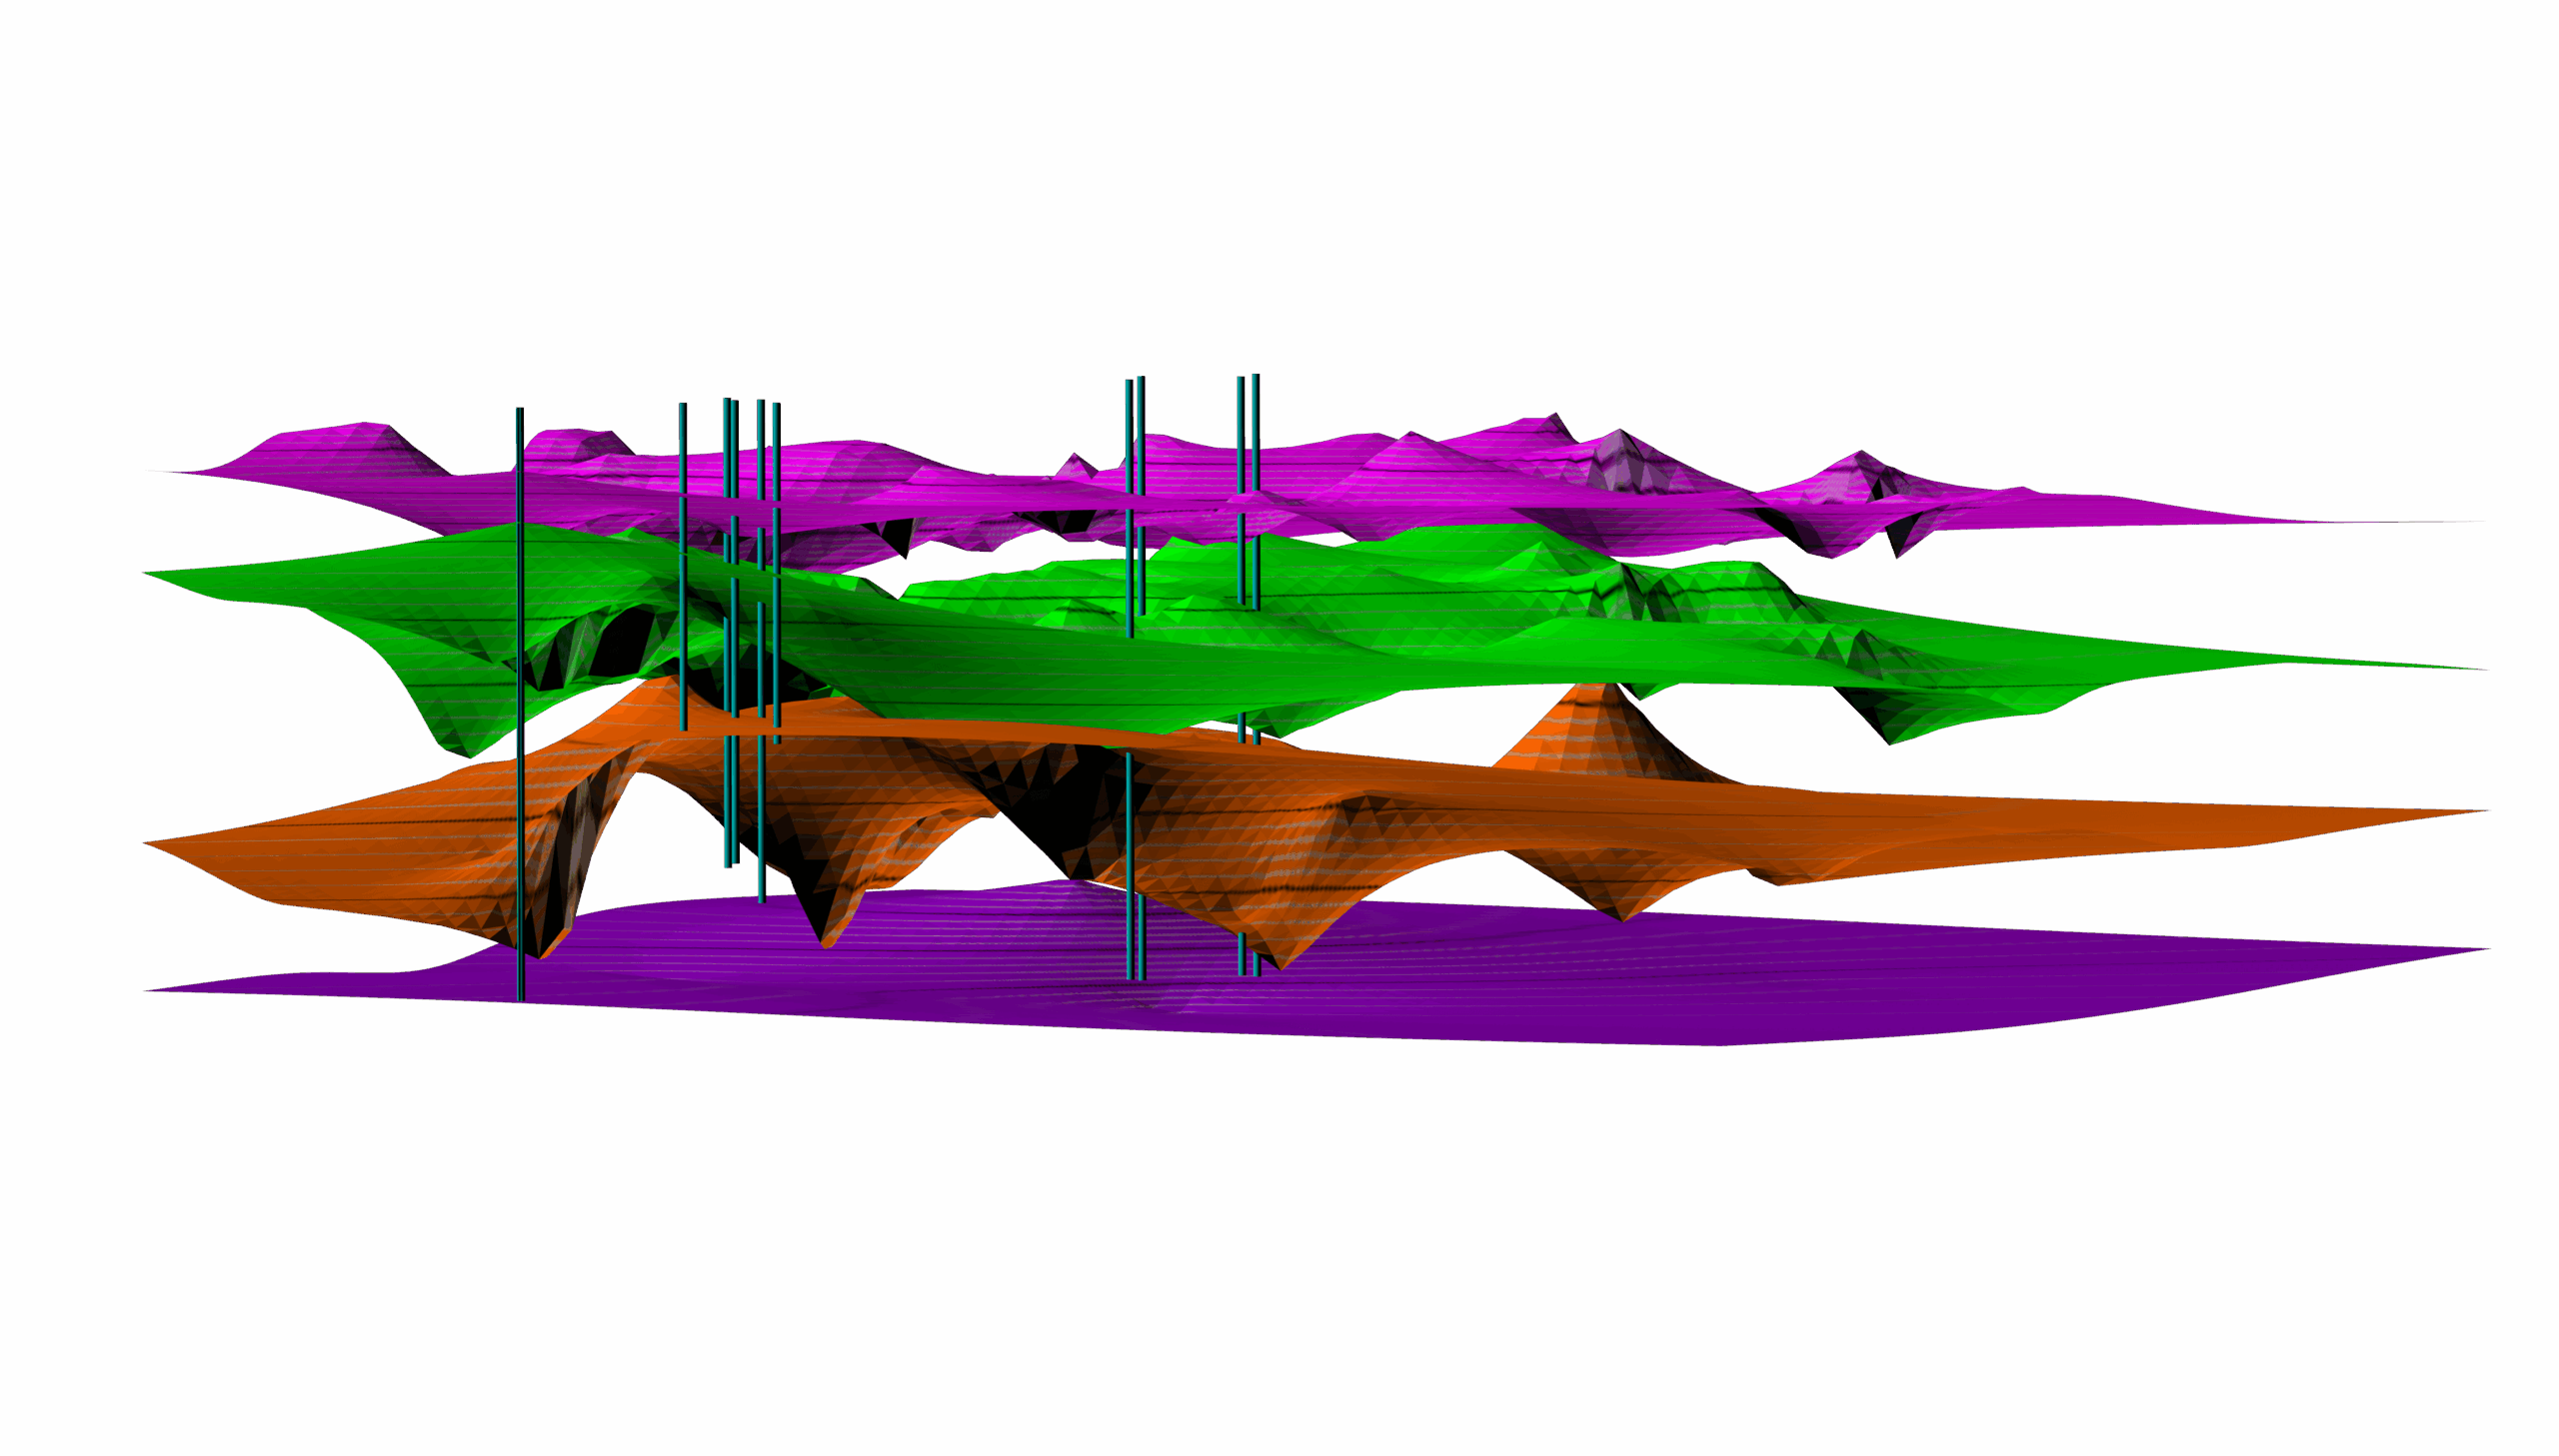
2. Greater Design Capabilities: Bring Drillholes to Life
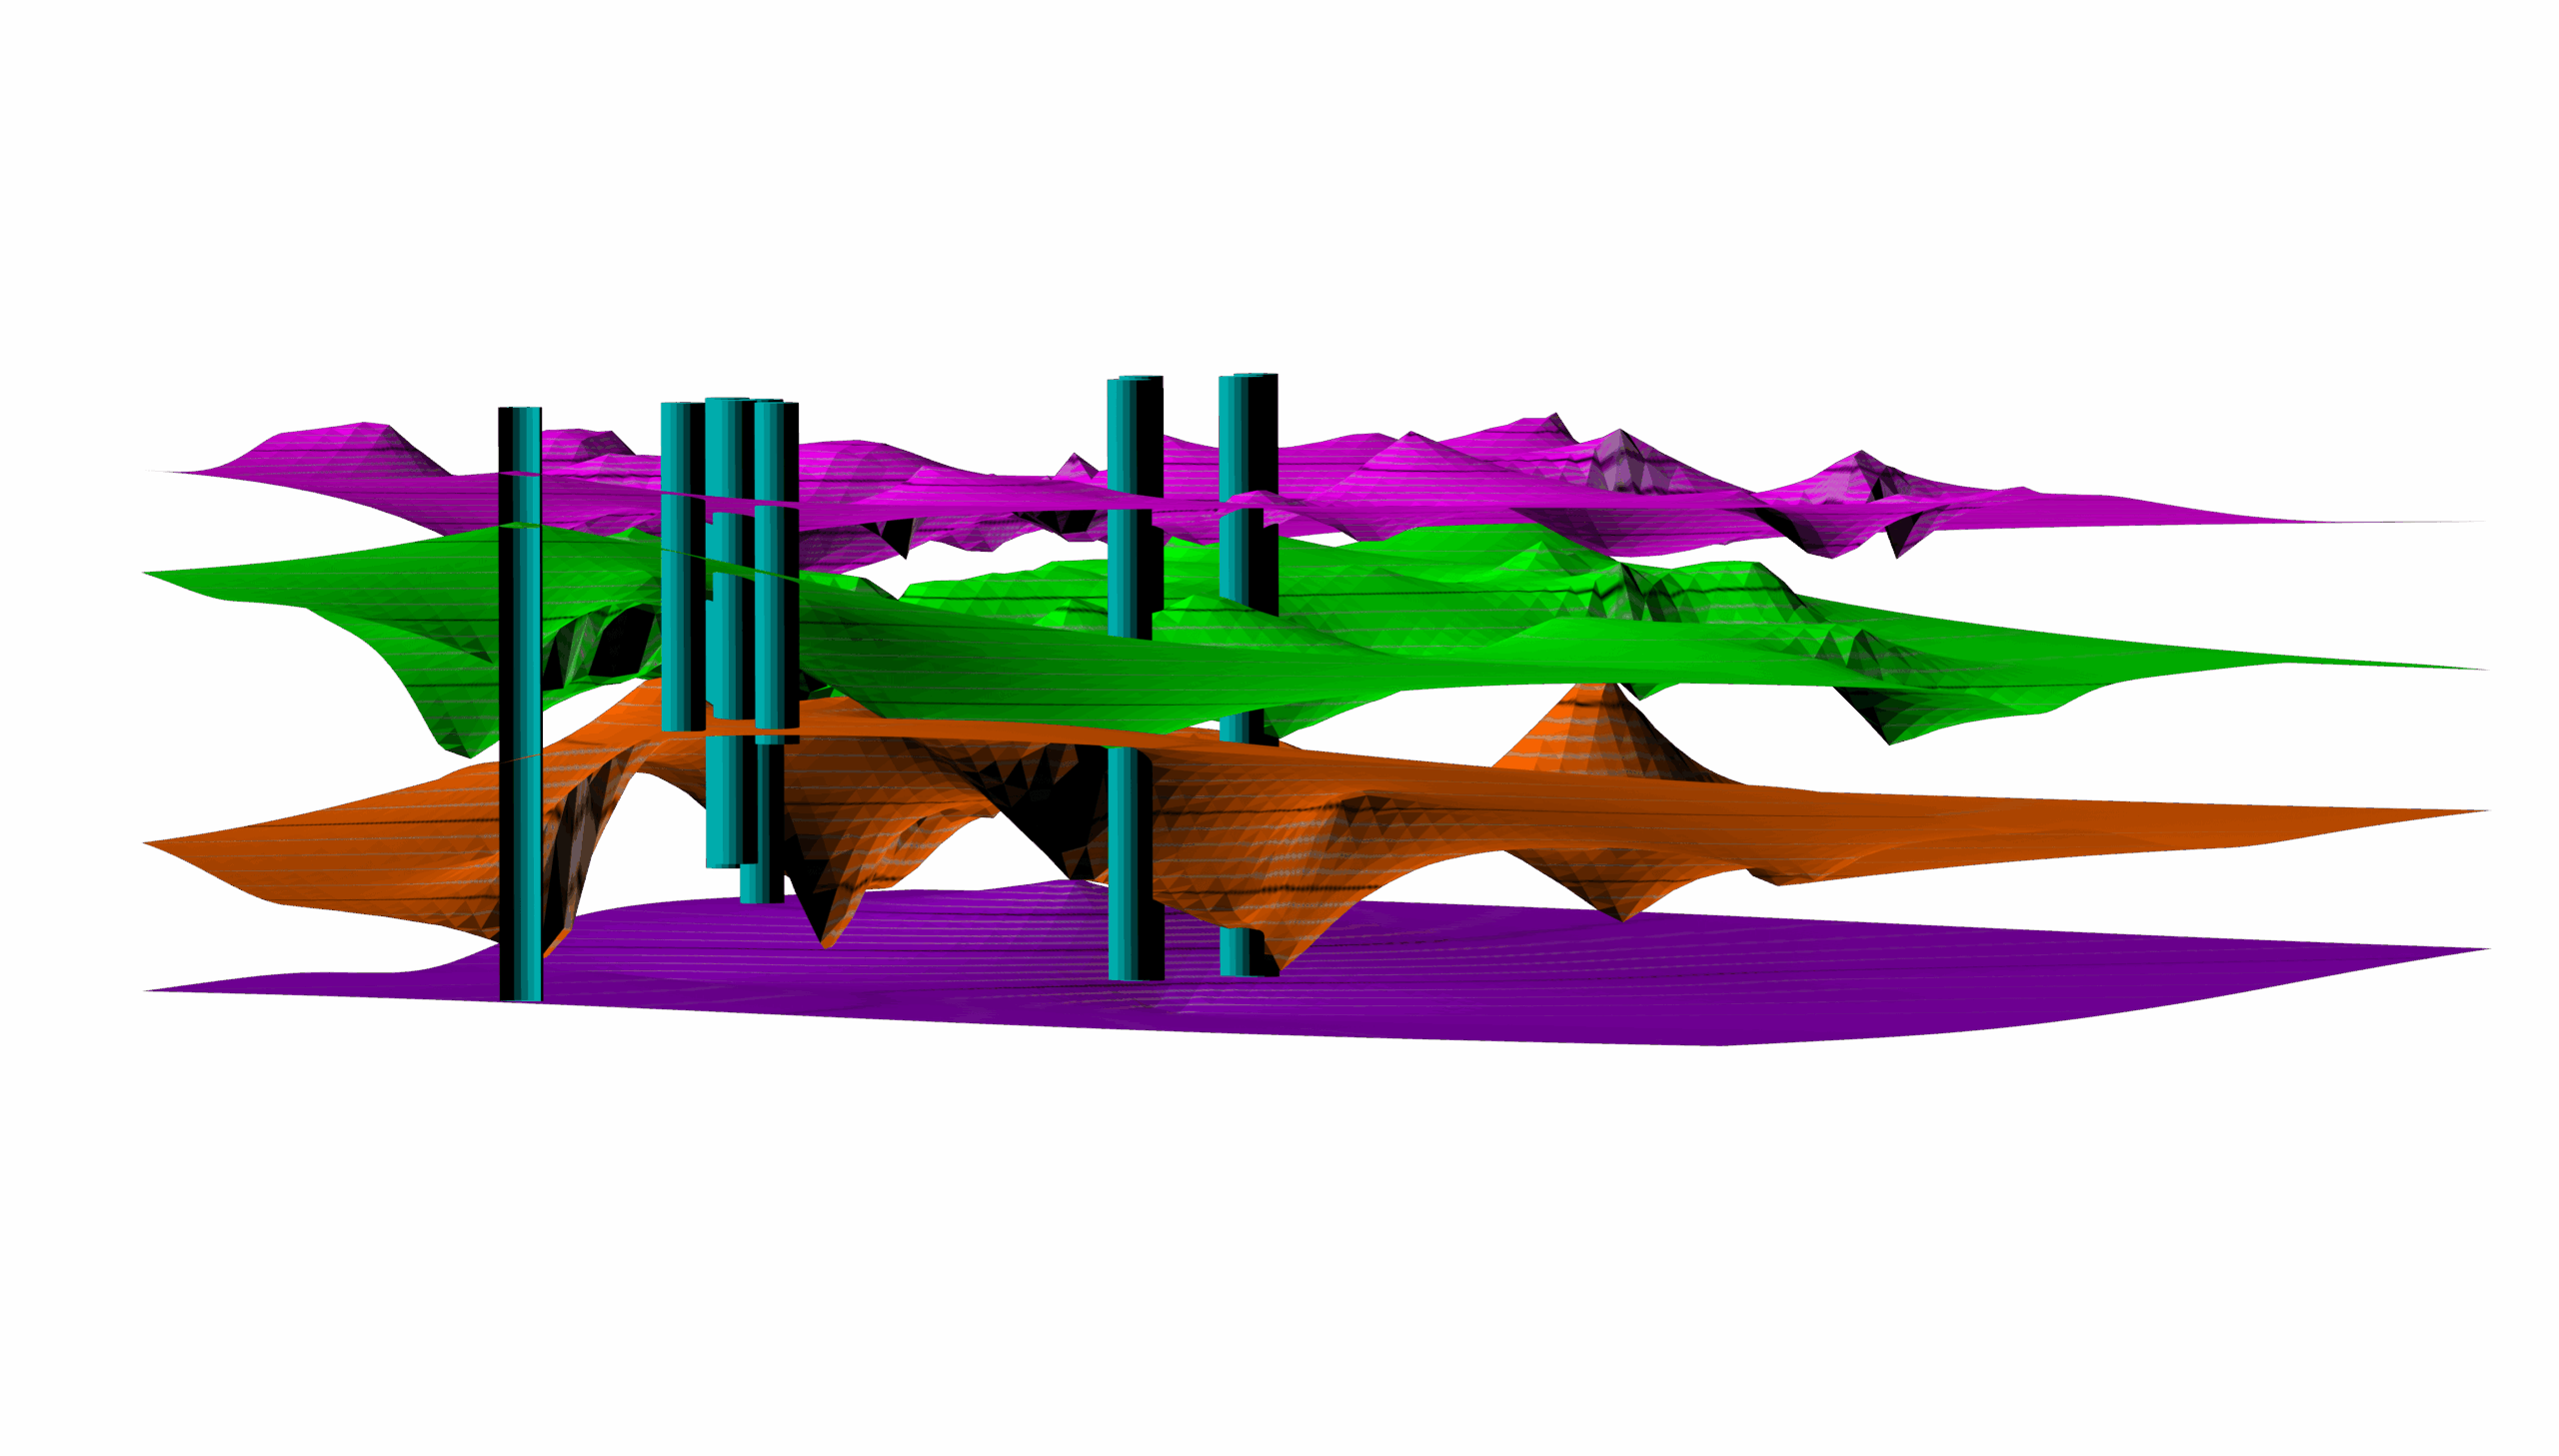
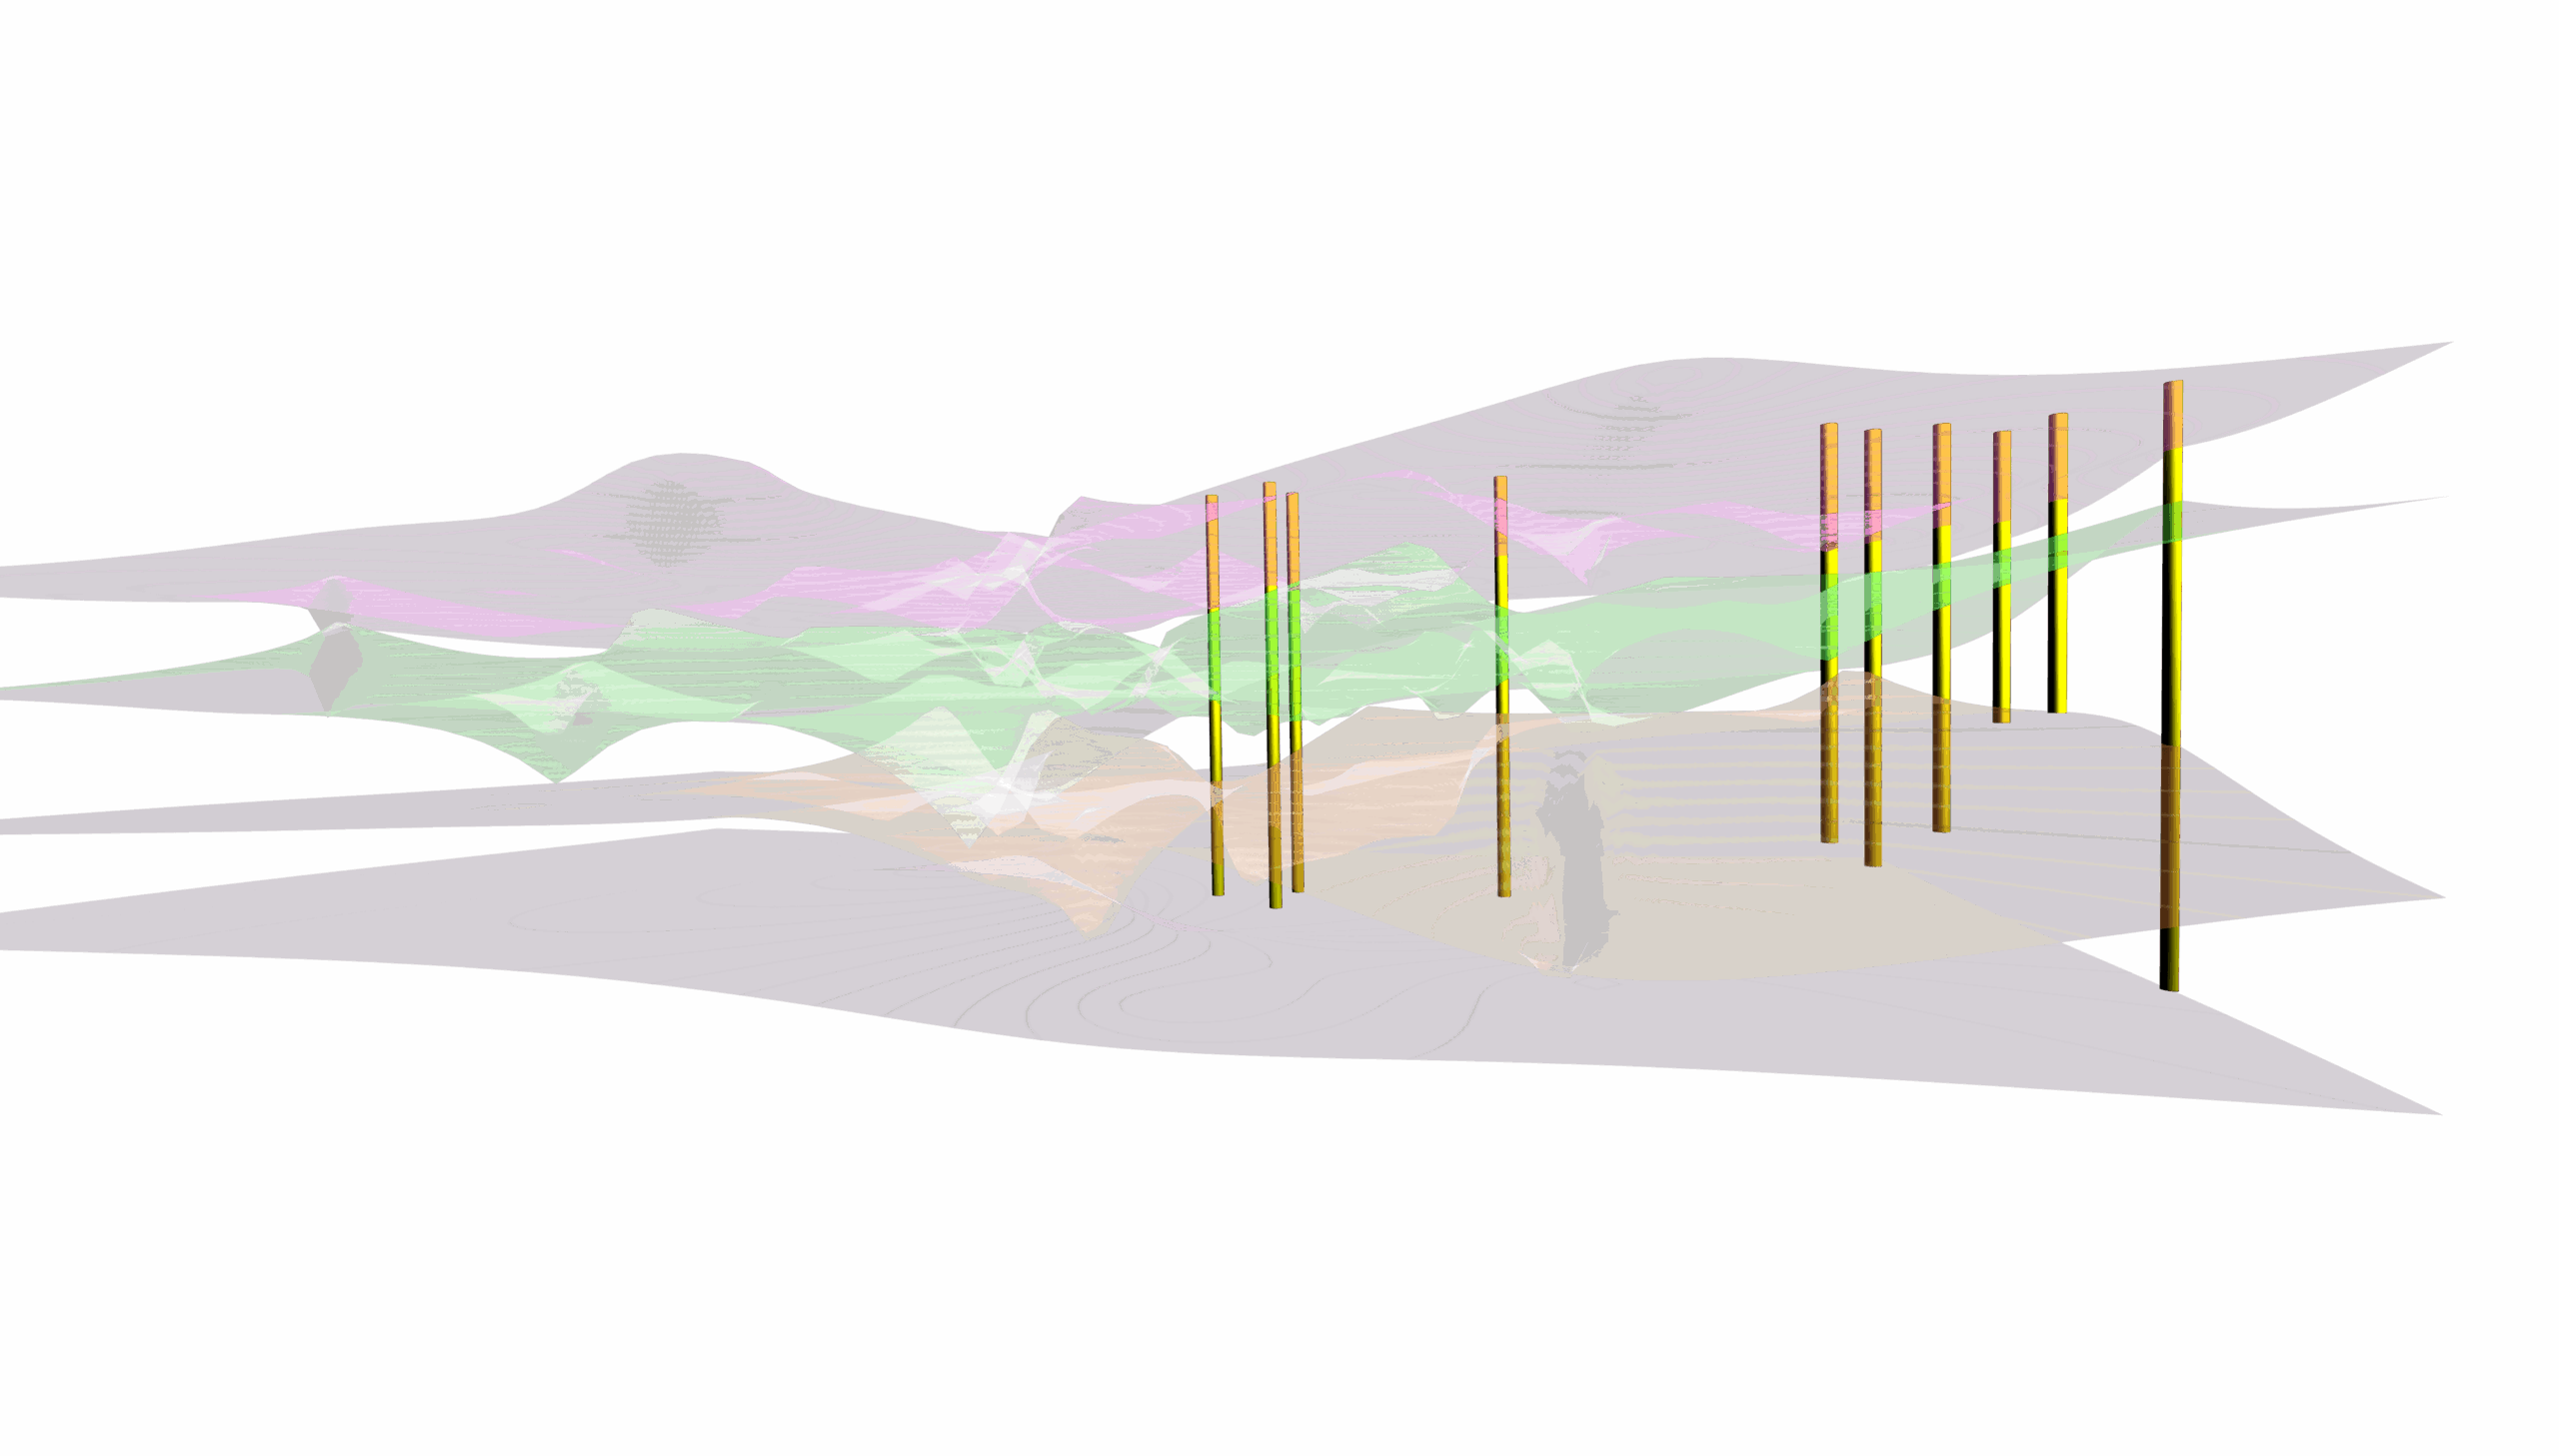
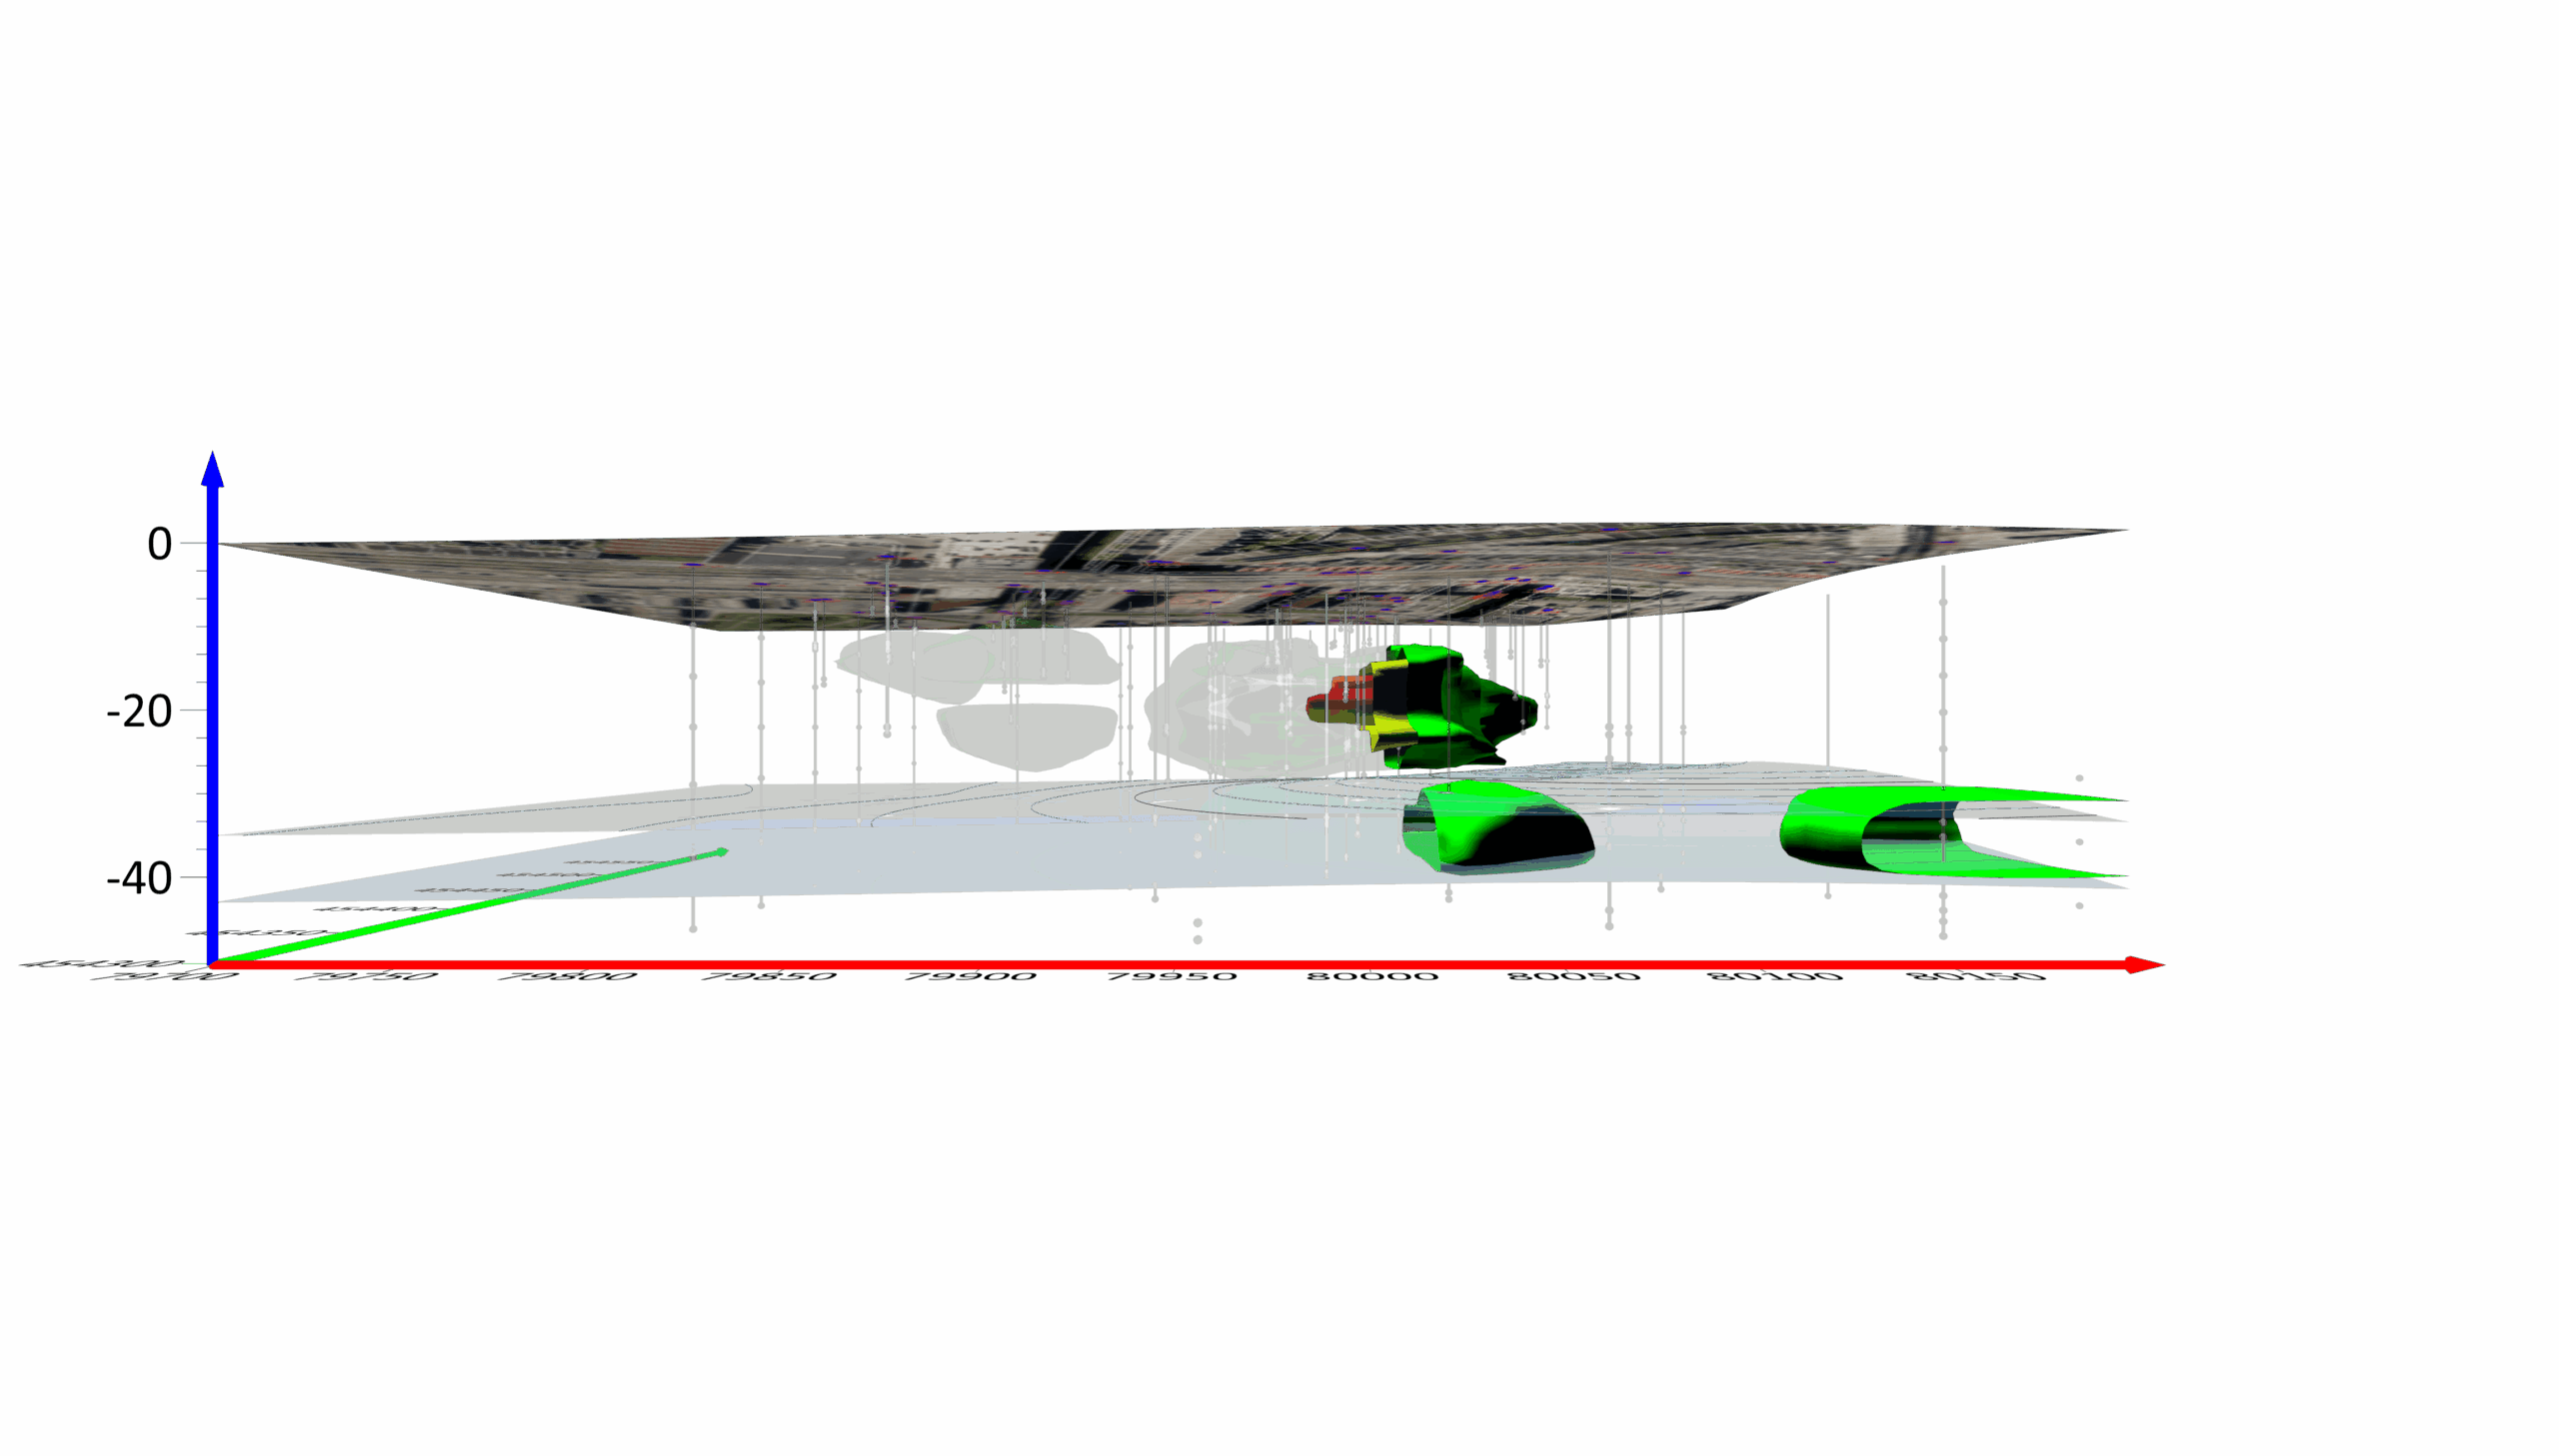
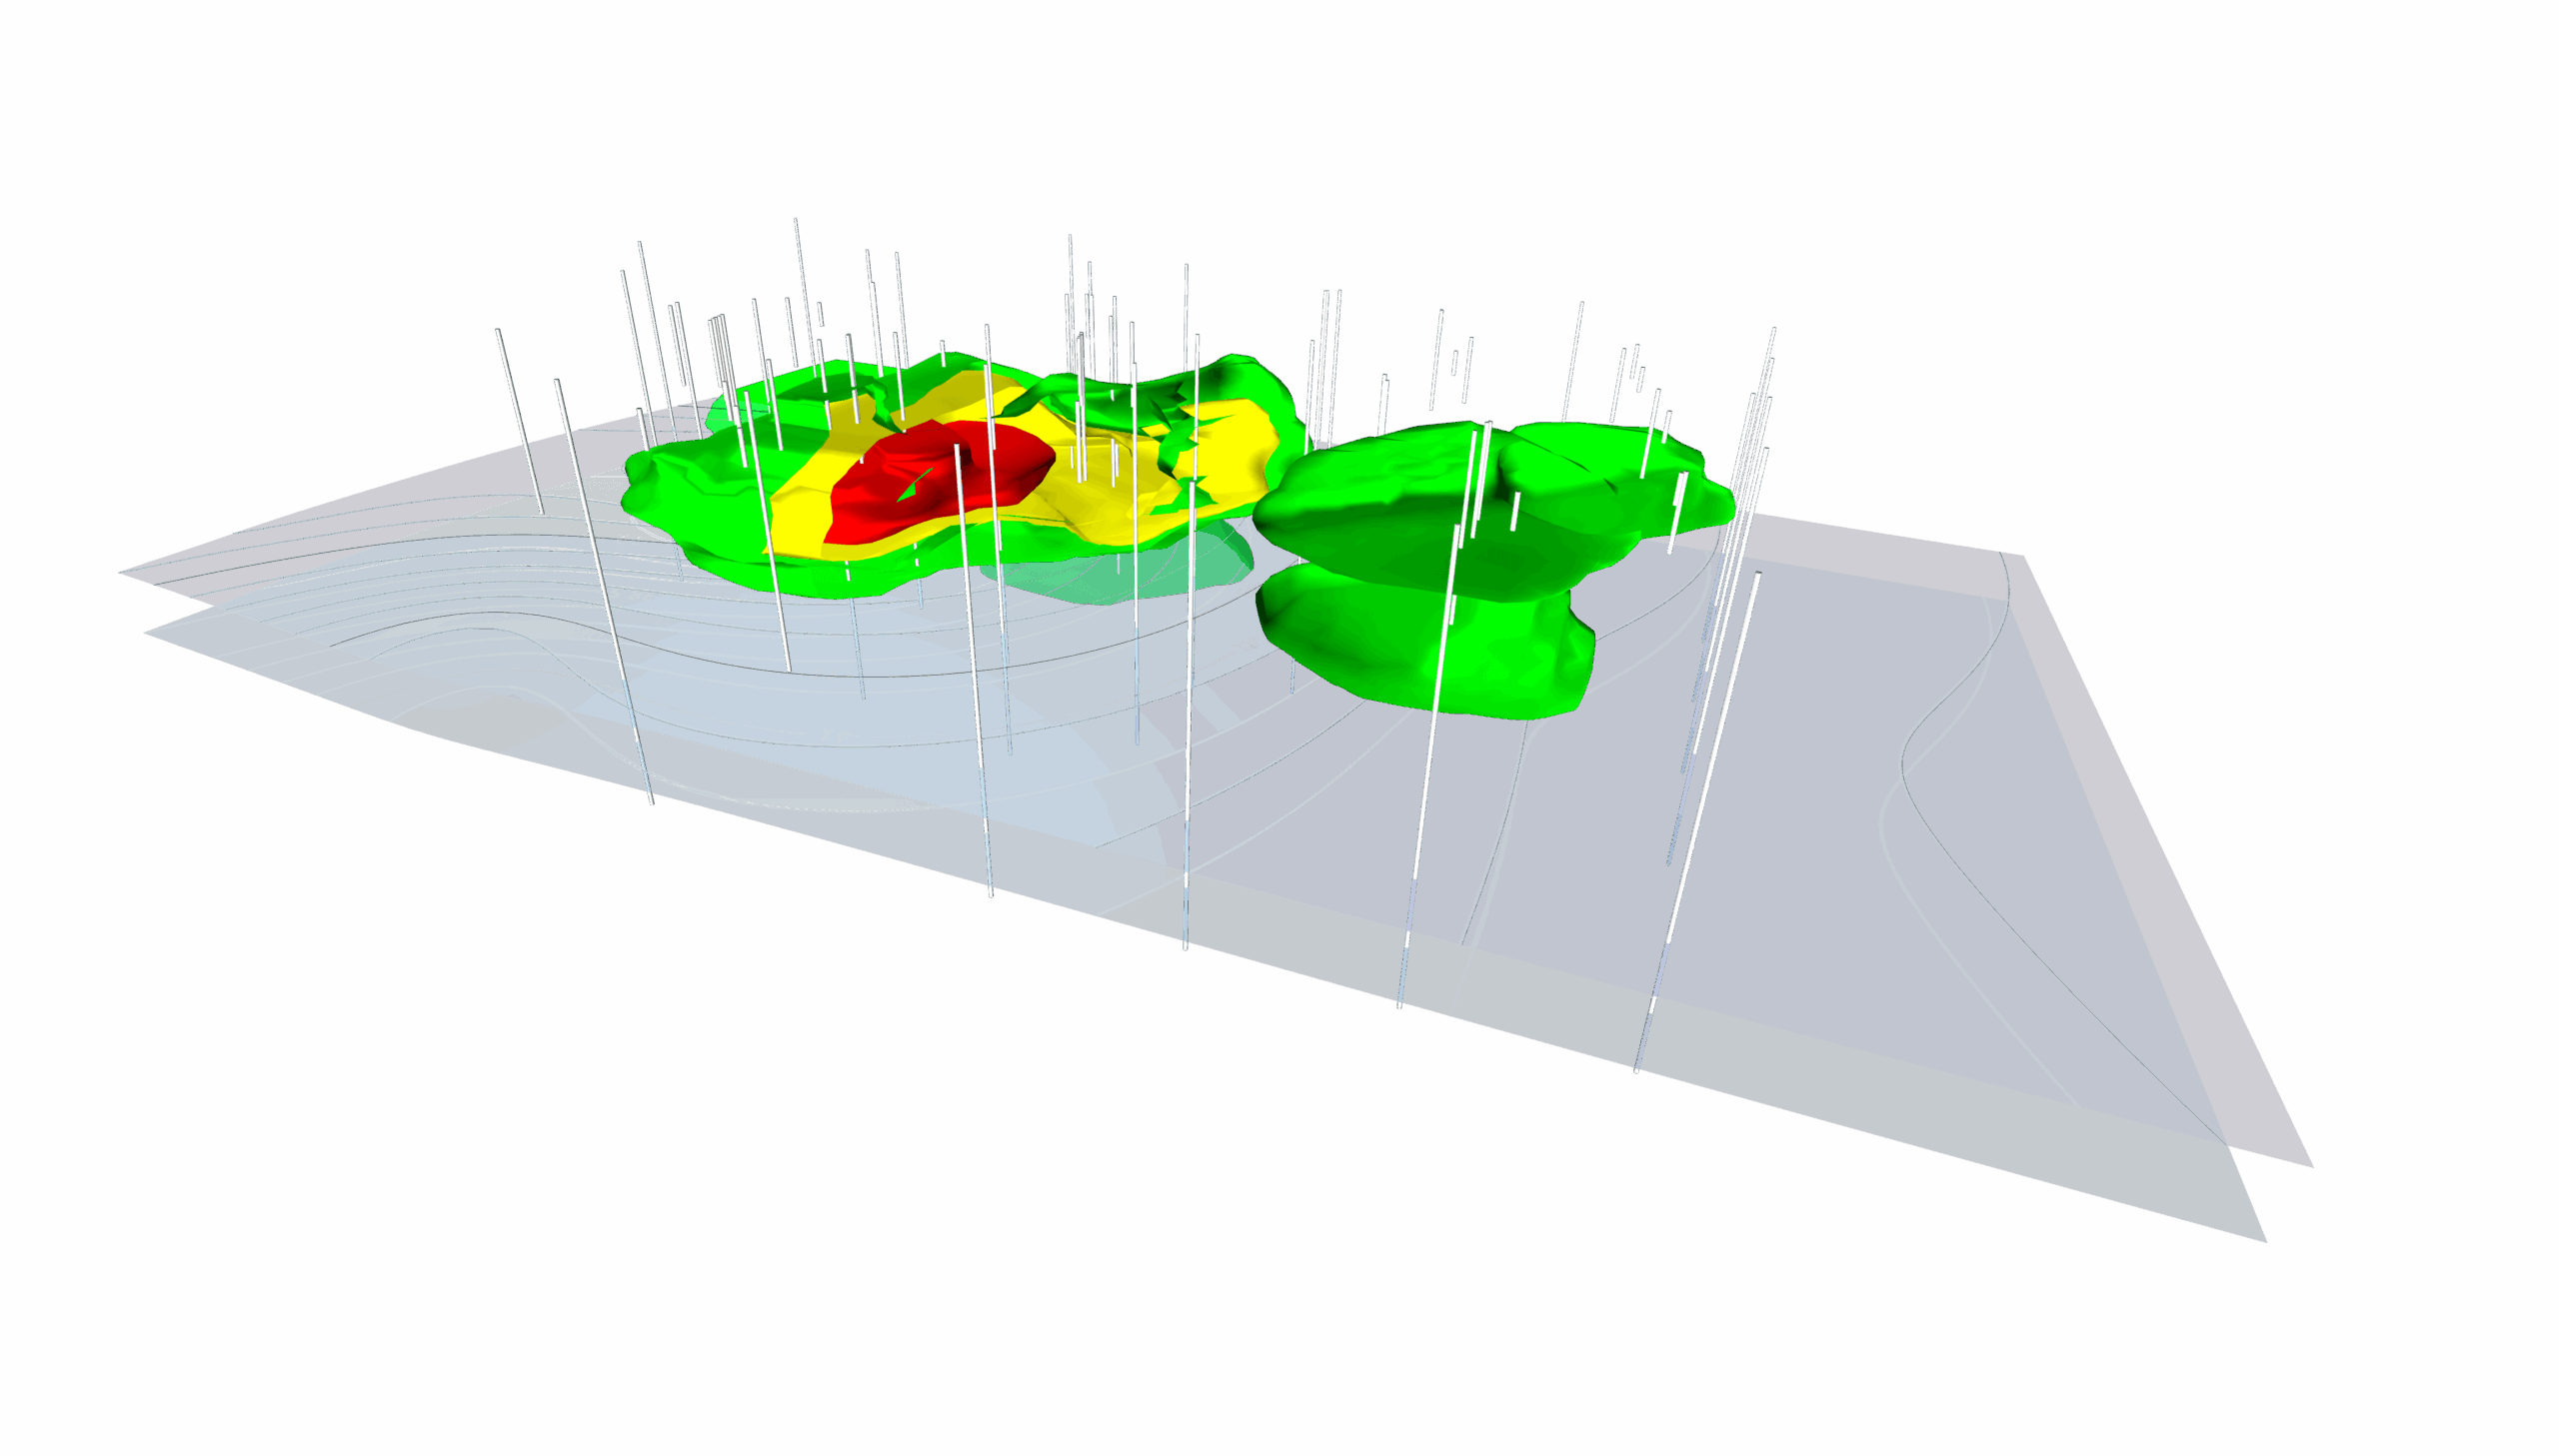
With 3D surface maps, your drillholes show up as single points. That leaves you with little insight into your data other than your drillholes’ locations. However, as you can see in the visualizations below, you can bring your drillholes to life by showing not only their location but also their path. You can see how your drillholes move and interact with different subsurface features and also customize their appearance—including their size and color—to make them stand out or communicate more information about what’s happening underground. This level of visibility and customization isn’t possible with 3D surface maps. Only when you move toward 3D View do you get more property controls and insight.
3. Transparency Control: See Through Layers with Ease
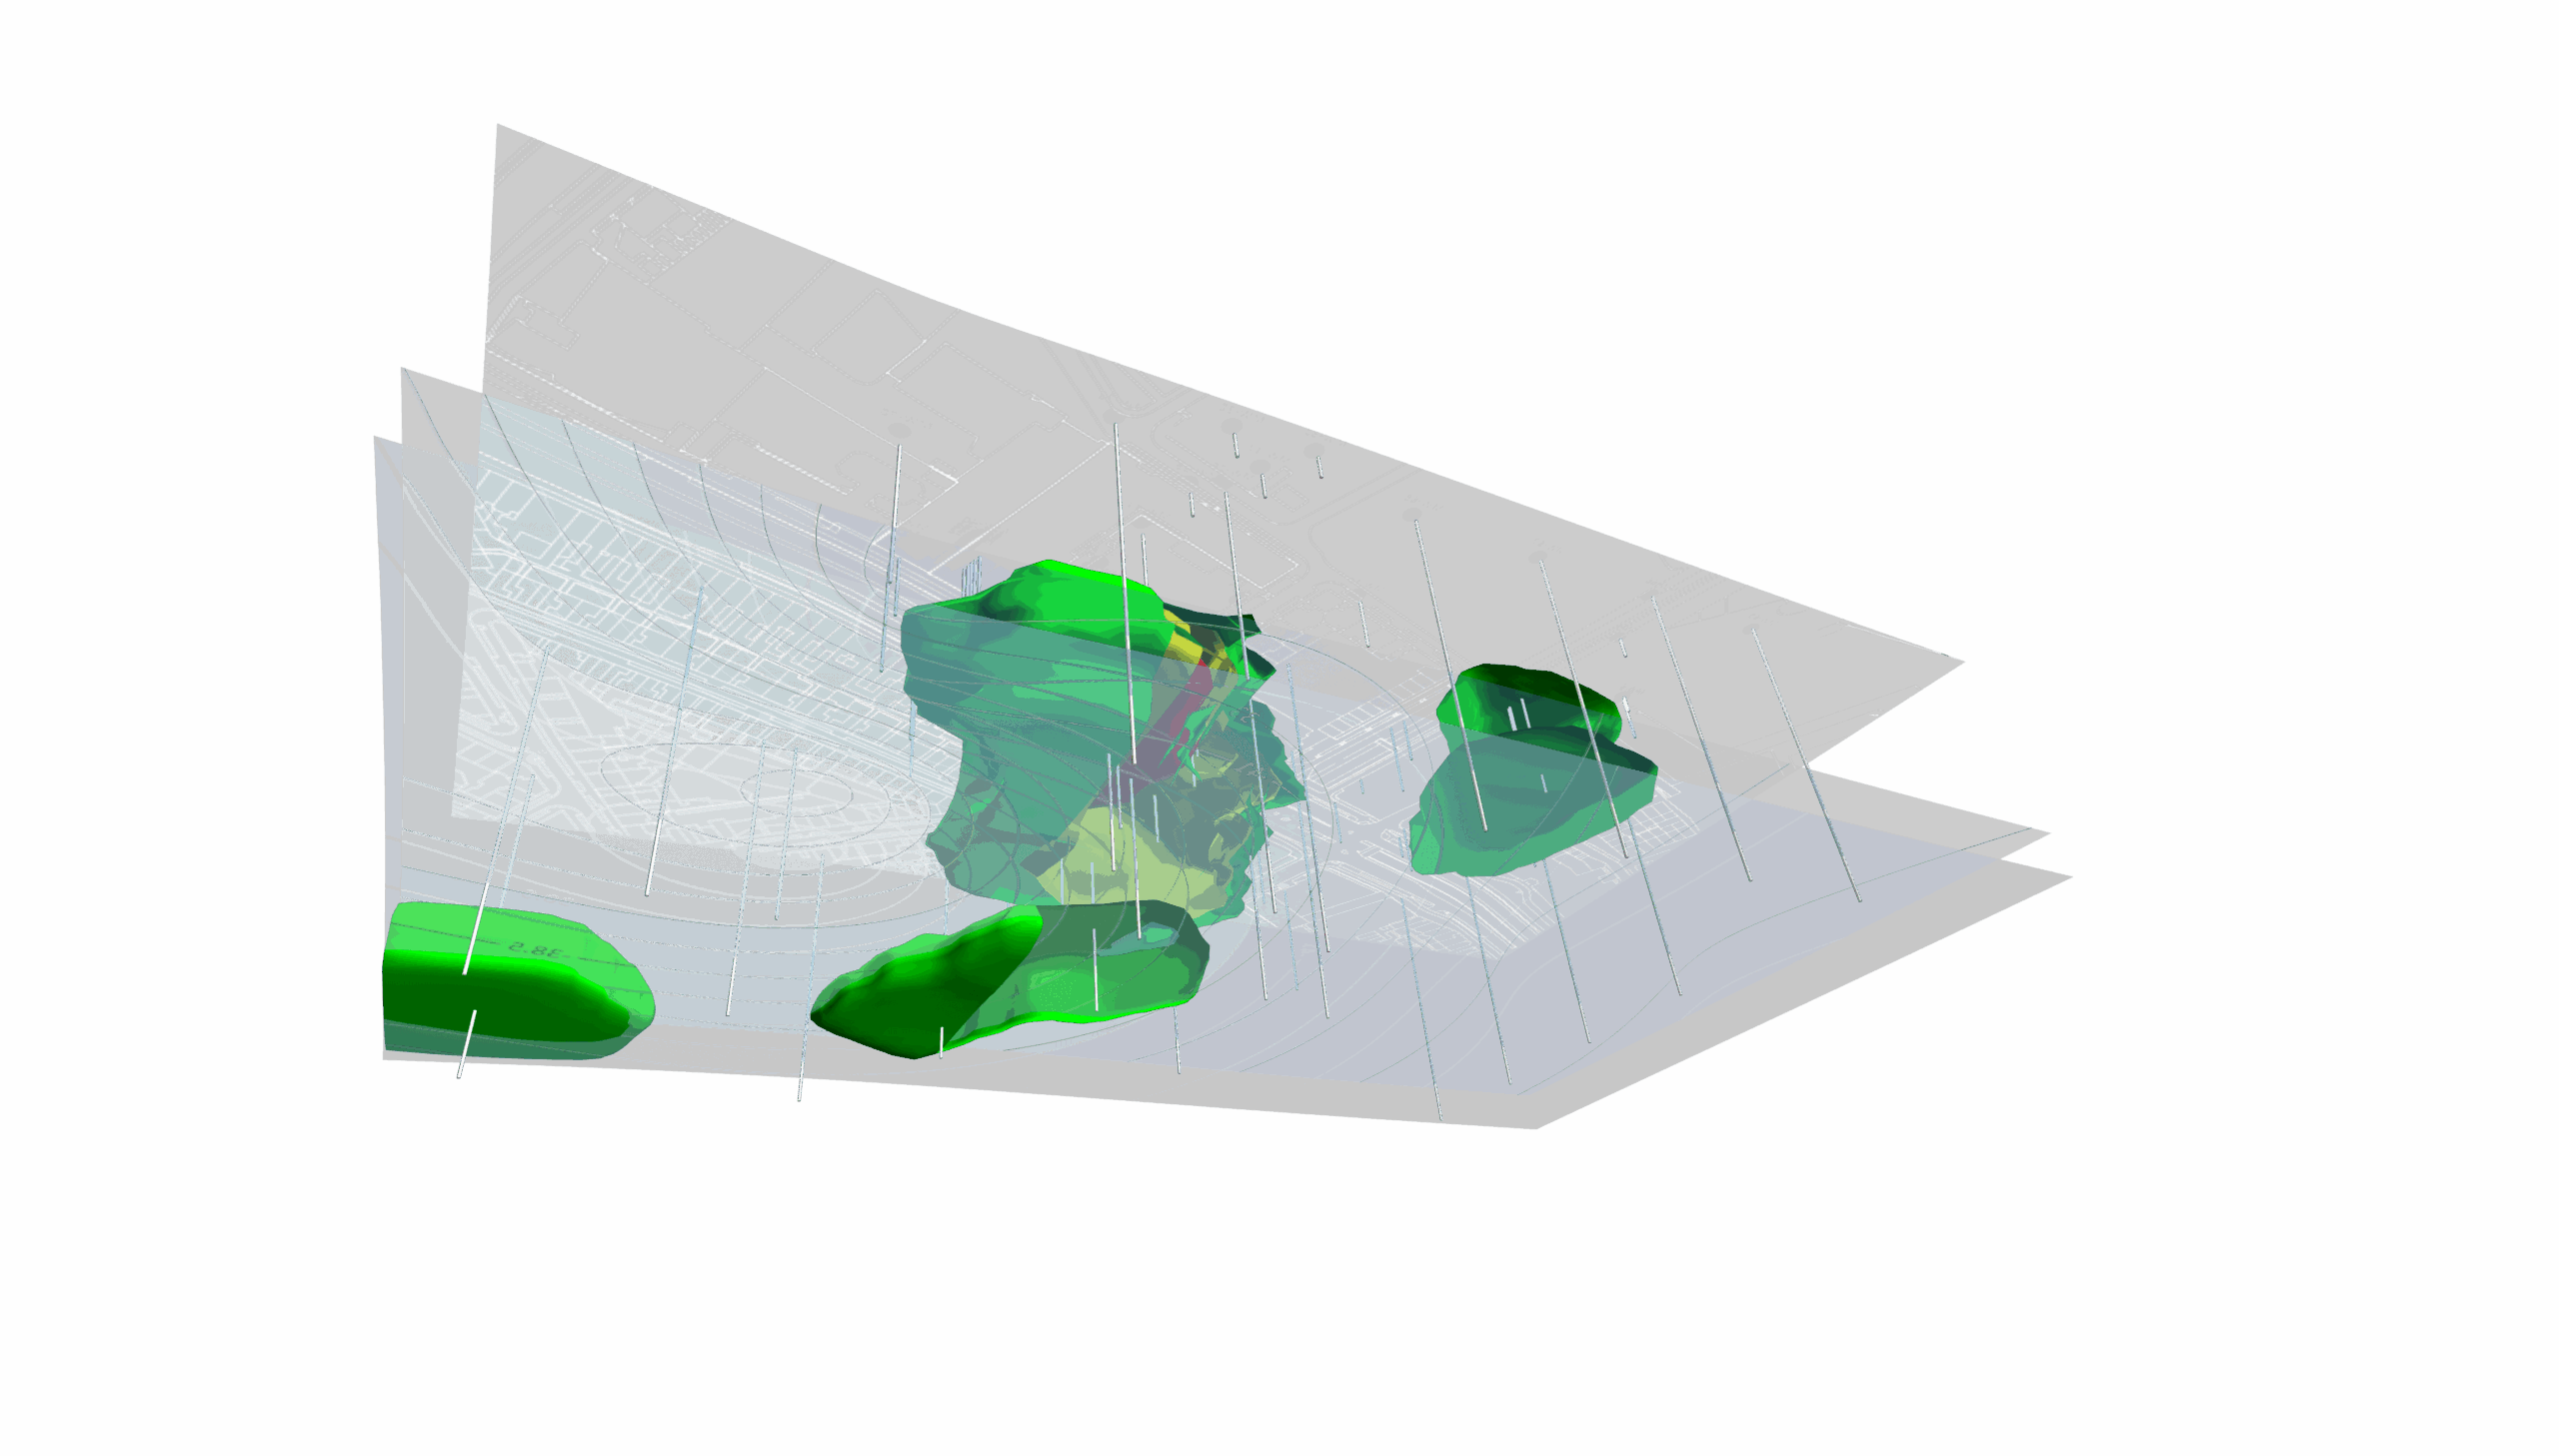
Another major advantage of 3D View is layer transparency. In a standard 3D surface map, you can’t see through layers, which means important details about subsurface features remain hidden. In 3D View, transparency settings equip you to adjust the visibility of each layer. In both visualizations, transparency was applied to the top layers, revealing deeper insight into what’s happening underground. If you were analyzing groundwater contamination, this feature could help highlight affected areas within subsurface layers.
4. Coordinate System Support: Align & Integrate Data Seamlessly
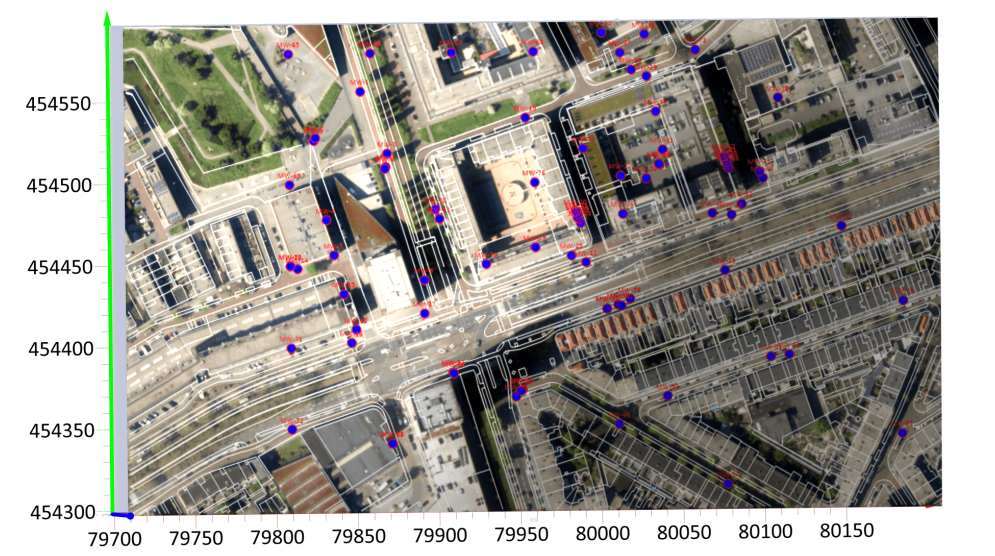
One of the biggest limitations of 3D surface maps is that they do not support coordinate systems. This means if you’re working with multiple datasets from different sources, they may not align properly. With 3D View, coordinate system support ensures accurate overlaying of different datasets, so if you incorporate aerial imagery from Google Maps or OpenStreetMaps, it will align perfectly with your map or model, giving greater context to stakeholders.
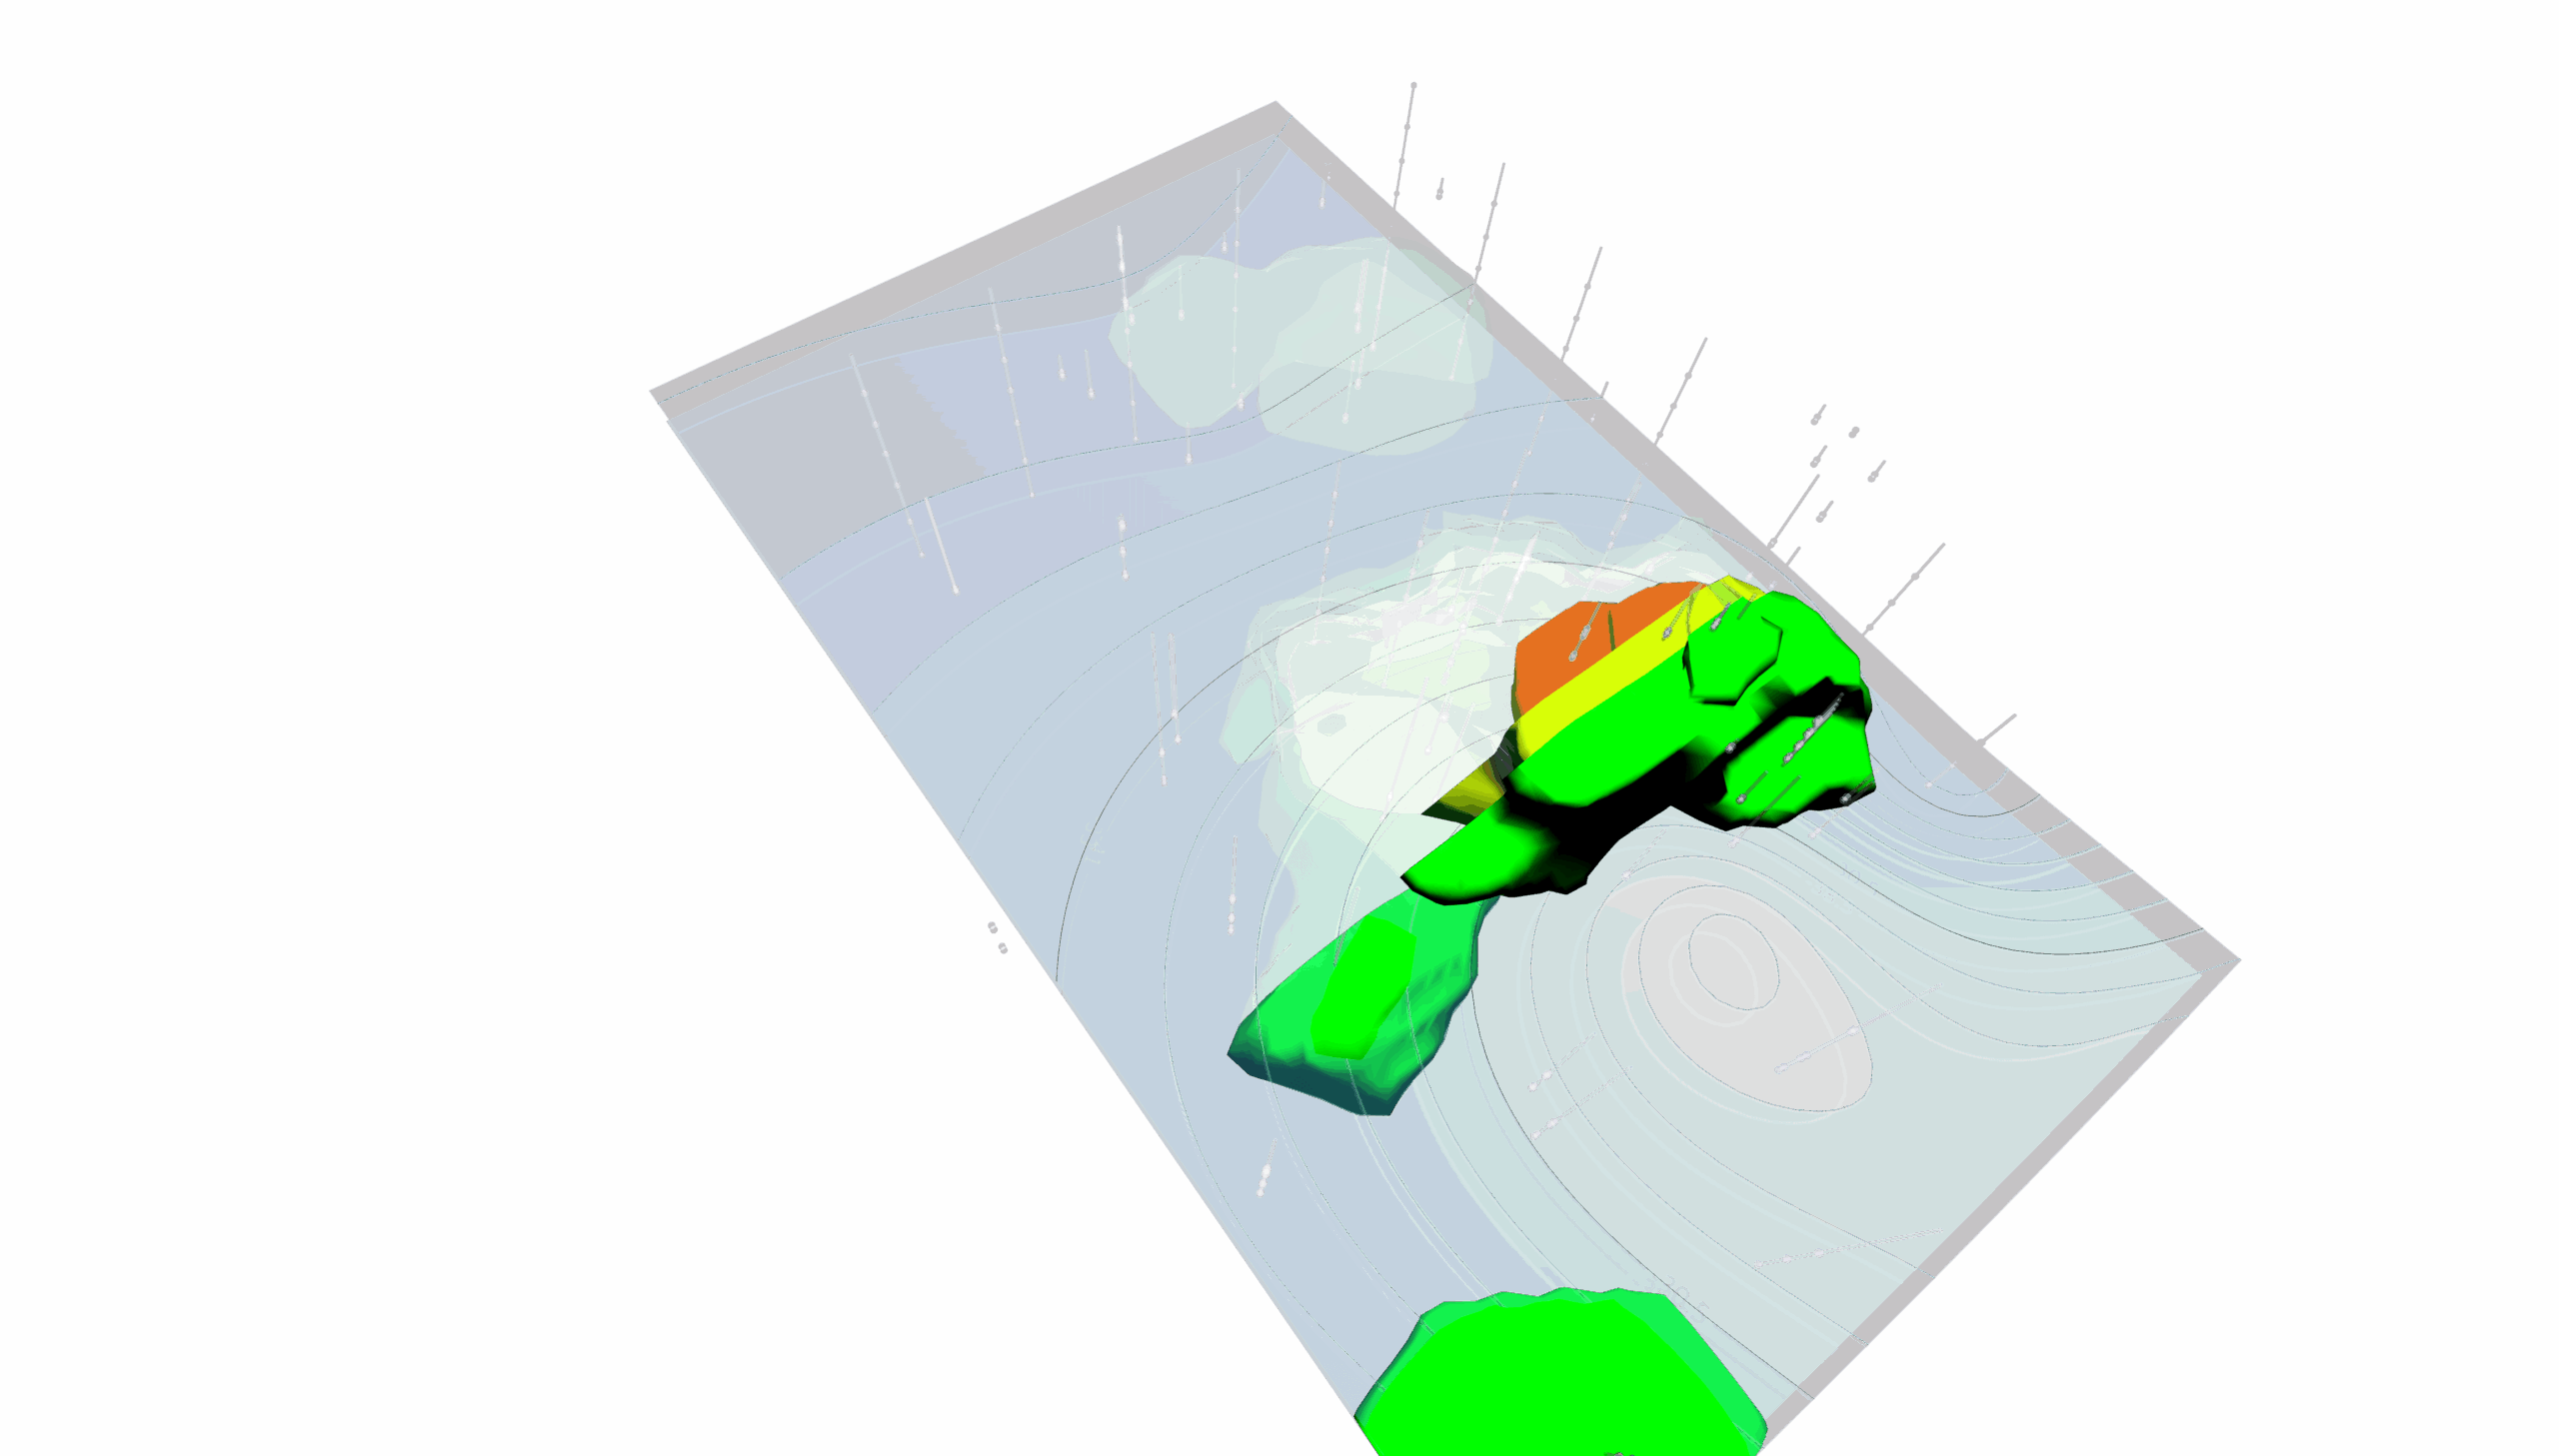
Consider the visualizations below, for example. Because there’s coordinate system support, we added aerial imagery from OpenStreetMaps, and it was accurately positioned over the maps, even though the top layer was in the RD New coordinate system and the image was in the WGS84 coordinate system. The automatic adjustment Surfer made ensured precise alignment, eliminating the risk of misinterpretation due to projection mismatches and also enhancing context around the project’s location.
5. Lighting Effects: Create Publication-Quality Visuals
Lighting plays a crucial role in creating publication-quality visualizations that highlight important details. With 3D View, you can adjust lighting intensity and direction to improve visibility, apply shininess effects to emphasize different surfaces, and choose between fixed or camera-following lighting to ensure optimal illumination from any angle.
For the visualization below, we added lighting effects to enhance the visibility of contamination plumes, leading to better differentiation between threshold levels. This type of visual refinement means we have a publication-ready graphic that will catch viewers’ attention and keep them engaged.
6. 3D PDF Export: Share Interactive Models with Stakeholders
One of the most impactful advantages of 3D View is the ability to export interactive 3D PDFs. Unlike standard 2D PDFs, a 3D PDF equips stakeholders to rotate the model freely, toggle layers on and off to explore different aspects of the dataset, and examine relationships between features in real-time. A 3D PDF can also be opened and explored using Adobe Acrobat, making it easy to share insights with clients, colleagues, or decision-makers without requiring specialized software.
The Power of 3D View
In a nutshell, by upgrading from 3D surface maps to 3D View, you gain access to powerful visualization and analysis tools, including the following:
- Full 3D rotation for better perspective
- Drillhole visibility and customization
- Transparency controls to see through layers
- Coordinate system support for precise alignment
- Lighting adjustments for high-quality visuals
- Interactive 3D PDF exports for better stakeholder engagement
With these advantages, 3D View transforms data from static visuals into dynamic, interactive models, helping you gain deeper insights and communicate findings more effectively.
Make the Switch to 3D View for Better Analysis & Designs
All in all, 3D View is a transformative approach to data visualization. While 3D surface maps have long been a go-to tool, they come with limitations that hinder data exploration, alignment, and measurement. By contrast, 3D View provides several major benefits that make it easier to analyze complex spatial relationships, share findings with stakeholders, and create publication-quality visuals.
If you’re still relying on static 3D surface maps, it’s time to move forward. Start using 3D View in Surfer to unlock deeper insights, improve collaboration, and take your data analysis and visualization to the next level.
Don’t have Surfer yet? Download a 14-Day Free Trial to experience the power of 3D View!