What Damage Can a Hurricane Cause? Using Maps & Graphs to Provide Insight That Drives Planning & Resilience
Hurricanes are among the most destructive natural disasters that geo-professionals analyze. But understanding hurricane damage is rarely as simple as reviewing a few reports or isolated datasets. The true impact of a hurricane unfolds across entire regions, where overlapping hazards, shifting conditions, and widespread infrastructure consequences make it difficult to fully understand what happened and where future vulnerabilities still exist.
That’s where maps and graphs become essential.
By clearly and effectively visualizing hurricane-related data, technical experts can uncover patterns that support stronger planning and resilience efforts. But what kinds of patterns can data visualization actually uncover? Let’s explore how maps and graphs reveal where damage occurred, how different hazards interacted, and which areas may remain most vulnerable in the future.
The Different Types of Damage Hurricanes Can Cause
One of the biggest challenges in understanding hurricane damage is that it is inherently multi-faceted. The same storm can produce very different effects depending on location, terrain, infrastructure, and proximity to water. While one area may experience severe coastal flooding, another may face inland flash flooding or concentrated wind damage miles away from landfall. Understanding these overlapping impacts is critical for planning and resilience efforts. That said, here are some of the most common types of damage hurricanes can cause.
Storm Surge Damage
Storm surge is one of the most dangerous and destructive hazards associated with hurricanes. As powerful winds push seawater inland, coastal communities can experience rapid flooding that damages both natural environments and critical infrastructure.
As a result, the destructive footprint of a storm surge can heavily affect a wide range of assets, including:
- Homes and businesses
- Roads and bridges
- Utilities and power systems
- Ports and coastal infrastructure
- Emergency response access routes
What makes storm surge especially dangerous is how quickly water levels can rise and how far inland flooding can extend. In some cases, entire communities can become inundated within a short period of time.
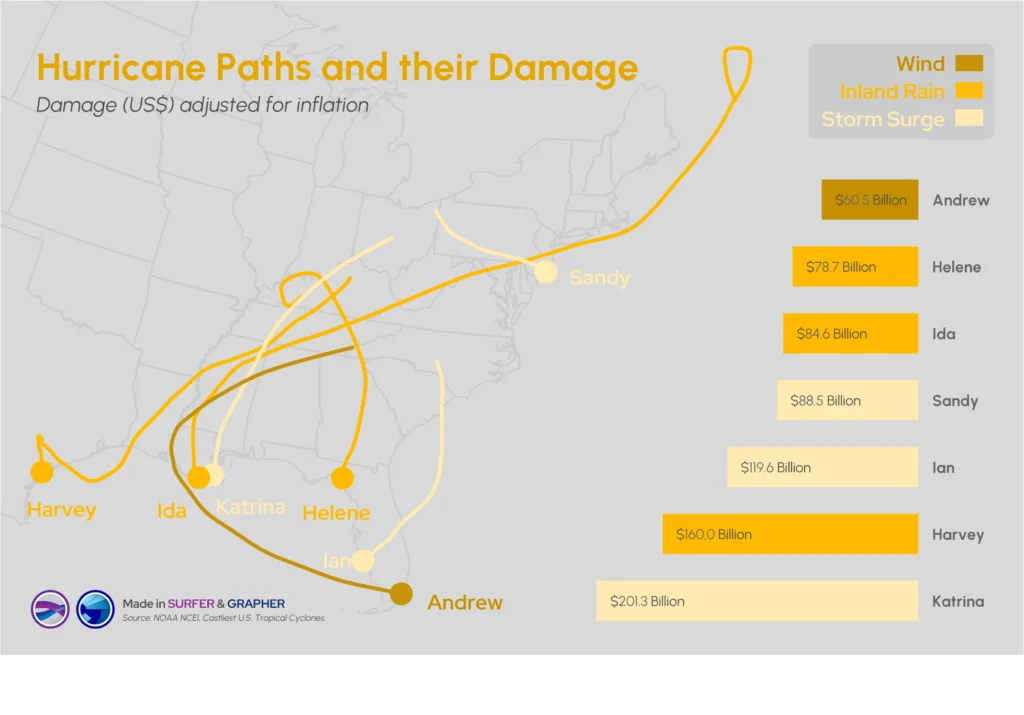
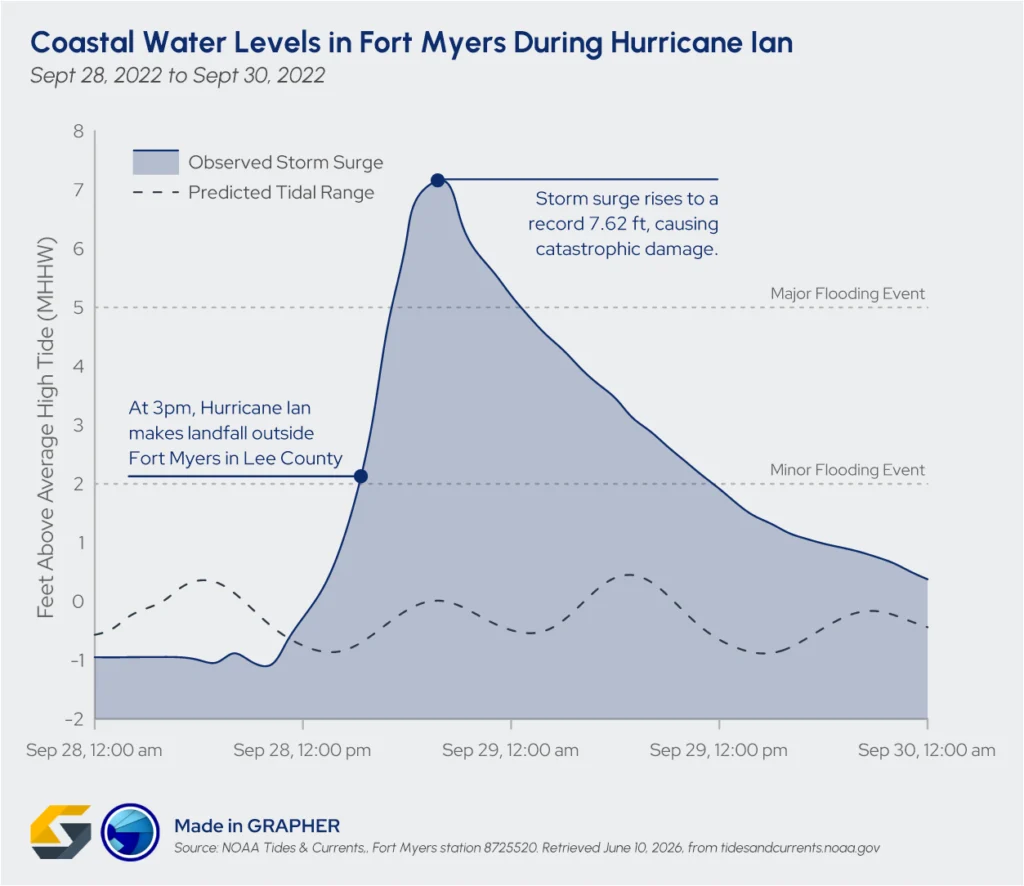
A powerful example occurred during Hurricane Ian in September 2022. As Ian made landfall near Fort Myers, Florida, storm surge rapidly intensified, reaching a record 7.62 feet above Mean Higher High Water (MHHW). The resulting coastal flooding devastated neighborhoods, damaged roads and bridges, disrupted utilities, and left entire communities inaccessible.
Flooding and Prolonged Rainfall Damage
One of the biggest dangers with hurricane-related flooding is that the impacts frequently continue long after the storm itself weakens. Water can accumulate gradually, rivers can continue rising, and saturated ground conditions can worsen flooding over time.
Historical data highlights just how catastrophic this post-landfall rain can be, even thousands of miles away from a storm’s initial impact zone. Here are three hurricanes that make the effects clear:
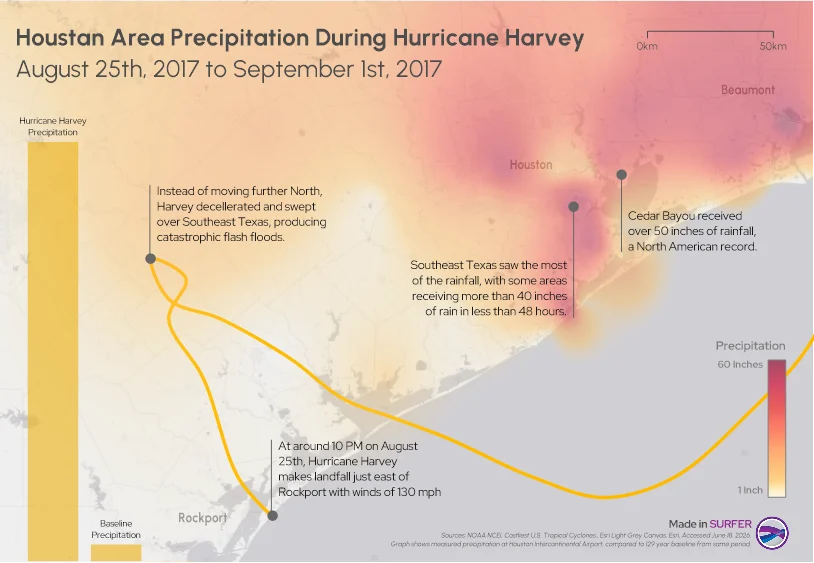
- Hurricane Harvey (2017): It remained stalled over the Gulf Coast, pouring over 50 inches of rain in parts of Texas. According to NOAA, the resulting widespread inland flooding devastated Houston, cutting off major transportation networks and drowning neighborhoods far beyond the immediate coastline.
- Hurricane Ida (2021): After making landfall as a Category 4 storm in Louisiana, Hurricane Ida’s remnants tracked thousands of miles into the Mid-Atlantic and Northeast. Its unprecedented short-duration rainfall overwhelmed the dense urban infrastructure of New York and New Jersey, triggering flash flood emergencies and trapping residents in flooded basement apartments.
- Hurricane Helene (2024): This storm struck the Florida coast before racing inland over the southern Appalachian Mountains. A USGS assessment suggests that Hurricane Helene dropped over 30 inches of rain onto already saturated mountain soils, triggering more than 2,200 landslides that destroyed entire communities.
Together, these historical benchmarks underscore why inland flooding is often considered disastrous in tropical systems. Long after the dramatic coastal storm surge recedes, the sheer volume of water moving across topographies can turn stable inland rivers, urban streets, and mountain hollows into high-risk hazard zones.
Wind Damage
Hurricane-force winds can cause severe structural damage across both coastal and inland areas. In many storms, wind impacts extend across enormous geographic regions, affecting buildings, vegetation, utilities, and transportation infrastructure simultaneously.
Strong hurricane winds can result in damage like the following:
- Destroyed or heavily damaged buildings
- Uprooted trees and vegetation loss
- Damaged electrical and utility infrastructure
- Debris spread across roads and populated areas
- Long-duration power outages
The severity of wind damage can vary significantly depending on several factors, including:
- Storm intensity
- Local terrain and topography
- Building design and construction quality
- The age and resilience of infrastructure systems
For example, Hurricane Andrew caused catastrophic structural destruction throughout parts of southern Florida due to extreme wind speeds, with maximum sustained speeds of 165 miles per hour. Because of the storm’s intensity, more than 82,000 businesses were damaged or completely destroyed, and over 250,000 people were left homeless. The estimated damage that Hurricane Andrew wrought totaled $26.5 billion.
Cascading Network Failures
Even when physical storm damage appears localized, hurricanes can create widespread systemic disruption through the failure of interconnected infrastructure and utility systems.
In modern engineering and planning, infrastructure is analyzed as a network of dependencies where a single point of failure can trigger a domino effect across an entire region.
Hurricanes frequently trigger systemic breakdowns across these core operational layers:
- Grid interdependency: A catastrophic failure in the electrical grid immediately knocks out the localized power required to run wastewater treatment facilities and regional lift stations, creating secondary environmental hazards.
- Supply chain and logistics stagnation: When debris or floodwaters compromise key transportation corridors like ports, rail lines, and major highways, the entire region experiences supply chain bottlenecks that stall the delivery of critical reconstruction materials.
- Telecommunication and economic isolation: Prolonged fiber-optic and cellular tower outages disconnect emergency operations centers and force local businesses to remain closed, exponentially extending the financial recovery timeline of the community.
- Emergency response impediments: When downed trees and localized structural failures physically block access roads, utility crews are entirely prevented from reaching critical infrastructure nodes to begin repairs, stalling the entire restoration lifecycle.
The indirect impacts of a total network failure often create a much larger geographic and economic footprint than the physical storm path itself.
A defining example of this occurred during Hurricane Ida, when all eight transmission lines providing power to New Orleans collapsed, leaving the entire city without power. This failure triggered a cascading crisis: 18 municipal water systems failed, cell service was unavailable in some areas, and sewer pumping stations were impacted.
Erosion and Environmental Damage
Hurricanes dramatically reshape natural environments during and after a storm. Powerful waves, storm surge, and shifting water movement can alter coastlines through processes such as the following:
- Coastal erosion
- Sediment displacement
- Vegetation loss
- Shoreline reshaping
These environmental changes can trigger additional long-term impacts, including:
- Wetland destruction
- Habitat disruption
- Water quality degradation
- Increased vulnerability to future storms
Environmental damage can persist long after visible flooding disappears. Eroded coastlines, damaged wetlands, and disrupted ecosystems may take years—or even decades—to recover fully.
For example, Hurricane Sandy caused extensive coastal erosion and environmental damage across portions of the U.S. East Coast, reshaping shorelines and damaging natural protective barriers that help reduce future storm impacts.
How Maps and Graphs Turn Hurricane Data Into Insight
Understanding the different types of hurricane damage is one thing—but turning that information into meaningful insights that support planning and resilience efforts is another challenge entirely.
Hurricanes generate enormous amounts of spatial, environmental, and infrastructure-related data. On its own, that information can be difficult to interpret clearly, especially when multiple hazards overlap across geographic regions and evolve over time.
That’s where maps, graphs, and advanced modeling become essential. By transforming complex hurricane data into clear visual insights, geo-professionals can better identify patterns, understand relationships between hazards, evaluate vulnerability, and drive more informed decisions before, during, and after future storms. Here’s exactly how that works.
Visualizing Storm Tracks and Intensity
One of the most important ways maps help during hurricane analysis is by revealing how storms evolve geographically over time.
Visualization tools can help show:
- Hurricane paths across regions
- Landfall locations
- Changes in storm intensity over time
- Areas exposed to the strongest impacts
Common visuals used for this type of analysis include the following:
- Storm track maps
- Intensity contour maps
- Time-series intensity graphs
These visuals help planners and emergency managers understand exposure and risk zones more clearly. Instead of viewing a hurricane as a single isolated event, teams can analyze how the storm strengthened, weakened, shifted direction, or expanded throughout its lifecycle.
This becomes especially important when comparing historical hurricane behavior, evaluating vulnerable infrastructure corridors, or preparing evacuation and emergency response strategies for future storms.
Mapping Flood Zones and Storm Surge Inundation
Flooding is often one of the most widespread and long-lasting hurricane impacts. Maps help reveal not just where flooding occurred, but how deeply water spread and which populations or infrastructure systems were most vulnerable.
Flood and inundation visualizations can help identify:
- Flood extent across affected regions
- Water depth and inundation severity
- Overlap between flooding and populated areas
- Infrastructure exposure in vulnerable zones
Useful visualizations for this type of analysis include:
- Flood extent maps
- Coastal inundation models
- Elevation overlays
These visual tools are especially valuable because flood impacts are heavily influenced by topography and elevation. Two nearby areas may experience dramatically different outcomes depending on terrain, drainage, and infrastructure design. However, by visualizing flood behavior spatially, planners and engineers can better support evacuation planning, infrastructure design improvements, and coastal resilience strategies.
Using Graphs to Analyze Rainfall and Wind Trends
While maps reveal where impacts occur, graphs help explain how storm conditions change over time.
Graphing hurricane-related data equips teams to identify:
- Rainfall peaks
- Storm duration
- Changes in wind intensity
- Relationships between pressure and storm strength
Several graph types are especially useful during hurricane analysis. Hydrographs, for example, are critical for showing how rivers and drainage systems respond during and after major rainfall events. They also help reveal how flooding progresses and when waterways reach peak levels.
Cumulative rainfall plots are another particularly effective visual for analyzing slow-moving storms. Instead of focusing only on rainfall intensity at a single moment, these graphs show the total volume of water precipitated over time. This becomes especially valuable during events like Hurricane Harvey, where prolonged rainfall caused catastrophic inland flooding.
Time-series wind and pressure graphs also help illustrate the relationship between dropping barometric pressure and rising wind velocity as hurricanes intensify.
Together, these various graph types help experts better understand storm progression, severity, and the timing of critical hazards throughout a hurricane’s lifecycle, empowering them to support planning and resilience efforts effectively.
Visualizing Environmental and Coastal Change
Maps and terrain visualizations help analyze how erosion, sediment movement, and environmental degradation alter landscapes over time.
One of the most effective ways to study these changes is through before-and-after visualizations. These visual comparisons often look like the following:
- Terrain models
- Shoreline comparison maps
- Erosion change visualizations
Together, these visuals can help reveal:
- Shoreline erosion
- Sediment displacement
- Vegetation loss
- Long-term environmental damage
These tools help geo-professionals better understand how hurricanes reshape natural environments and influence future vulnerability to coastal hazards. For example, the loss of wetlands or coastal vegetation may reduce natural storm protection for nearby communities during future hurricanes. Similarly, shoreline retreat and sediment redistribution can significantly alter flood risk patterns over time.
By visualizing these environmental changes clearly, teams can better support long-term resilience and restoration planning.
Using 3D Environments to Model Atmospheric Dynamics
Traditional 2D maps and line graphs are valuable, but some hurricane behaviors become much easier to understand within a true 3D environment. Adding a third dimension—whether representing altitude, cumulative depth, or time—empowers experts to analyze atmospheric behavior in a more spatially connected way.
One powerful example is the use of 3D volumetric rainfall models, sometimes called space-time cubes. These models treat geography as the X and Y axes while using depth or time as the Z-axis.
This approach helps transform a flat rainfall map into a 3D volume that highlights where storms stalled and which watersheds experienced the heaviest prolonged rainfall. Instead of viewing rainfall as isolated snapshots, teams can visualize how precipitation accumulated spatially and temporally throughout the storm.
3D wind velocity isosurfaces provide another valuable perspective. These visualizations treat wind as a dynamic 3D layer draped across terrain models.
This makes it easier to identify:
- Localized high-velocity wind zones
- Terrain-driven wind acceleration
- Areas where hills, valleys, or urban structures compress airflow
These localized “micro-zones” are often difficult to identify clearly on standard 2D wind maps.
Additionally, 3D visualization can help correlate barometric pressure and wind intensity spatially. By stacking pressure deficit surfaces above wind velocity grids, geo-professionals can more clearly visualize the physical relationship between falling eye pressure and the acceleration of the hurricane eyewall.
Incorporating Temporal Mapping into a Storm’s Lifecycle
The timing of a hurricane matters because the order of impacts often influences the severity of damage and the effectiveness of emergency response efforts.
For example, extreme winds may first weaken roofs and shatter windows. Heavy rainfall may then enter already-compromised structures. Storm surge or inland flooding may arrive later, trapping water inside damaged buildings.
This is where temporal mapping and 4D visualization become especially valuable.
By incorporating time directly into visualizations, it’s possible to replay how hazards evolved throughout the storm lifecycle and identify when critical infrastructure failures occurred. One especially useful application involves 4D time-lapse animations that combine storm surge inundation layers with the chronological movement of the hurricane eyewall.
These animations help emergency managers determine:
- When evacuation routes became inaccessible
- Which areas flooded first
- How hazards compounded over time
Hydrograph time-series integration also plays an important role. By stacking river gauge hydrographs onto maps, teams can visualize how inland flooding often peaks days after hurricane winds weaken.
Planning and Resilience Through Better Insight
Hurricanes are incredibly complex events, and the damage they leave behind rarely comes from a single source. Storm surge, flooding, wind, erosion, and infrastructure disruption often overlap in ways that can be difficult to fully understand without strong visualization tools. That’s why maps, graphs, and advanced modeling play such an important role in modern hurricane analysis. They help transform overwhelming amounts of hurricane data into insight that supports better planning, stronger communication, smarter infrastructure decisions, and more resilient communities.
As hurricanes continue impacting regions around the world, the ability to clearly visualize risk, damage, and long-term environmental change will only become more important. The better we understand how hurricanes behave and how their impacts unfold, the better prepared we can become for future storms.
Now we’d love to hear from you: what type of hurricane visualization or analysis do you think provides the most valuable insight for planning and resilience efforts? Leave a comment below and share your thoughts!
Recent Articles
- Aug 26, 2026|Gabbie Rhodes|8 min
Whether you produce visuals every day or only occasionally, small workflow improvements when mapping data can save you significant time.
- Aug 26, 2026|Gabbie Rhodes|8 min
Explore how to create multivariate visualizations for earthquake data so you can easily interpret and share the complete picture with stakeholders.
- Aug 19, 2026|Gabbie Rhodes|9 min
No single measurement exists in isolation with watersheds. Discover how to bring your multivariate hydrological data together.
- Aug 19, 2026|Gabbie Rhodes|7 min
The latest version of Grapher is here! Its new features are designed to help you work more efficiently while delivering greater clarity and impact.