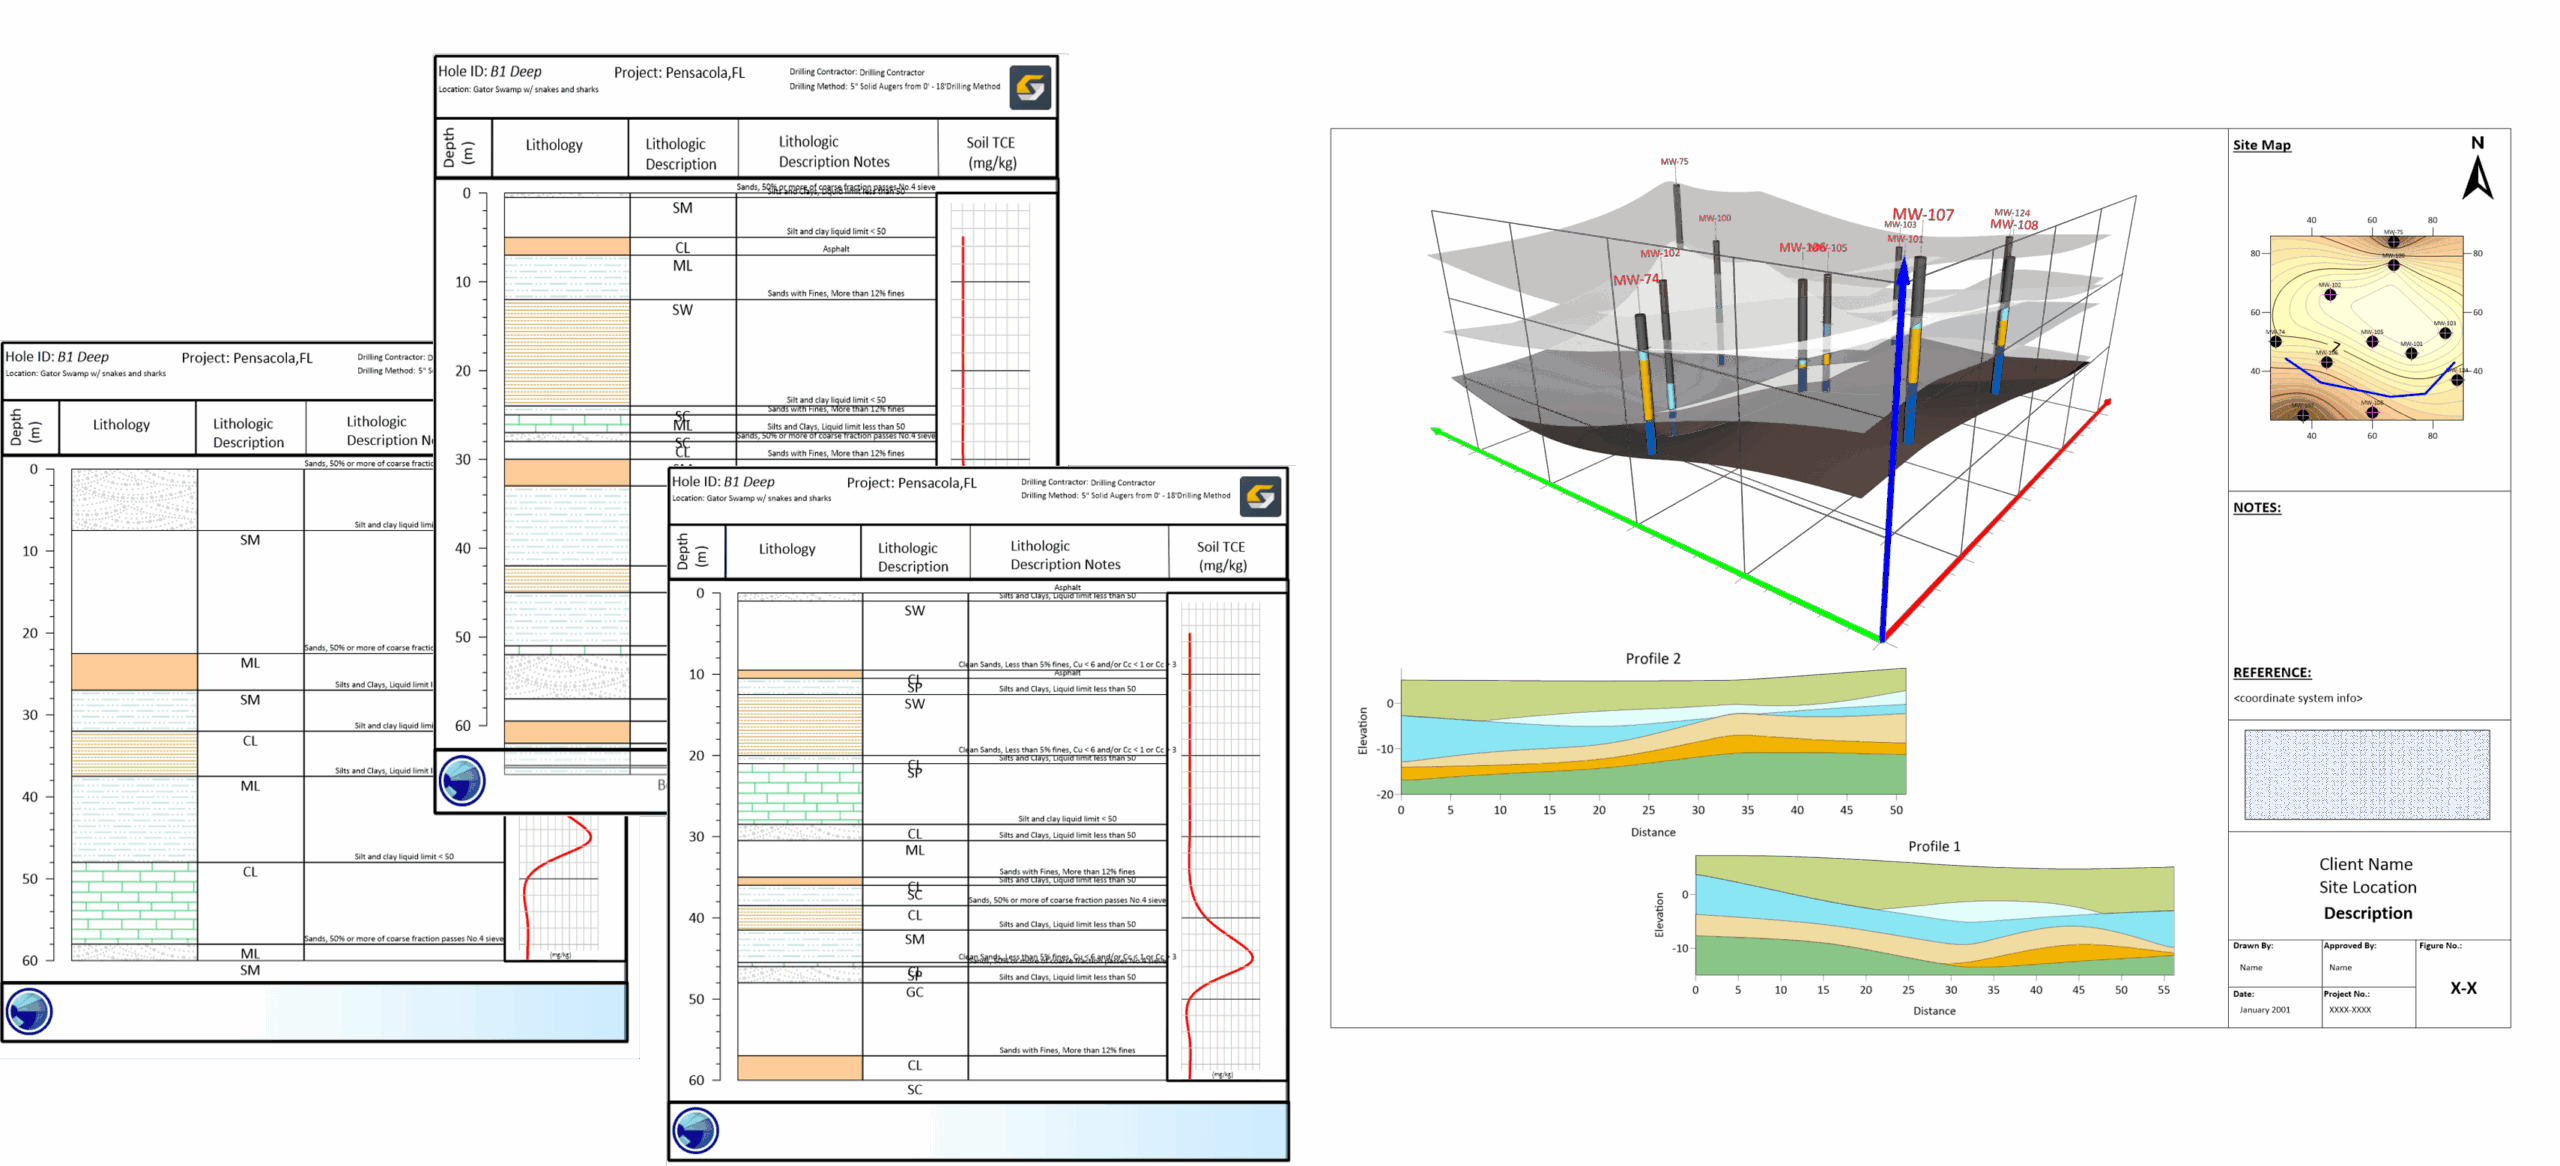
The ability to edit contour lines is one of Surfer’s most highly requested features, and we are pleased to report this feature is available in the latest release!
A contour map is a two-dimensional representation of a surface where the surface is represented by contour lines. A contour line connects points of equal elevation, and the distance between contour lines represents the relative slope of the surface.
![]() |
3D surface map and 2D contour map displayed in Surfer. |
When creating a contour map in Surfer from XYZ data points, the raw data is first interpolated, and a grid file is created. The contour map is then created from the grid file which contains X, Y, and Z values. It is by editing the Z-values in the underlying grid file that one can edit the lines of the contour map.
Why edit contour lines? There may be times when your dataset doesn’t contain enough detail of the area you’re mapping. Other times, the interpolation method used may not work well with your dataset and omit important information. In these situations, you can edit the Z-values in the underlying grid for a more accurate representation of the mapped area.
Surfer’s grid editor window makes it very easy to change grid node values and see how the change affects the contour map. The dialog, as you can see below, displays the individual nodes and will also display the contour lines along with the color fill, if you so choose.
![]() |
Surfer grid editor window. Edit individual grid nodes or apply brush tools to change multiple grid nodes at once. |
Surfer’s grid editing tools are similar to the drawing tools found in Adobe’s Photoshop or other image editing programs. Open the grid you wish to edit, select a tool, and use your mouse to edit the grid directly on your screen. Here is the list of the grid editing tools:
When you select a tool, you can also change the tool settings in the tools options bar at the top of the grid editor window for more control over your grid changes:
In this quick video, you can see me removing a hill from my grid and adjusting the surrounding contours. It’s fun to play around with the grid editor, so give it a try in the Surfer trial! For detailed steps on editing grids, read How can I edit my Surfer grid?
Our Customers
logo-USGS.png
logo-TetraTech.png
http://www.goldensoftware.com/images/logos/logo-TetraTech.png
logo-HazelSawyer.png
https://www.goldensoftware.com/images/logos/logo-HazelSawyer.png
logo-Laguna_Geosciences.png
http://www.goldensoftware.com/images/logos/logo-Laguna_Geosciences.png
logo-Arcadis.png
logo-RockSolidGroup.png
http://www.goldensoftware.com/images/logos/logo-RockSolidGroup.png
logo-StanleyConsultants.png
https://www.goldensoftware.com/images/logos/logo-StanleyConsultants.png
logo-Arm_Geophysics.png
http://www.goldensoftware.com/images/logos/logo-Arm_Geophysics.png
Comments