Templates: Your New Graphing Go-To (Part 4)—How Templates Make Recreating Your Plots Easier
If you’ve ever had to recreate the same plot for a new dataset, you know the pain: it’s tedious, time-consuming, and easy to get wrong. The typical process? Open an old project file and try to remember every customization and setting you used, including custom color bins, axis configuration, and format settings.
Even with the best attention to detail, things can still slip through the cracks. Maybe a color bin isn’t correct, or a scale isn’t consistent. The result is usually confusion, inconsistency, and a lot of time wasted—but there’s a better way to re-create plots.
Templates are designed for reuse and repeatability, helping you recreate graphs with precision and efficiency every time. And in this fourth installment of our Templates: Your New Graphing Go-To series, we’ll explore exactly how they make your recreation process easier.
The Challenge of Recreating Plots Efficiently
First, let’s get clear on the main issue: why is it so difficult to recreate a plot? On paper, it should be simple. Just open your old project file, swap in the new data, and you’re done. But in reality, it’s rarely that straightforward. Once you open an old file, it’s usually unclear what was customized, which object links to what, why certain decisions were made, or how different elements were formatted.
Before long, you’re retracing every step—tweaking colors, resizing axes, and rechecking scales—just to get your new graph to look like the old one. You end up spending more time deciphering your previous setup than actually creating the updated version, turning what should be a quick process into a frustrating exercise in guesswork.
Templates: The Key to Fast, Consistent Recreation
If old project files slow you down, templates do the exact opposite. They’re built for reuse and repeatability, giving you the structure you need to quickly achieve your desired result. You don’t have to figure out what steps to take to recreate a plot. With templates, the essentials are already intact: your axis configurations, legend placement, label styles, plot type, and formatting choices. You’re not guessing how things were built but starting from a proven, consistent foundation.
All you have to do is import your new data. The template will automatically update with your latest information, maintaining the same look and layout as before. From there, you can make any small adjustments or customizations you need, saving valuable time while ensuring every plot you produce looks consistent and professional.
Tech Tip: Templates aren’t the only tool ensuring you spend less time figuring out how to recreate a plot. You can also speed up your recreation process by leaving comments directly on your visual (in Grapher), including insights about your workflow, regulatory notes, column requirements, and any customizations you made. That way, if you create a graph or chart and need to re-create it months later, you have notes explaining the exact steps to take.
From Hours to Minutes: A Geologist’s Experience With Templates
To see how templates make recreating plots easier, imagine a geologist who runs quarterly water quality reports. Every few months, they need to create a series of plots showing seasonal contaminant levels. In the past, that meant reopening old project files, trying to remember the customizations and settings they used, and then manually adjusting everything to match their previous visuals.
Now, they simply open a water-related template. With the structure and formatting already set, all they have to do is populate it with their new data. Within minutes, the box plots are complete, only requiring customizations if necessary. There’s no rework or guesswork. Just fast, reliable results that maintain the consistent style you want to achieve.
Related Resources
Recreate With Confidence, Every Time
When it comes to recreating plots, templates make the process both efficient and accurate. Instead of spending hours reverse-engineering old project files, you can start from a reliable foundation built for repeatability. With templates, every plot you recreate will look sharp, consistent, and ready to impress stakeholders, no matter how many times you have new data.
Recent Articles
- Jul 15, 2026|Gabbie Rhodes|4 min
Technology has advanced, and now, Surfer has taken the lead over Voxler. Learn how to convert your Voxler file to a Surfer file to get better results.
- Jul 15, 2026|Gabbie Rhodes|12 min
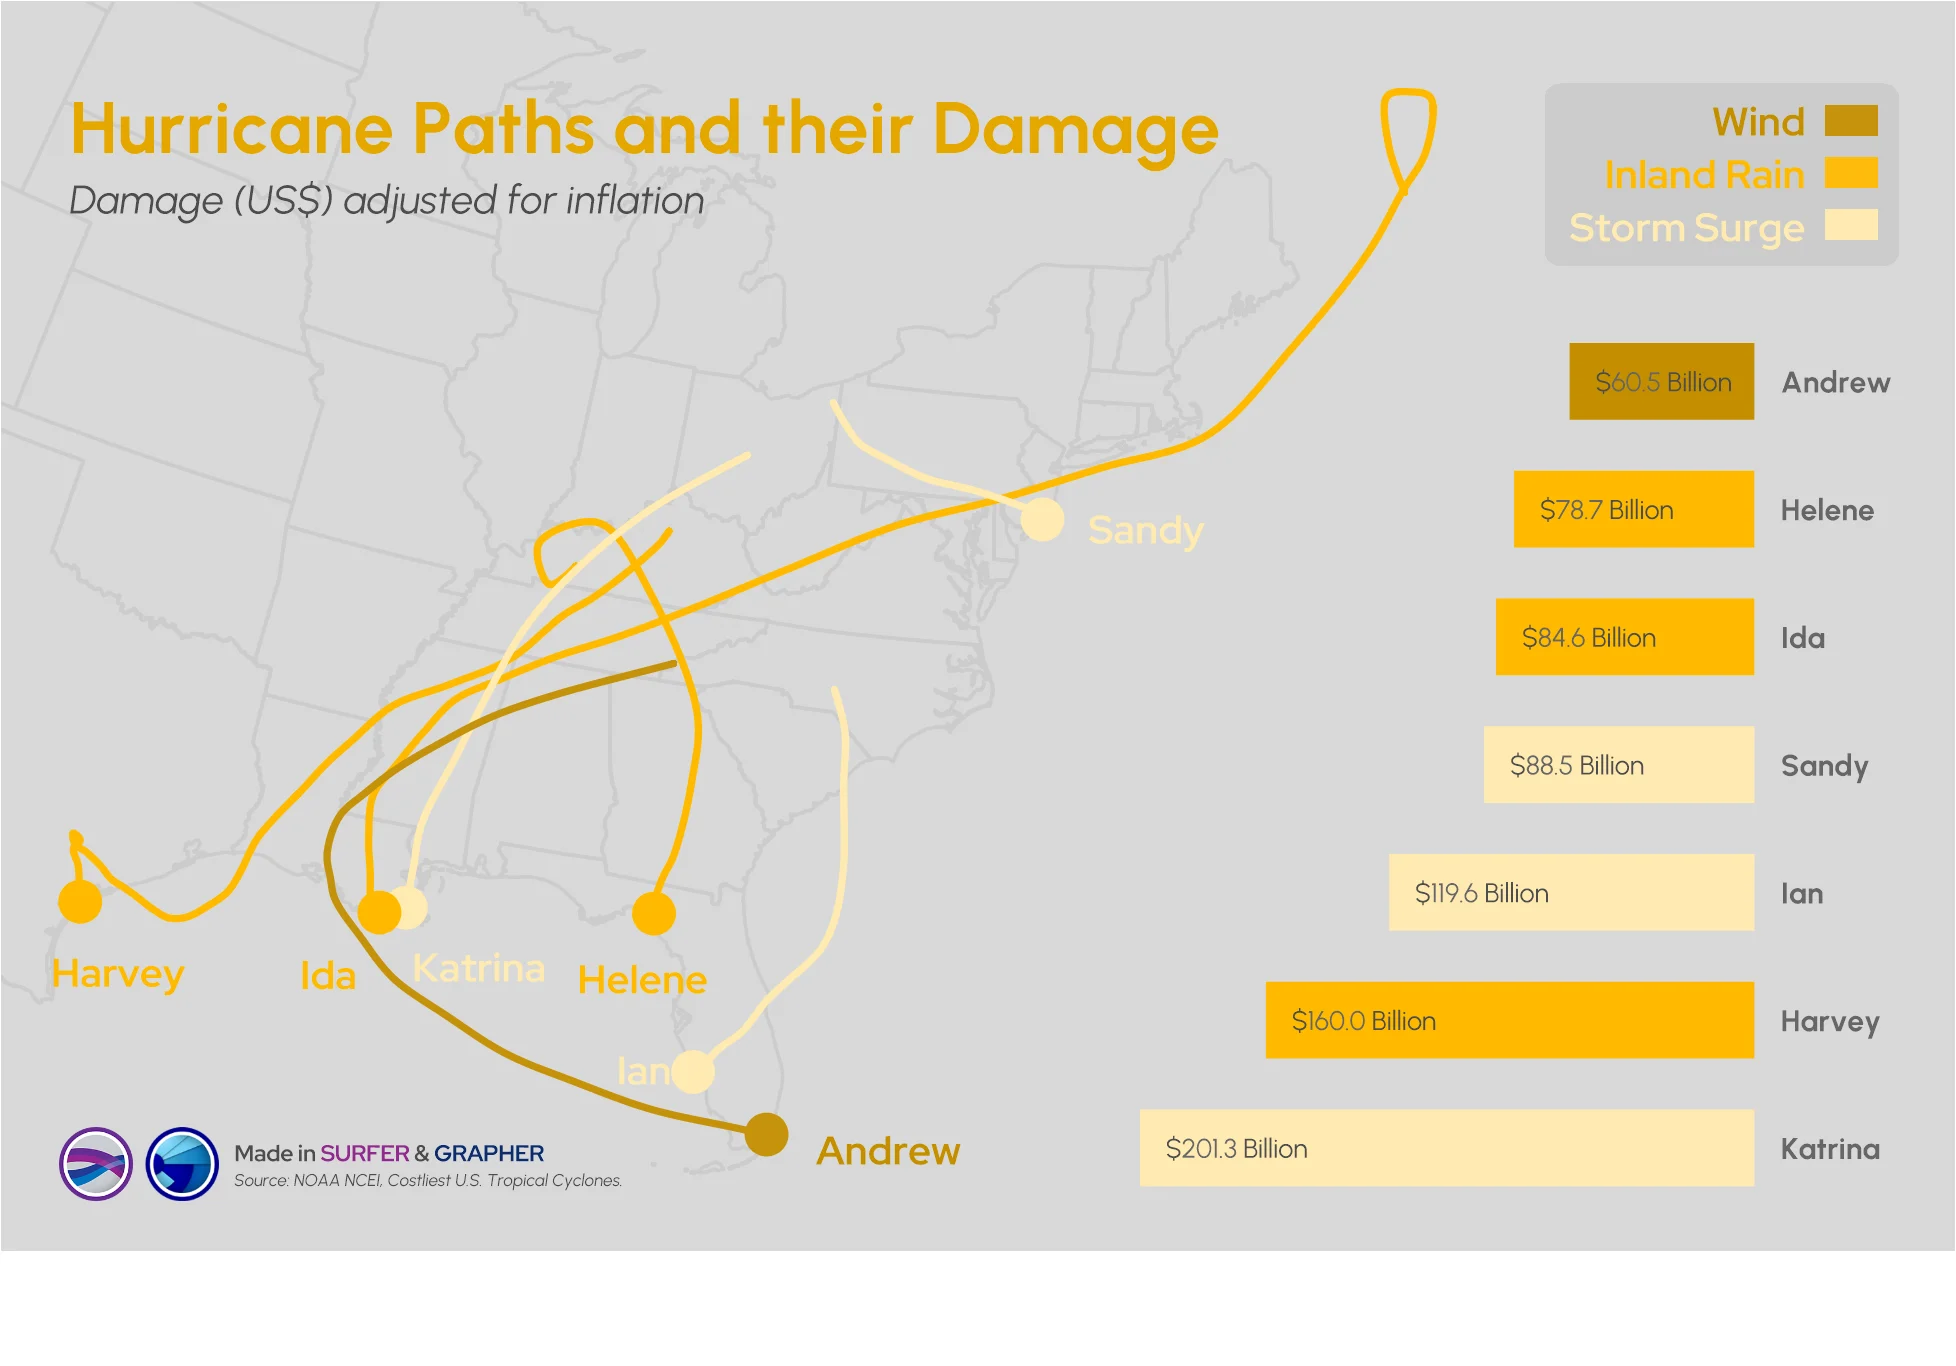
Answering this question isn't easy: what damage can a hurricane cause? Multiple factors come into play, but maps and graphs can provide insight.
- Jul 8, 2026|Gabbie Rhodes|14 min
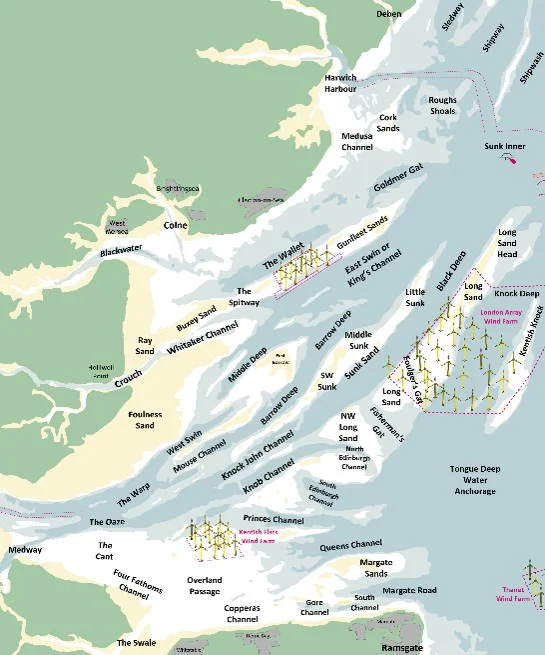
Roger creates passage and tide tables that help mariners understand when and how they can move through the Thames Estuary’s swatchways.
- Jul 8, 2026|Gabbie Rhodes|10 min
Effective data communication is about making your maps and models easy to understand, and there are ways to achieve that goal. Discover the tips!