Unpacking 3D Data Visualizations: 3D View vs 3D Surface Maps
In geoscience and engineering, 3D data visualizations are essential. Whether you’re modeling subsurface geology, evaluating terrain, or presenting volumetric data to stakeholders, the way you visualize spatial relationships directly influences how well you understand and communicate your findings.
For many professionals, the go-to option is a 3D surface map. It adds dimension, depth, and perspective to traditional 2D outputs. But here’s where confusion often begins: a 3D surface map is frequently treated as a complete 3D solution. In reality, there’s a meaningful difference between viewing a 3D surface and exploring your data in a true 3D environment. That difference affects how accurately you interpret spatial relationships, how easily you identify patterns, and how clearly you communicate complex data to stakeholders.
What Is a 3D Surface Map? The Static Snapshot
Let’s start by defining a 3D surface map.
A 3D surface map is a single, continuous surface derived from gridded data, where the Z value is expressed as height. In other words, each X–Y location on the grid is assigned a vertical value, creating a raised surface that visually represents variation across space. It’s one of the most common ways to add depth to spatial data.
But while a 3D surface map looks three-dimensional, it’s important to understand what it actually is and what it isn’t. Here are a few elements that define a 3D surface map.
The “2.5D” Reality
A 3D surface map has two things: a surface generated from gridded data and a Z value to represent height. While it adds a professional aesthetic to a report, it is fundamentally a “2.5D” visualization.
This term refers to the mathematical constraint of the environment: for any given X–Y coordinate, there can only be exactly one Z value. Because the map exists within a traditional 2D framework, it cannot model overlapping features or complex subsurface horizons.
Visually, this limitation is often masked by a “Fill-Down” or “Skirt” effect, where the space beneath the surface is filled with a solid color down to a baseline. While this creates the appearance of a solid block, it reinforces the fact that you are looking at a single, opaque shell rather than a realistic environment. However, this feature can be used to your advantage to create multi-layered block diagrams.
By stacking multiple independent 3D surfaces and filling each down to the next layer, you can produce a more complete visual where each color represents a specific geological unit. While this setup is rigid—requiring you to carefully order layers—it’s helpful in communicating subsurface relationships in a static format.

Fixed Perspective
Once a 3D surface map is placed on the page, its perspective is typically predefined. You’re viewing the surface from a chosen angle, but that angle is fixed.
You cannot freely rotate the map, tilt it, or explore it from beneath or behind once it has been exported or embedded in a report. What the viewer sees is what the creator selected in advance.
That limitation matters when interpretation depends on perspective. Certain ridges, depressions, or gradients may appear more or less pronounced depending on the viewing angle, but the viewer cannot investigate alternative viewpoints.
Limited Coordinate Support
Traditional 3D surface maps offer limited support for coordinate system transformations. While they effectively display gridded data within a given coordinate framework, they aren’t built to support projects that have different datasets with varying spatial references. The datasets will not overlay accurately.
When Does a 3D Surface Map Work Well?
Despite the limitations, 3D surface maps are not inherently flawed. In some cases, they’re useful. They can be effective in these types of scenarios:
- You are visualizing a single variable across a surface (such as topography or elevation)
- You want to create a block diagram to illustrate geological strata in a static format
- You do not need to see beneath, around, or through the object
- The goal is to create a quick, visual representation of spatial variation
For a simple topographic hill or a straightforward elevation model, a 3D surface map can provide clarity without unnecessary complexity.
What is 3D View? The True 3D Environment
Now, what exactly is 3D View?
Unlike a 3D surface map—which presents a single raised surface within a 2D framework—3D View is a true three-dimensional environment that exists within Surfer. Data has an actual X, Y, Z coordinate system, meaning every object occupies real space and can be explored interactively. Instead of looking at a static snapshot, you’re stepping into a model. Here’s more insight on what to know about 3D View.
Easy, Interactive Navigation
One of the most immediate benefits of 3D View is navigation. In a 3D View environment, users can do the following:
- Rotate the model freely
- Zoom in or out with precision
- Tilt the scene to inspect slopes, boundaries, or intersections
- View the model from underneath the surface
This freedom of movement dramatically changes interpretation. Features that may appear subtle or distorted from one angle can become obvious from another. Instead of accepting a predefined viewpoint, you can investigate the data from multiple perspectives until the spatial relationships make sense.
Intuitive Drillhole Visualization
One of the most critical advantages of 3D View is the ability to visualize boreholes and drillholes in their true context. In a 2D or 2.5D map, a drillhole is merely a point on a surface. In 3D View, you can see the depth of the interval as it penetrates the terrain.
This equips you to visually correlate surface anomalies with subsurface data. You can observe exactly where a drillhole intersects a water table or a geological contact, providing a level of intuitive interpretation that a single surface cannot offer.
Multi-Layered, Holistic Models
The 3D View can display multiple data types interacting within the same space. Within this environment, you can layer these elements:
- Multiple surfaces, such as topography and groundwater elevation
- Vector files like roads, property boundaries, or infrastructure
- Drillholes and borelogs
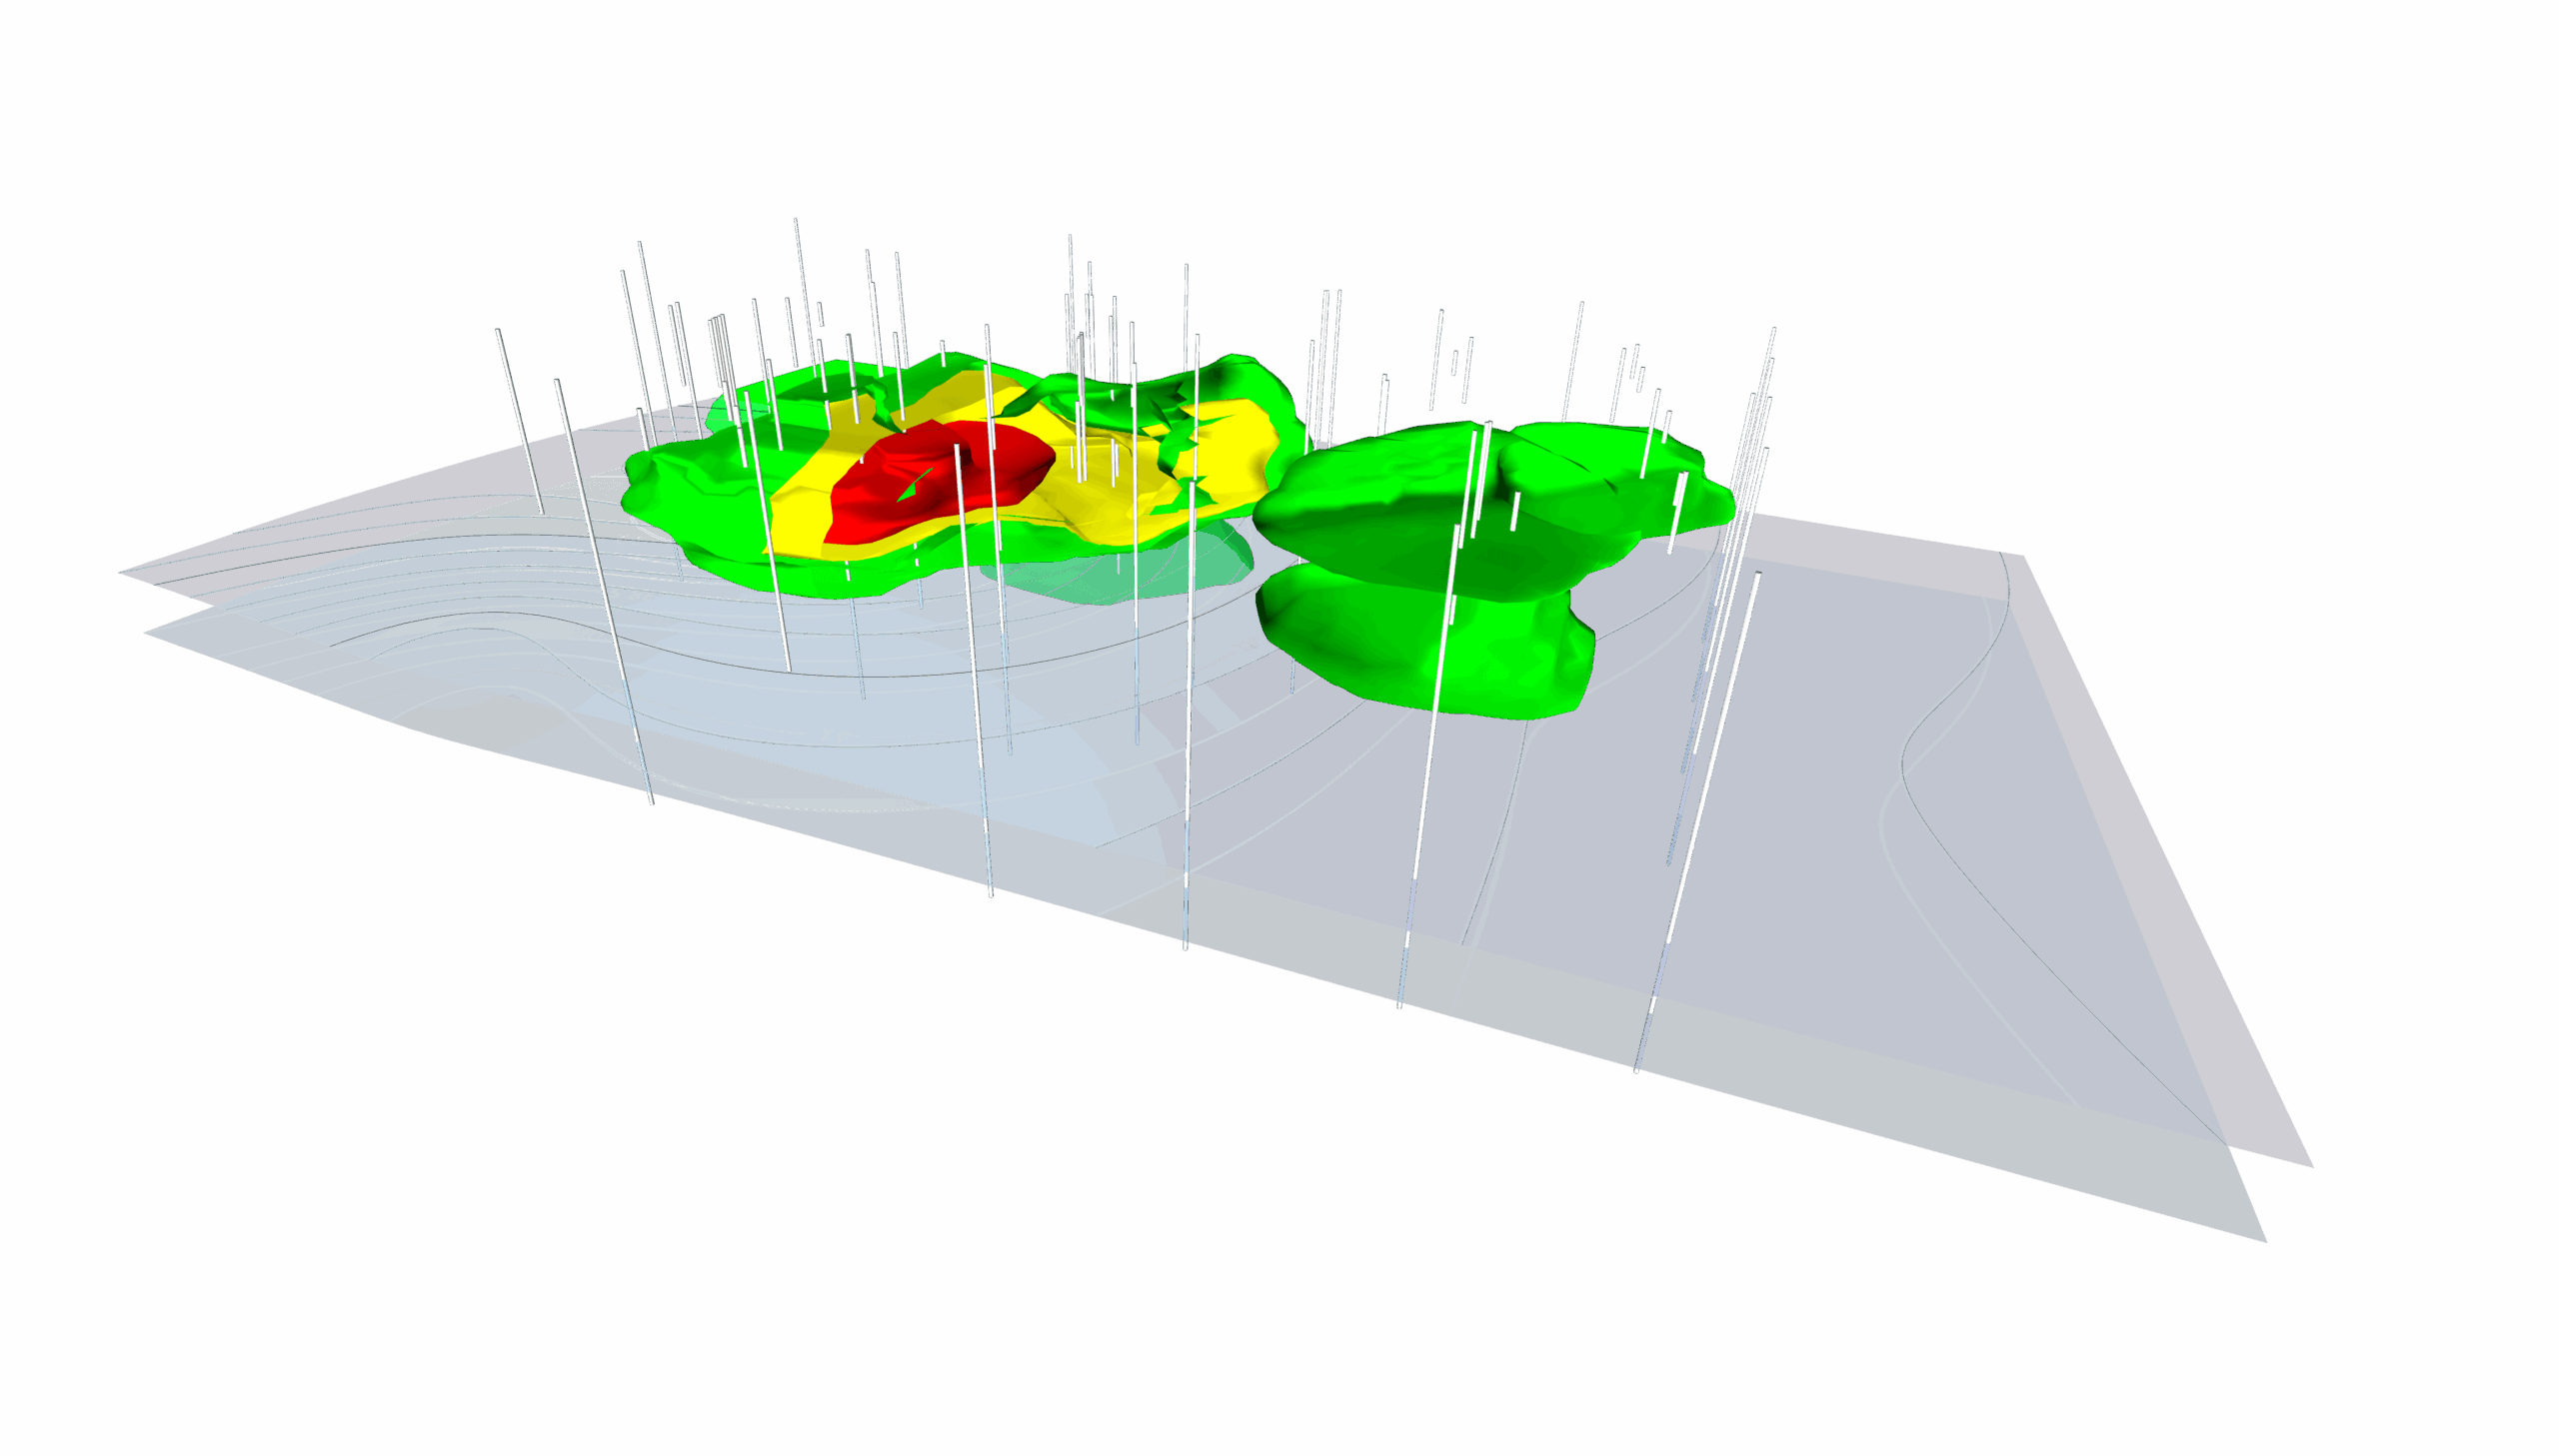
- True 3D volumes, such as contaminant plumes or subsurface bodies
This layered approach allows you to see how datasets intersect and influence one another. Instead of evaluating surfaces in isolation, you observe relationships in context. For example, you can visually assess whether a drillhole intersects the predicted water table at the expected depth, something that is far more intuitive in a true 3D environment than on a static surface.
Full Coordinate System Support
Another critical benefit of 3D View is coordinate system support. 3D View fully supports coordinate systems, empowering you to take data from different sources—such as WGS84 drone imagery, NAD83 survey data, and local LiDAR scans—and align them accurately in the same 3D space.
Instead of manually reprojecting files or dealing with “shifted” surfaces, 3D View handles the transformations in real-time. This ensures that your vectors, surfaces, and volumes are positioned correctly relative to one another, making it an essential environment for integrated project analysis.
Lighting and Transparency
3D View also enhances visual depth through adjustable lighting and transparency controls. With these tools, you can accomplish tasks such as:
- Making a topographic surface semi-transparent to expose contaminant plumes
- Viewing infrastructure from satellite imagery in relation to subsurface features
- Highlighting specific layers while de-emphasizing others
These visual tools support clearer interpretation and more effective communication, and make your final output more visually engaging.
When Does 3D View Work Well?
Undoubtedly, 3D View becomes essential when you need to clearly analyze and communicate spatial interaction. This digital environment is particularly valuable in scenarios such as the following:
- When you need to see how multiple datasets intersect
- When subsurface relationships matter as much as surface variation
- When stakeholders need to understand complex spatial interactions intuitively
In short, 3D View empowers exploration to enhance analysis and communication. It fundamentally changes how you see and share your data with stakeholders.
Side-by-Side Comparison of 3D Data Visualizations
At this point, the differences between a 3D surface map and a true 3D View might feel clear conceptually. But sometimes, the fastest way to understand the distinction between these 3D data visualizations is to see it summarized side by side.
The table below highlights the key differences in structure, capability, and communication impact so you can quickly identify which environment best fits your analytical and storytelling needs, and 3D View often wins.
| Feature | 3D Surface Map | 3D View (True 3D Environment) |
|---|---|---|
| Core Definition | A single continuous surface derived from grid data where Z is expressed as heigh | A true 3D environment where data exists in X, Y, and Z space and can be explored interactively |
| Dimensional Reality | “2.5D” — a 2D interface with 3D appearance | Fully three-dimensional coordinate system |
| Perspective | Fixed viewing angle once placed/exported | Fully rotatable, zoomable, and tiltable from any angle |
| Subsurface Visibility | Cannot see beneath or around the surface | Can view from underneath, inside, or behind surfaces |
| Data Layers | Typically one surface at a time but can create block diagrams to show layers in a static format | Multiple surfaces, vectors, drillholes, and 3D volumes layered together |
| Volumetric Support | No true 3D volumes | Supports volumetric models (e.g., plumes, subsurface bodies) |
| Lighting and Transparency | Limited styling; solid “fill-down” effect common | Adjustable lighting and transparency to reveal hidden features |
| Coordinate System Support | Limited transformation/reprojection flexibility | Full coordinate system support; aligns GPS, drone, LiDAR, and other datasets in true 3D space |
| Cognitive Load | Requires mental reconstruction of hidden relationships | Shows relationships directly, reducing cognitive load |
| Pattern Recognition | Dependent on preset angle | Enhanced through interactive rotation and inspection |
| Communication Strength | May require explanation to interpret correctly | More intuitive for stakeholders; supports walkthroughs and demonstrations |
| Presentation Options | Static images for reports | Interactive 3D PDFs, recorded videos, fly-throughs, live model navigation |
| Best Use Case | Simple, single-variable surface visualization (e.g., elevation hill) | Complex, multi-layered analysis requiring spatial interaction |
The Right Tool for the Story You’re Telling
At first glance, a 3D surface map and a 3D View can look similar. Both add depth. Both elevate your data beyond flat, 2D outputs. But as we’ve explored, the environment itself changes the story.
A 3D surface map offers a clean, efficient way to visualize a single surface. For straightforward elevation models or single-variable analyses, it might be a good solution. But when your work involves layered datasets, subsurface relationships, coordinate alignment, or stakeholder interpretation, a true 3D environment transforms how insights are discovered and communicated.
Now we’d love to hear from you: What types of projects do you work on that make 3D View essential to use?
Drop your thoughts in the comments below. Your insight might help another geoscientist decide which format best fits their next project!
Recent Articles
- Jul 15, 2026|Gabbie Rhodes|4 min
Technology has advanced, and now, Surfer has taken the lead over Voxler. Learn how to convert your Voxler file to a Surfer file to get better results.
- Jul 15, 2026|Gabbie Rhodes|12 min
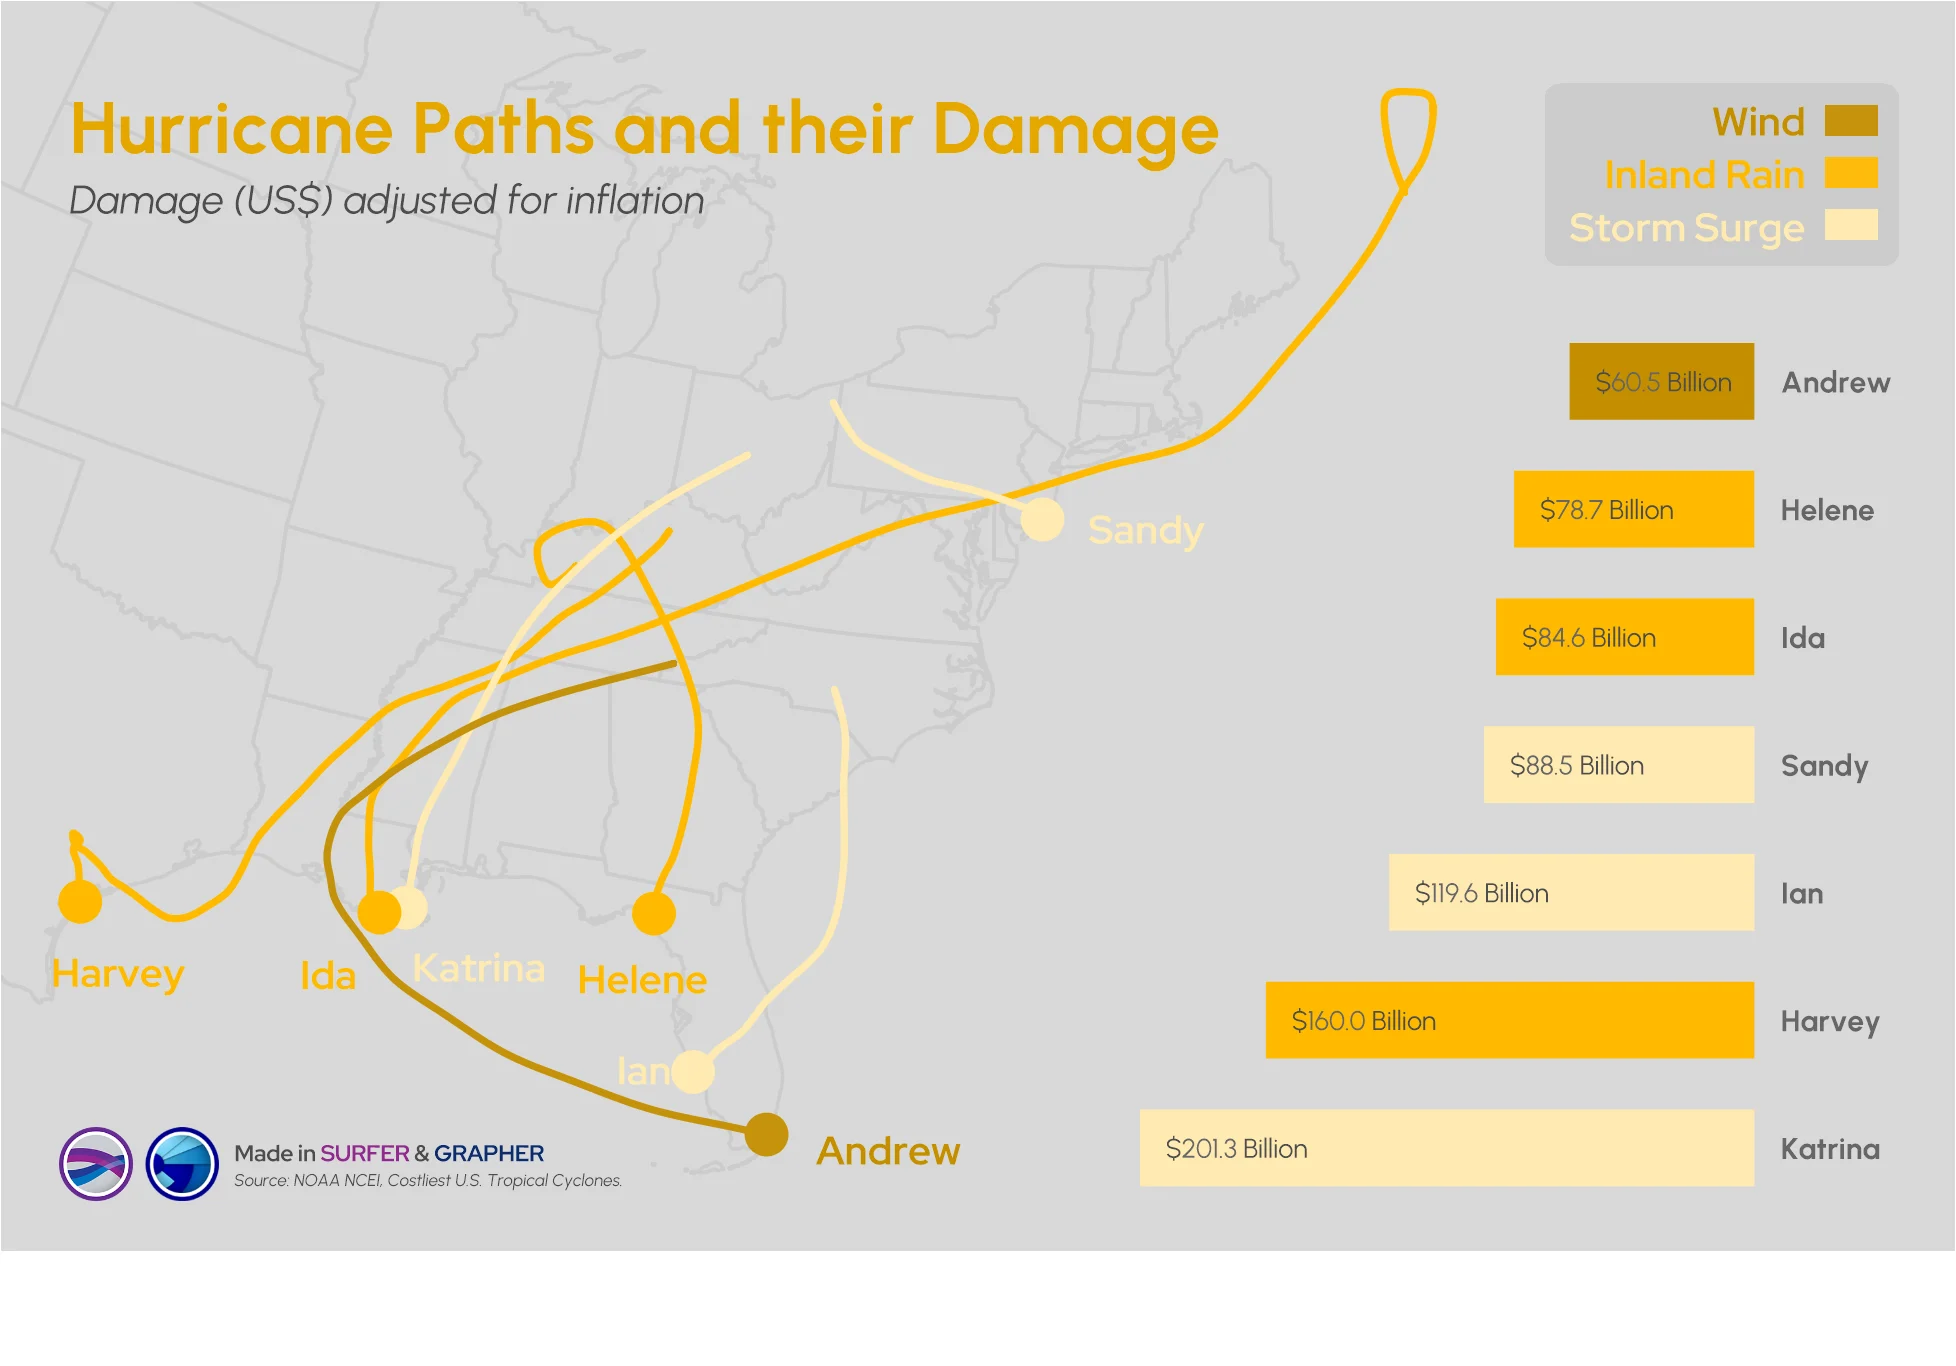
Answering this question isn't easy: what damage can a hurricane cause? Multiple factors come into play, but maps and graphs can provide insight.
- Jul 8, 2026|Gabbie Rhodes|14 min
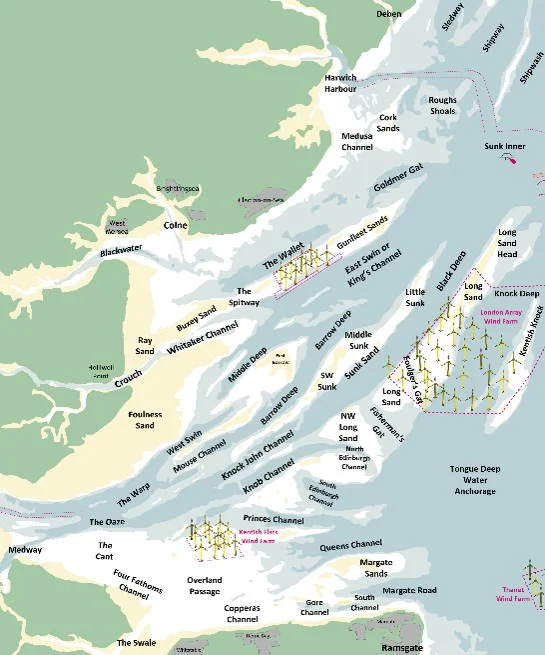
Roger creates passage and tide tables that help mariners understand when and how they can move through the Thames Estuary’s swatchways.
- Jul 8, 2026|Gabbie Rhodes|10 min
Effective data communication is about making your maps and models easy to understand, and there are ways to achieve that goal. Discover the tips!