Webinar Recap: Mastering Coordinate Systems & Map Projections in Surfer
Coordinate systems and map projections are foundational to every mapping project, yet they remain a common source of frustration for geoscientists, engineers, and GIS professionals. Data that won’t align, maps that display in the wrong location, and uncertainty about which coordinate system or projection to use typically derail an otherwise straightforward project.
To help address these challenges, our Senior Technical Sales Specialist Drew Dudley hosted a live webinar, Master Coordinate Systems & Map Projections in Surfer. During the session, Drew walked through the key concepts, workflows, and best practices that help ensure data displays accurately and consistently throughout a project.
Whether you missed the webinar or want a refresher on the most important takeaways, this blog provides a recap distilling the practical guidance shared during the session to help you work with greater confidence when managing coordinate systems, projections, and spatial data in Surfer.
Rules of Thumb: Choosing the Right Map Projection
Before focusing on a coordinate system or assigning a projection, Drew encouraged a foundation step: take a step back and think about the end goal of your project.
One of the most common mistakes occurs when teams think they should keep data in whatever coordinate system it arrived in. For example, a stakeholder may provide data in latitude and longitude, or you might download a dataset from an online repository that’s already assigned to WGS84. While this information is valuable, it doesn’t automatically mean that a specific coordinate system is the best choice for mapping, analysis, or modeling.
As Drew explained, the best way to choose your coordinate system is to determine how you’ll use your data. Here are some scenarios when geographic coordinate systems and projected coordinate systems work best.
When geographic coordinates make sense
Geographic coordinate systems, such as latitude and longitude, are often the right choice for projects covering very large areas.
They work especially well in situations such as:
- Small-scale regional, national, or global maps
- Projects spanning more than 6 degrees of longitude
- Maps at scales of 1:1,000,000 or smaller
- Global data exchange and sharing
- GPS, marine navigation, and aviation workflows using WGS84
- Polar mapping projects outside standard UTM zone limits
Because geographic coordinates provide a universal reference system, they are often the preferred format when data needs to move between organizations, software packages, and navigation systems.
When it’s time to use a projected coordinate system
For engineering, environmental, and site-scale projects, Drew recommended moving to systems such as UTM or State Plane because they use consistent linear units like meters or feet. Unlike latitude and longitude, these coordinate systems maintain uniform distance measurements across a map, making them far more suitable for detailed analysis and modeling.
Projected coordinate systems are often the best fit for:
- Engineering site plans
- Infrastructure projects
- Environmental investigations
- Detailed topographic mapping
- Large-scale local studies
The key advantage is that every unit on the map represents a consistent physical distance. This creates a predictable, square-grid framework that supports accurate measurements, calculations, and modeling workflows.
A critical warning for 3D projects
One of the most important takeaways from the webinar involved working in 3D.
While geographic coordinates work well for many mapping applications, they can create significant problems in 3D environments. That’s because mapping software assumes that units in the X, Y, and Z directions all represent the same physical distance.
Latitude and longitude don’t satisfy that requirement. The physical distance represented by a decimal degree changes depending on where you are on Earth. As you move toward the poles, a degree covers a different distance than it does near the equator. Meanwhile, elevation data is typically measured in feet or meters.
The result is a mismatch between horizontal and vertical scaling.
To avoid this issue, Drew recommended reprojecting data into a linear coordinate system—such as UTM or State Plane—before opening the 3D View in Surfer. Doing so ensures that horizontal and vertical measurements are using compatible units, resulting in more accurate scaling and a more reliable 3D visualization.
Understanding Source vs. Target Coordinate Systems
After selecting the right spatial baseline for your project, the next step Drew emphasized was understanding how Surfer manages coordinate systems behind the scenes. One of the concepts Drew explained was the distinction between Source and Target coordinate systems, as understanding their relationship was key to working confidently with data from multiple sources. Here’s some of the insight Drew shared in the webinar.
Source coordinates: where the data came from
Every spatial dataset begins with a coordinate system assigned by the person or organization that originally collected the data. In Surfer, this is known as the Source Coordinate System.
Examples of this type of coordinate system are the following:
- A GPS dataset collected in WGS84 latitude and longitude
- A local engineering survey that used State Plane coordinates
- A government dataset distributed in a UTM zone
The Source Coordinate System remains tied to that specific file or map layer and tells Surfer how the data was originally created.
Target coordinates: how the final map is displayed
The Target Coordinate System serves a different purpose.
Rather than describing an individual dataset, the Target Coordinate System defines the overarching spatial framework used by the entire Map Object. In other words, it controls how the final map is displayed on screen and how it will be exported.
This distinction is important because the Target Coordinate System does not need to match every individual layer’s Source Coordinate System. In fact, one of Surfer’s biggest strengths is its ability to work with datasets that originate from multiple coordinate systems simultaneously.
Quick tips and tricks
If you need to reproject an entire map into a different coordinate system, Drew also demonstrated a straightforward workflow within the Map Object’s Coordinate System settings. After selecting a new Target Coordinate System, he demonstrated how Surfer automatically reprojects the map display so all layers align within the new spatial framework.
Additionally, Drew shared a practical tip for users who frequently work with the same projections: add commonly used coordinate systems to your Favorites list. This makes it much faster to access preferred systems in future projects without repeatedly searching through the full coordinate system library.
Navigating Surfer’s Coordinate System Library
Once you determine the appropriate spatial framework for your project, the next step is locating it within Surfer. Inside the Assign Coordinate System dialog, Surfer organizes thousands of global choices into two distinct predefined directories: geographic systems and projected systems.
However, before clicking “OK” in the dialog box, Drew highlighted an often-overlooked best practice: always review the coordinate system parameters displayed at the bottom of the window. This metadata pane exposes the underlying mathematical definitions of your projection, including the central meridian, scale factor, false easting, and datum transformations. Double-checking these parameters ensures you are choosing the exact regional variation required for your project before executing a grid or overlay workflow.
Practical Coordinate System Workflows Demonstrated During the Webinar
After covering the fundamentals of coordinate systems, Drew shifted gears and walked through several practical workflows for real-world projects. These demonstrations focused on a simple goal: helping you confidently manage coordinate systems as data moves between collection, analysis, modeling, and final deliverables.
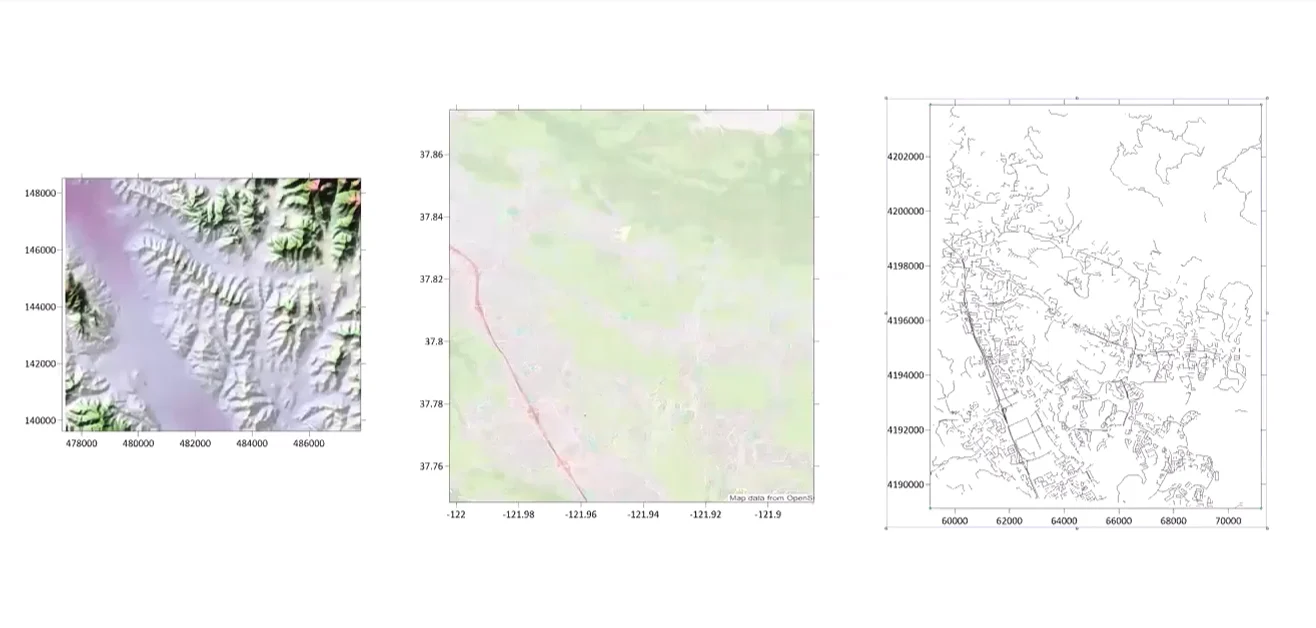
Overlaying data with different coordinate systems (Timestamp – 21:25)
One of the most common challenges occurs when multiple datasets arrive in different coordinate systems—or when one of the datasets doesn’t have a coordinate system assigned at all.
For example, a project might include:
- An elevation model in State Plane coordinates
- A raster image in Web Mercator
- A road network layer with no assigned coordinate system
Before attempting to overlay the data, Drew emphasized the importance of assigning a Source Coordinate System to any unassigned layers. Without this information, Surfer has no way of knowing how the data should be positioned relative to the other layers. Once each layer has an assigned Source Coordinate System, Surfer can handle the reprojection automatically.
Drew also shared a useful shortcut for combining layers. Rather than navigating through multiple overlay commands, users can simply drag a layer into an existing Map Frame within the Contents window. Surfer then automatically reprojects the layer to match the Map Frame’s Target Coordinate System while preserving the original Source Coordinate System associated with the data. This approach makes it much easier to combine datasets collected from different sources without manually converting every file beforehand.

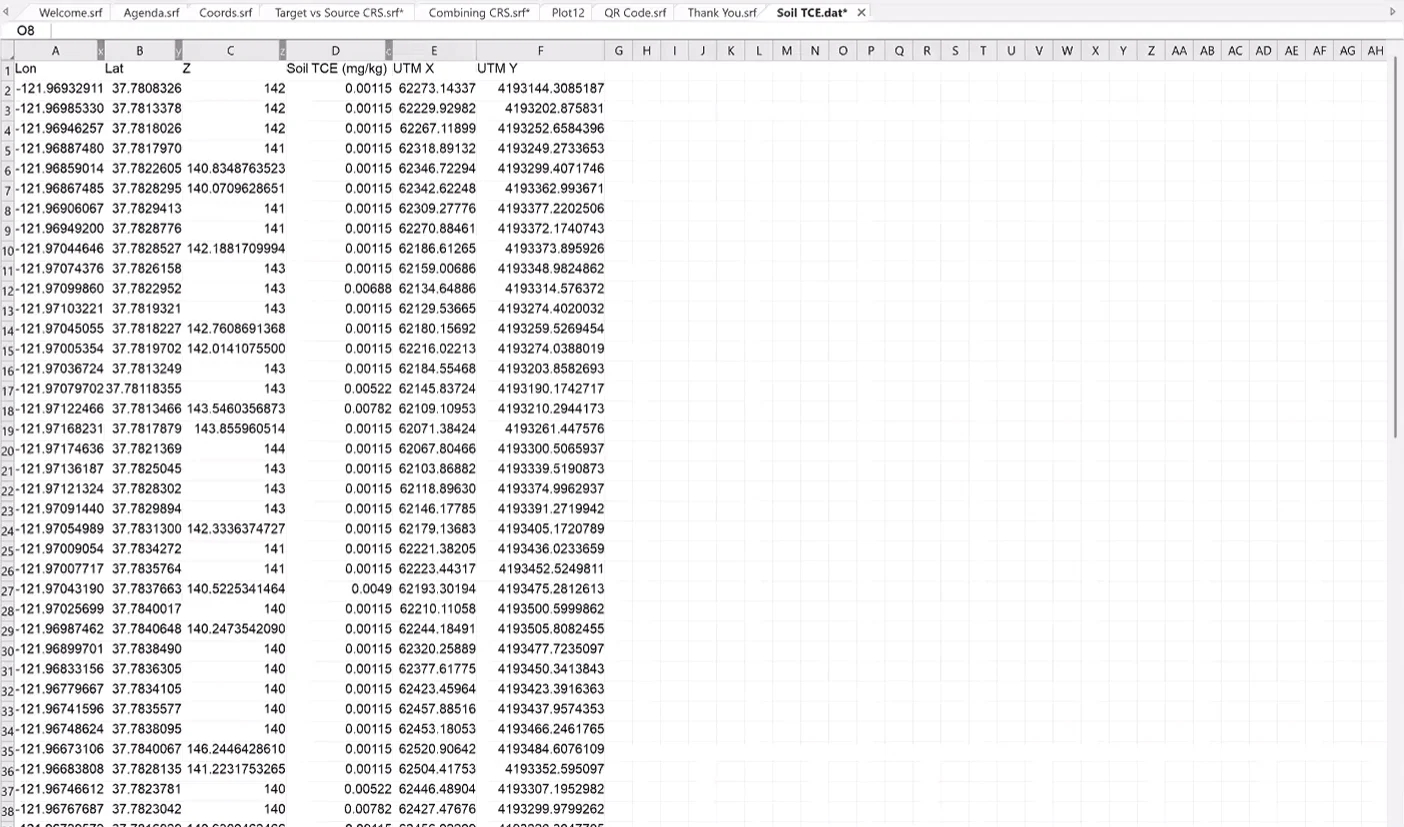
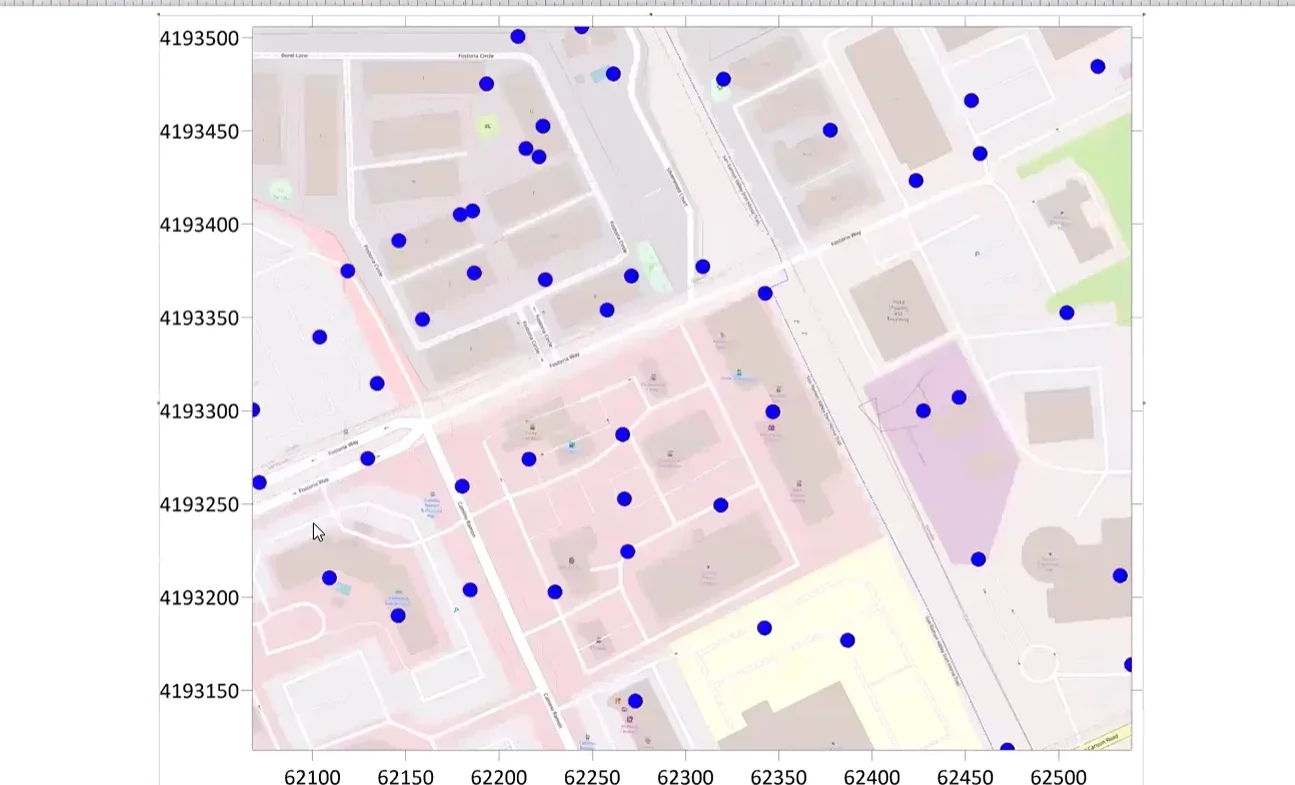
Reprojecting raw data before gridding (Timestamp – 32:35)
Another workflow Drew demonstrated involved reprojecting raw coordinate data before creating a grid. This is particularly useful when working with field-collected data such as:
- Well locations
- Soil sampling results
- Groundwater measurements
- Environmental monitoring data
Using Surfer’s worksheet tools, users can define the coordinate system currently associated with the data and then calculate a new set of coordinates in the desired projection. The result is a dataset that is already optimized for interpolation and gridding within the preferred coordinate system. As Drew explained, performing this step early in the workflow can help simplify later analysis and reduce the likelihood of coordinate-related issues during map creation.
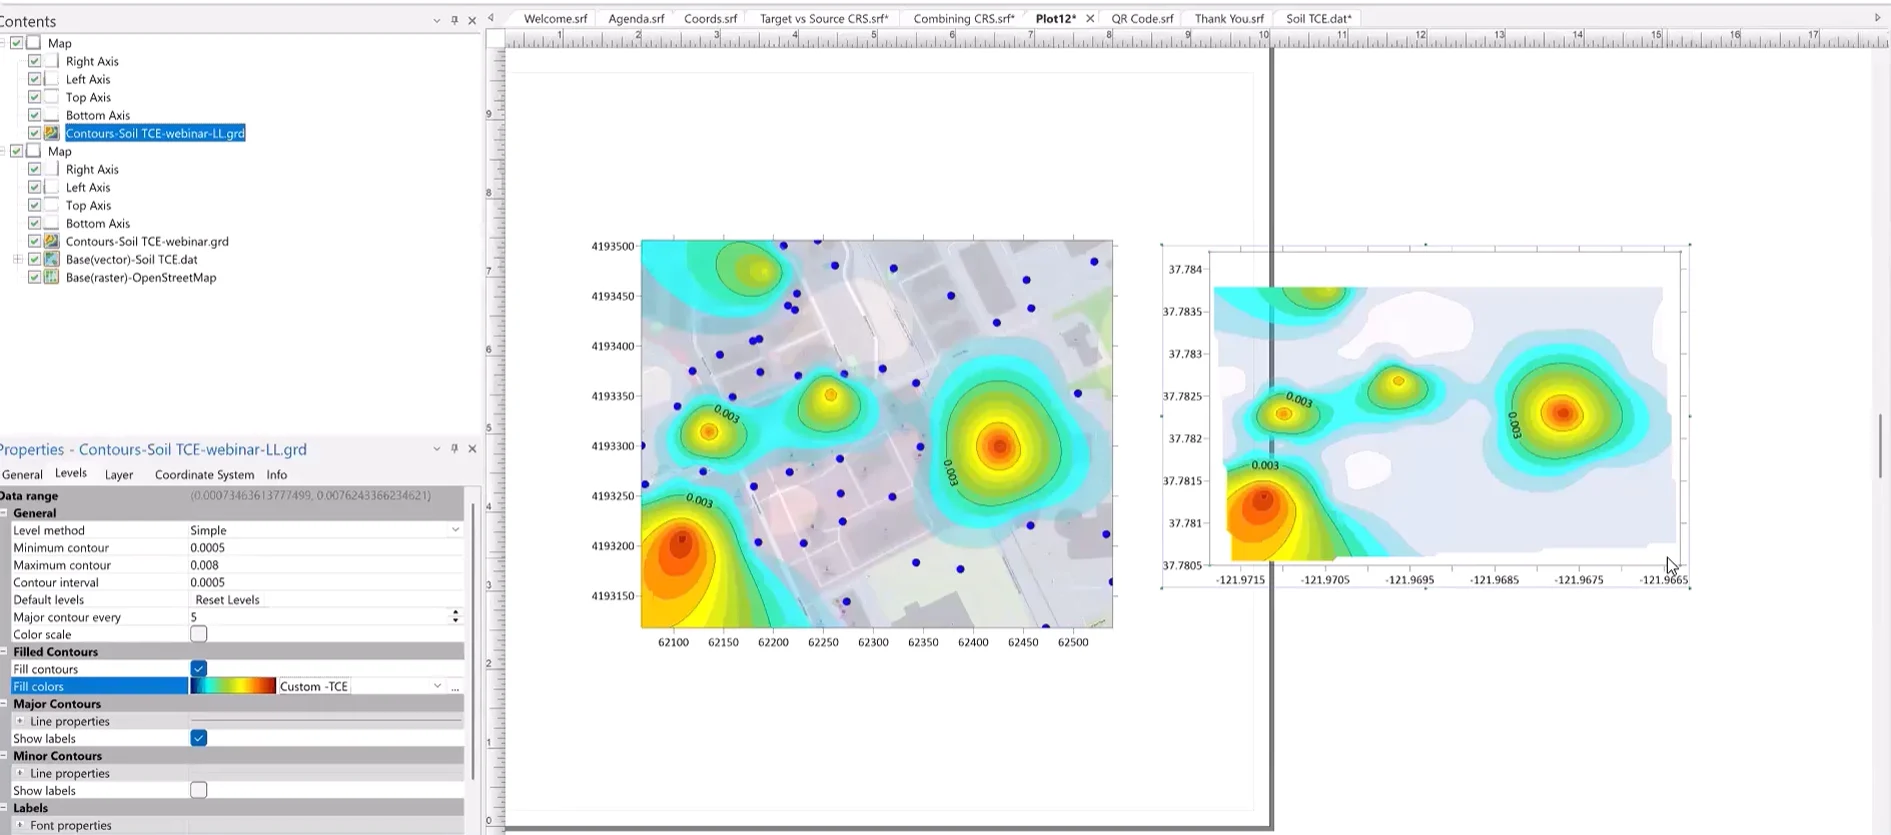
Reprojecting existing grid files (Timestamp – 45:05)
Sometimes the data has already been gridded, but the final deliverable requires a different coordinate system. For these situations, Drew demonstrated Surfer’s Grid Project functionality, which allows users to convert an existing grid directly into a new coordinate system.
Rather than rebuilding the grid from scratch, you can:
- Define the grid’s current coordinate system
- Specify a target coordinate system
- Create a new projected grid file
This workflow is particularly useful when collaborating with external teams, delivering data to stakeholders, or adapting an existing project to new coordinate system requirements.
Modifying projected units (Timestamp – 48:11)
The final workflow addressed a less common—but sometimes critical—requirement. Occasionally, stakeholders may ask you to display coordinates using different linear units than the projection normally uses. For example, a project using a standard metric UTM coordinate system may need to be presented in feet rather than meters.
Drew demonstrated how Surfer equips you to modify the unit designation associated with a projected coordinate system directly within the Assign Coordinate System dialog. By adjusting the linear units, the map coordinates and axis labels automatically update to reflect the new unit system, making it easier to satisfy project-specific reporting or stakeholder requirements without rebuilding the map.
Collectively, these workflows highlighted an important theme throughout the webinar: coordinate system management doesn’t have to be complicated. When Source and Target coordinate systems are assigned correctly, Surfer provides several tools that simplify reprojection, layer alignment, gridding, and final map production.
Spatial Reference Files and Exporting Deliverables
Managing coordinate systems correctly inside a project is important, but Drew also highlighted another critical consideration: ensuring coordinate information travels with your data when it leaves Surfer.
After all, a perfectly aligned map can quickly become misaligned if the spatial reference information isn’t included when sharing files with colleagues, stakeholders, or other software applications. To help facilitate a smooth transition, Drew walked through a few key topics.
Understanding spatial reference files
During the webinar, Drew explained that many mapping applications rely on external spatial reference files to understand where a dataset belongs in geographic space.
These files contain the coordinate system and projection parameters needed to position a layer correctly. Common examples include:
- .prj files
- .rsf files
- World files
- Golden Software’s .gsr and .gsr2 reference files
When these files accompany a dataset, other mapping applications can immediately recognize the layer’s spatial location and projection information without requiring you to manually define the coordinate system. In many workflows, these small reference files are what allow data to move smoothly between software packages while maintaining proper alignment.
Save time by writing spatial reference files early
Drew also highlighted a simple workflow that can save time later in a project.
When working within the Worksheet window, he showed how you can instruct Surfer to write spatial reference information alongside the data as it is saved. By doing so, subsequent workflows—such as gridding and mapping—can automatically recognize the coordinate system associated with the dataset.
This reduces the need to repeatedly assign coordinate systems throughout the project and helps minimize the risk of projection-related mistakes later in the workflow.
Drew’s export checklist
When exporting maps for external stakeholders, Drew recommended using spatially aware formats whenever possible, including:
- GeoTIFF
- GeoPDF
These formats allow georeferencing information to travel with the exported file, making it easier for recipients to use the data in other mapping and GIS applications.
However, before completing an export, Drew encouraged reviewing the export options and verifying that the appropriate georeferencing settings are enabled. Depending on the export format, this may include options such as:
- Writing a spatial reference file
- Embedding GeoTIFF coordinate information
- Preserving georeferencing metadata within the output file
Taking this verification step helps ensure that maps remain properly positioned long after they leave Surfer, reducing confusion for stakeholders and preserving the integrity of the data throughout its lifecycle.
Confidence Comes from Understanding Coordinate Systems
Coordinate systems don’t have to be challenging. As Drew demonstrated throughout the webinar, understanding the fundamentals as well as the relationship between Source and Target coordinate systems can help prevent alignment issues, improve accuracy, and streamline your mapping workflow.
Whether you’re combining datasets from different sources, reprojecting grids, preparing data for 3D visualization, or exporting deliverables for stakeholders, a solid understanding of coordinate systems helps ensure your data displays in the right place every time.
Want to see these concepts and workflows in action? Watch the full Master Coordinate Systems & Map Projections in Surfer webinar replay to explore the demonstrations, tips, and best practices covered during the session.
Recent Articles
- Jun 17, 2026|Gabbie Rhodes|8 min
Both work and family require energy and intentionality. To ensure you approach them effectively, discover tips to balance work and family life.
- Jun 17, 2026|Gabbie Rhodes|11 min
Senior Technical Sales Specialist Drew Dudley hosted a webinar to provide tips for ensuring coordinate systems display accurately and consistently.
- Jun 10, 2026|Gabbie Rhodes|9 min
During peak season, it’s hard to complete high-quality work on time. Fortunately, some practical workplace productivity hacks can help.
- Jun 10, 2026|Gabbie Rhodes|5 min
When it comes to software, the right licensing model matters. A one-time fee and subscription are common options. Which is right for you?