The Power of Fit Curves: Helping Audiences Understand & Trust Your Visualization
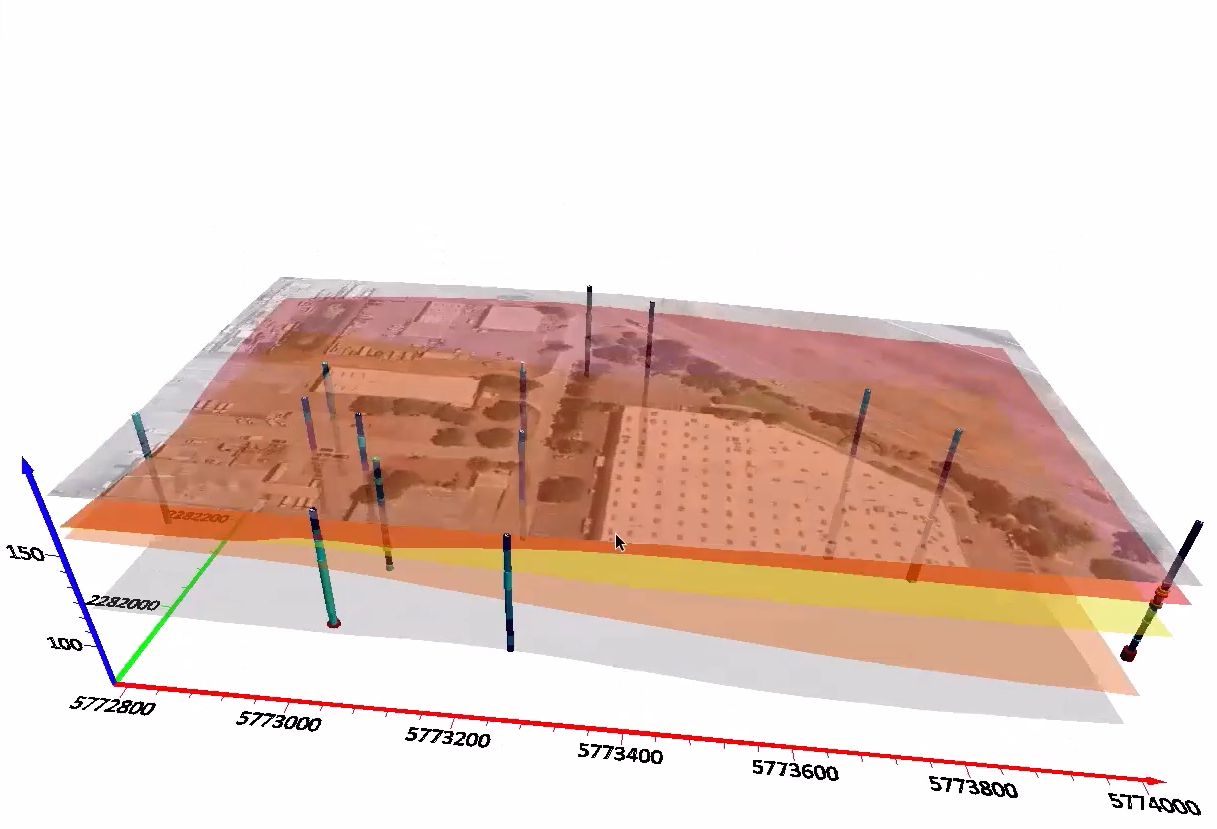
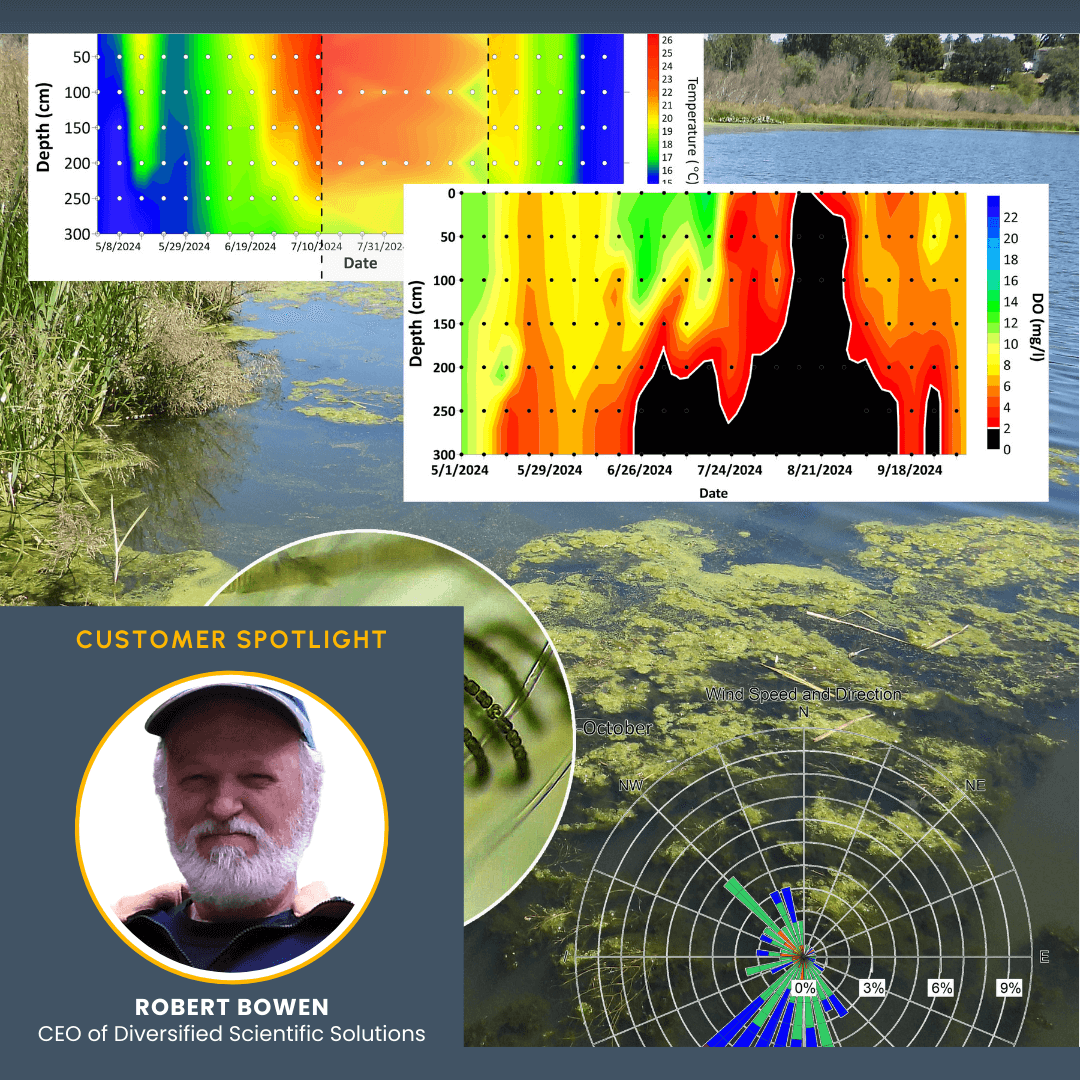
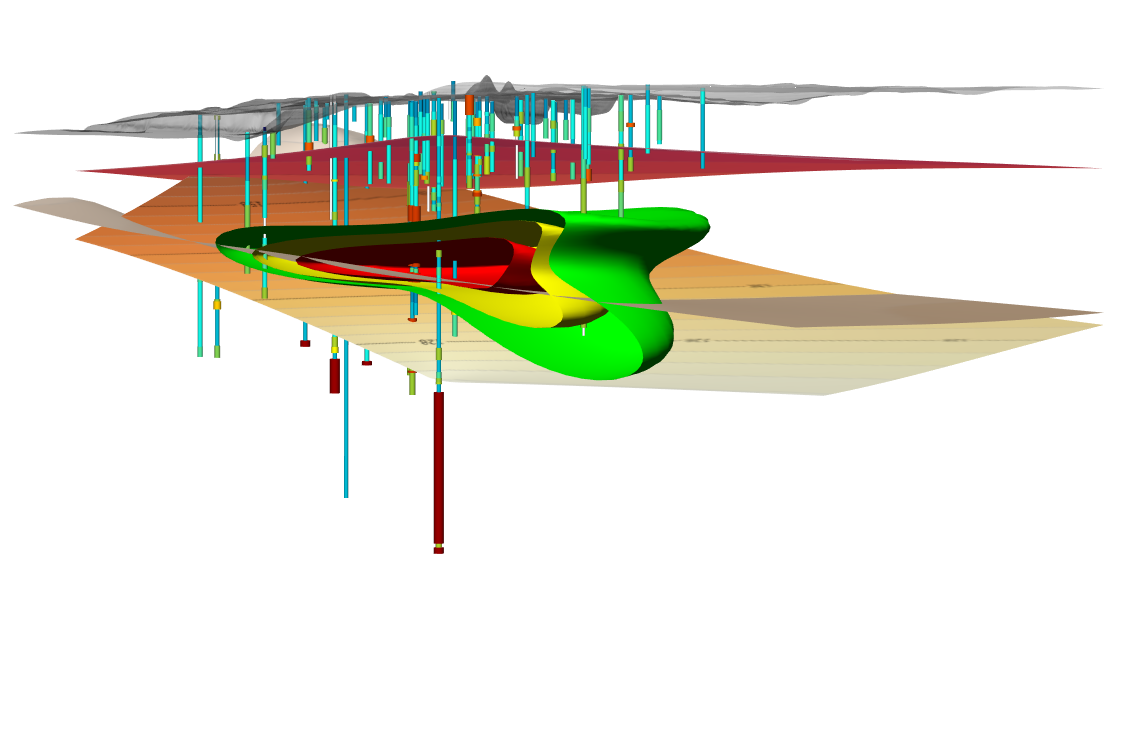
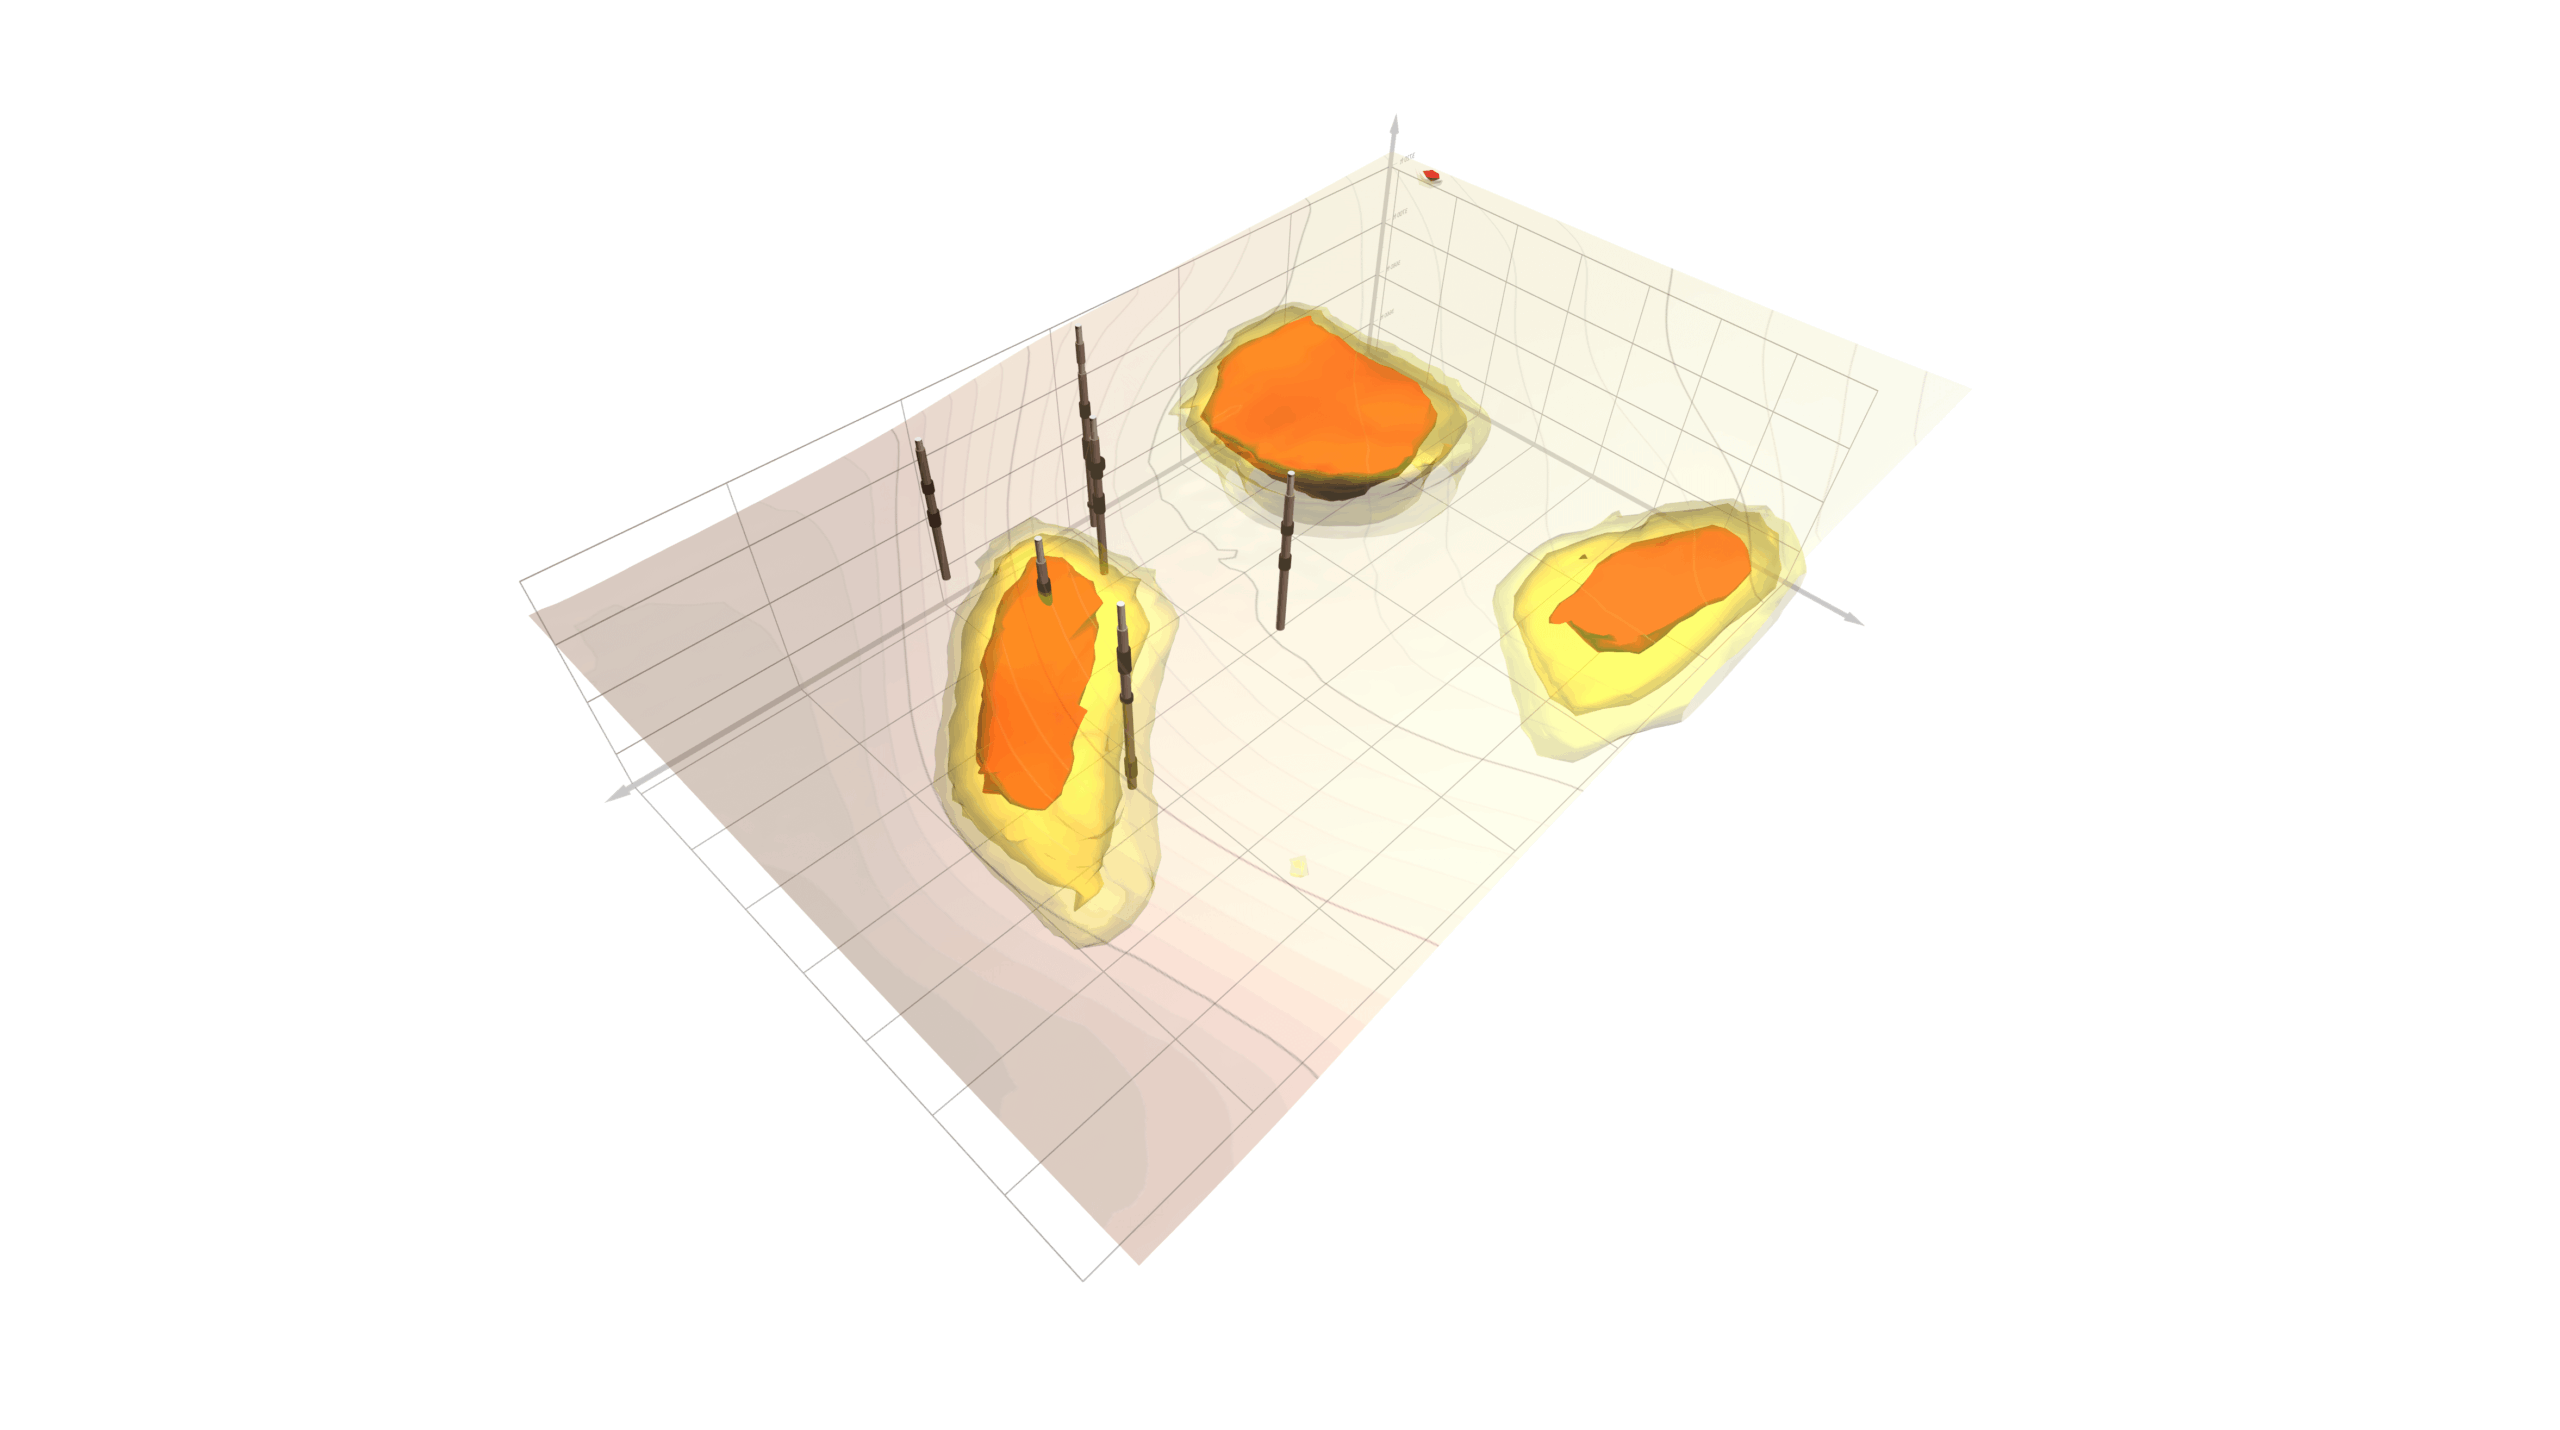
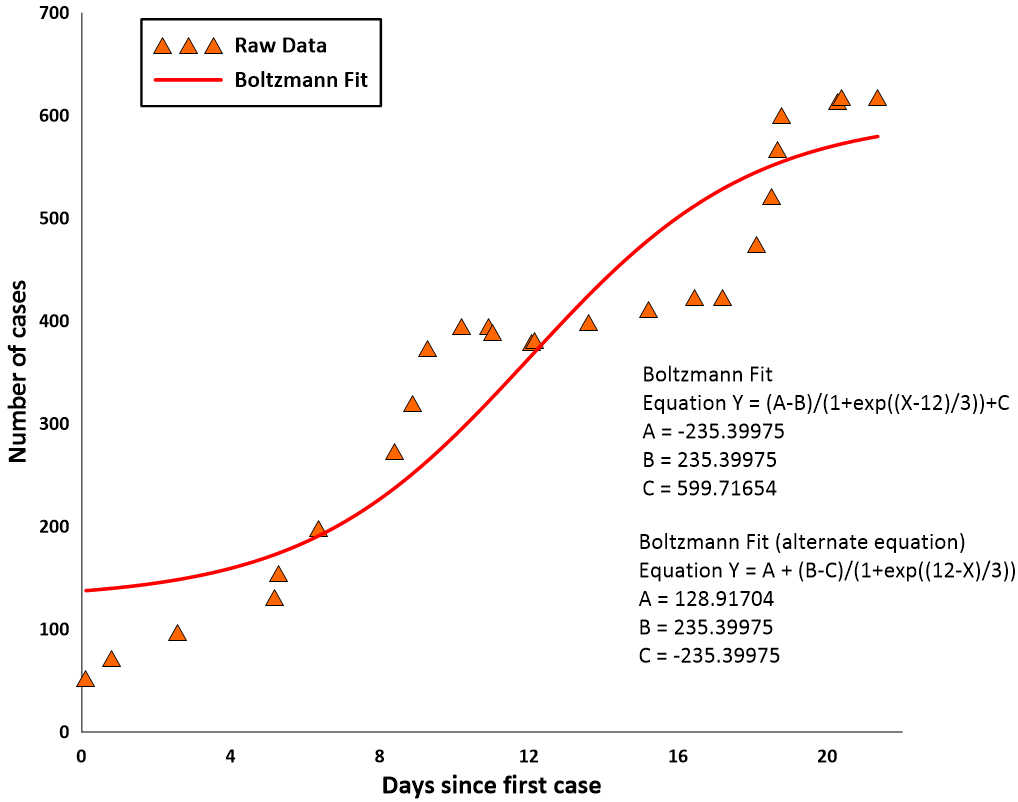
The Power of Fit Curves: Helping Audiences Understand & Trust Your Visualization As a geoscientist or engineer, you need to provide graphs and charts that are understandable and trustworthy—and fit curves help achieve those goals. You might know them as “trendlines” in Excel, the classic [...]