- Jan 27, 2026|Gabbie Rhodes|5 min
Scientists and students at the University of Montana are helping update an archive that’s empowering engineers, communities, and more.
- Jan 20, 2026|Gabbie Rhodes|5 min
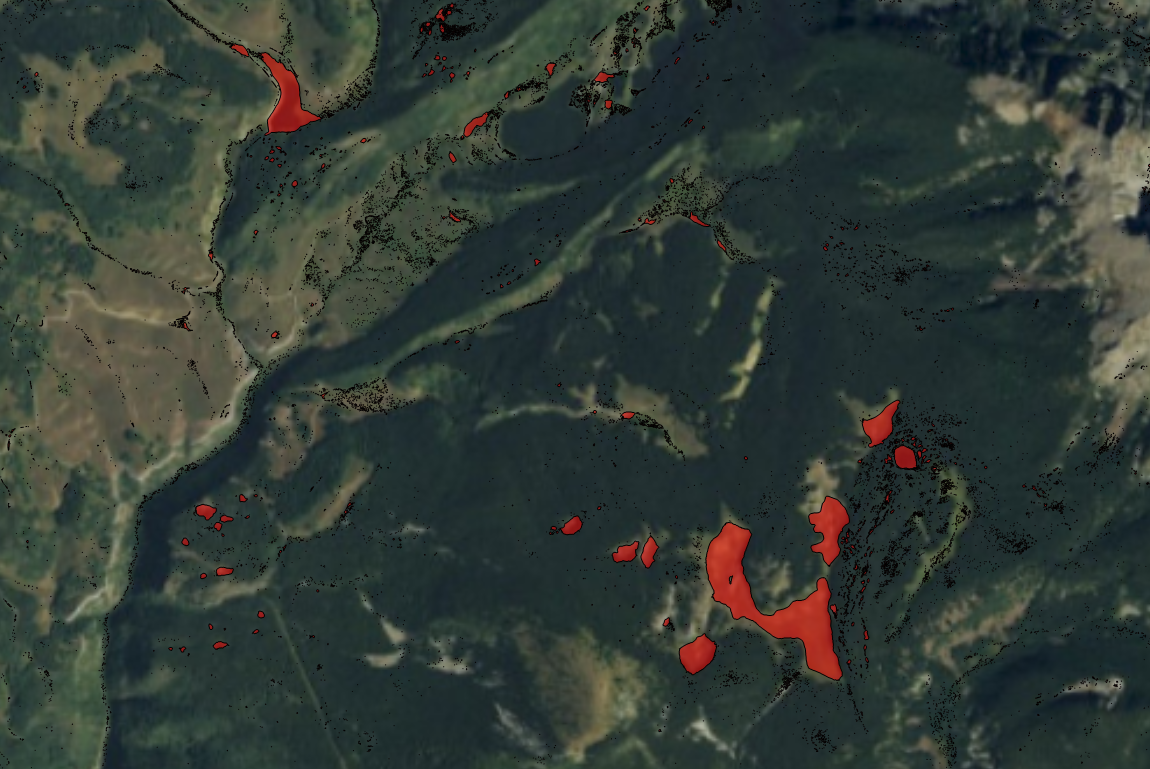
A regional hydrologist does rapid assessments of sinkholes, leveraging a peaks and depressions map. Learn why the map is so powerful.
- Jan 20, 2026|Gabbie Rhodes|3 min
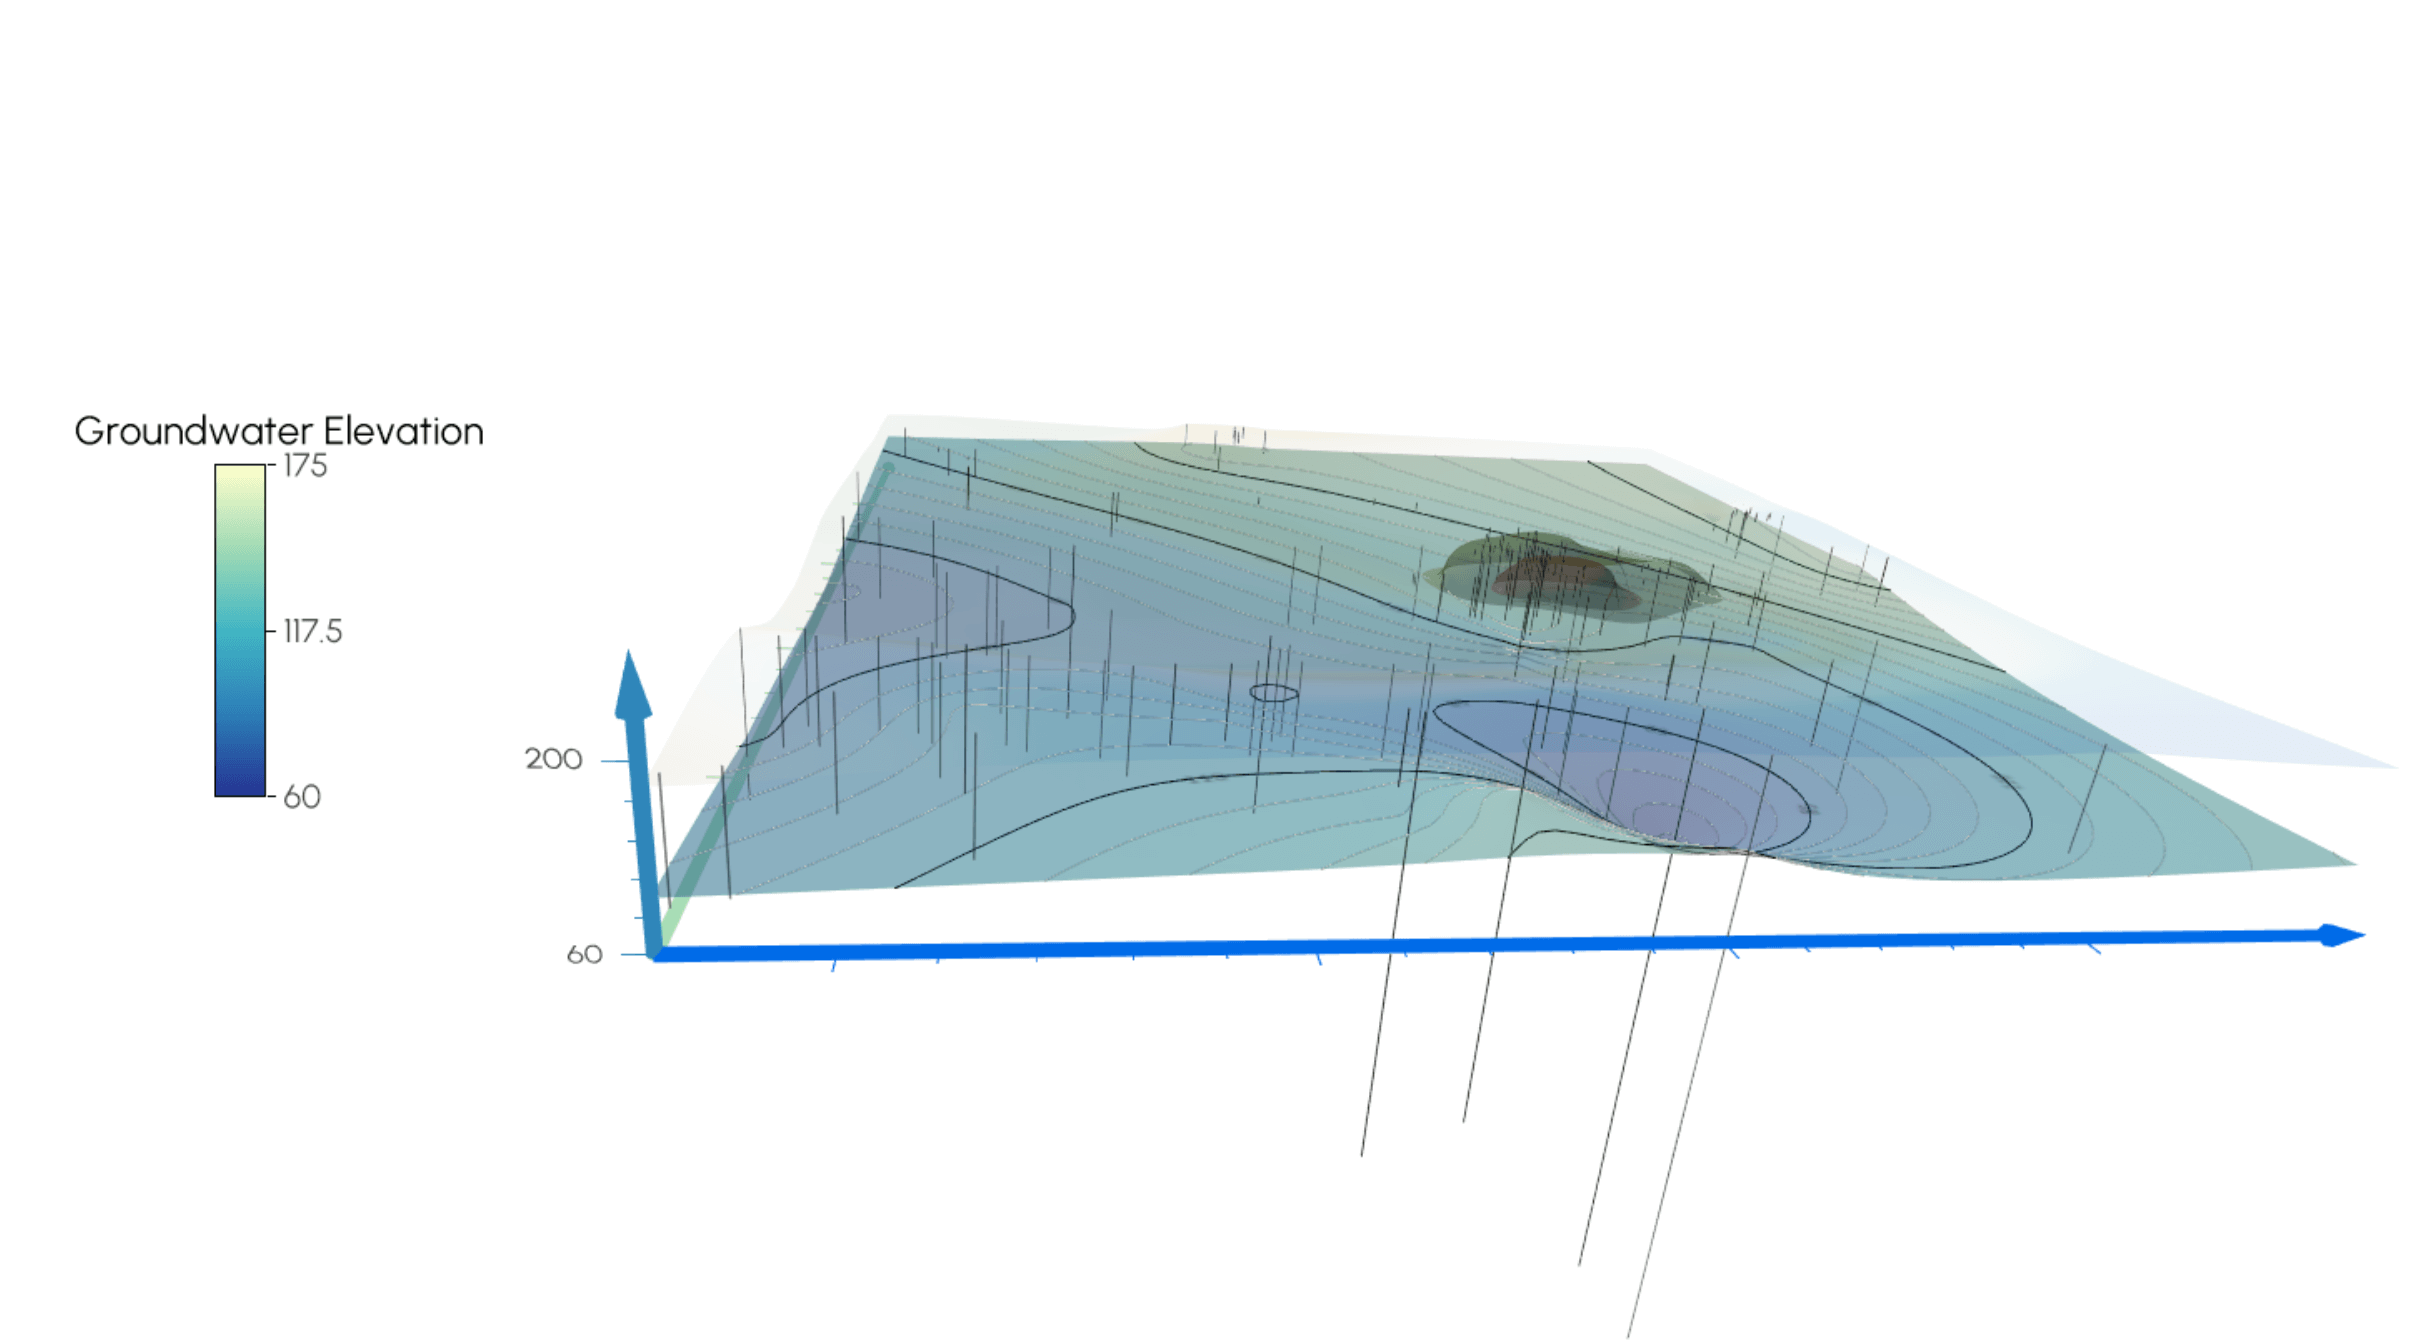
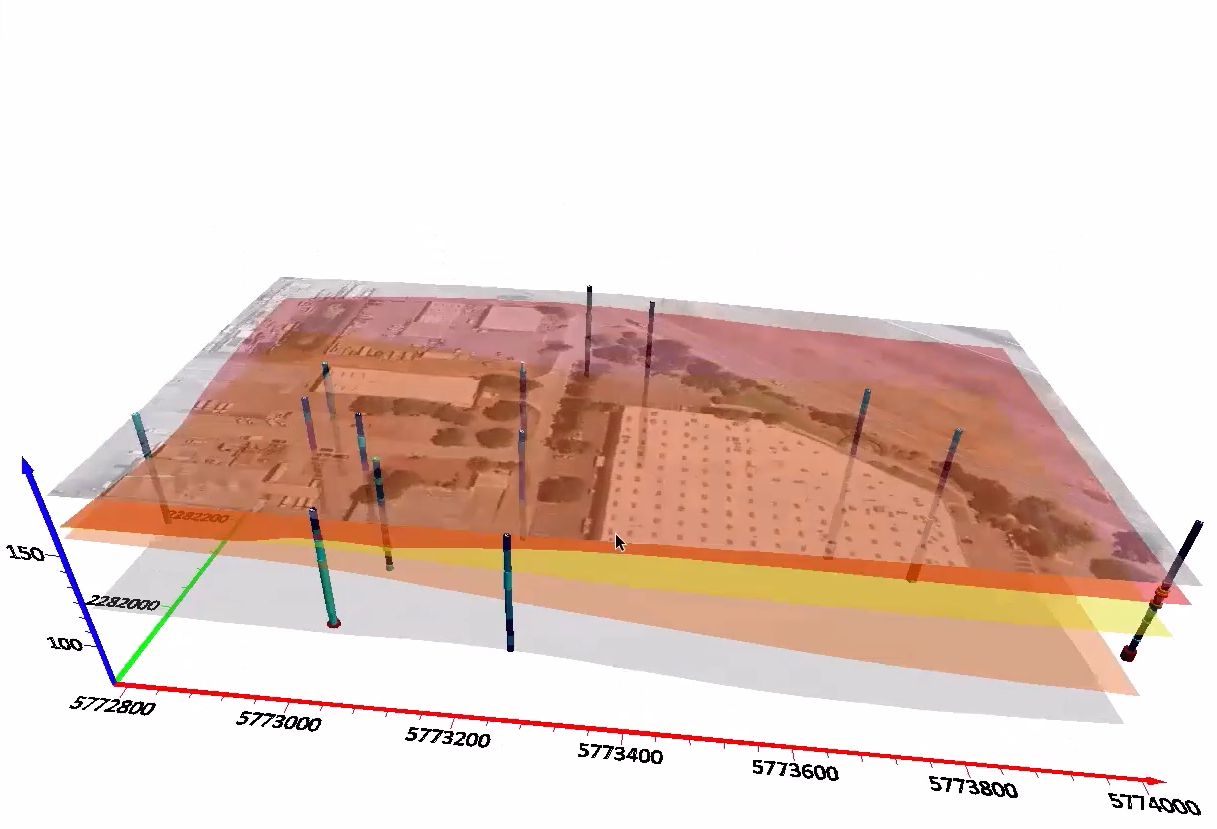
As an environmental consultant, you can use 3D to enhance your data communication skills so stakeholders better understand your findings.
- Jan 14, 2026|Gabbie Rhodes|4 min
3D data visualization is innovating many industries, including water resource management. With 3D models, insights are easier to see. Learn more.
- Jan 14, 2026|Gabbie Rhodes|4 min
Oftentimes, you need to customize your graph to ensure you not only honor your data but also align with style guidelines and client expectations.
- Jan 6, 2026|Gabbie Rhodes|4 min
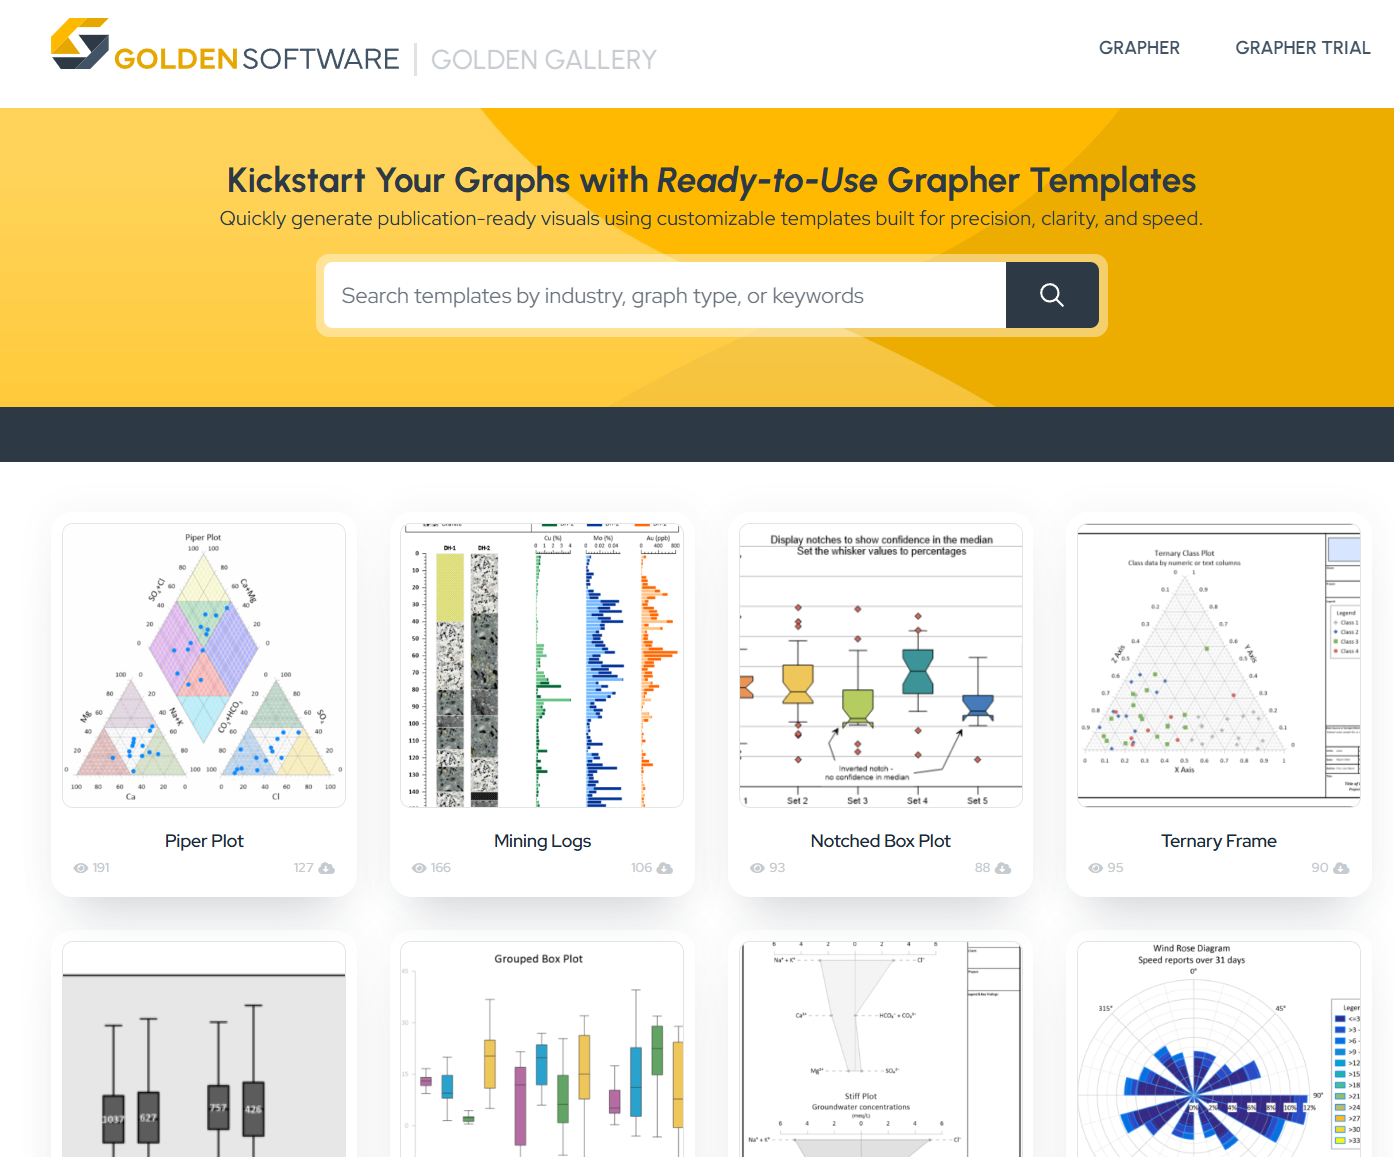
Are you the graphing pro that everyone in your organization turns to for a plot? Templates empower colleagues to create great visuals themselves.
- Jan 6, 2026|Gabbie Rhodes|6 min
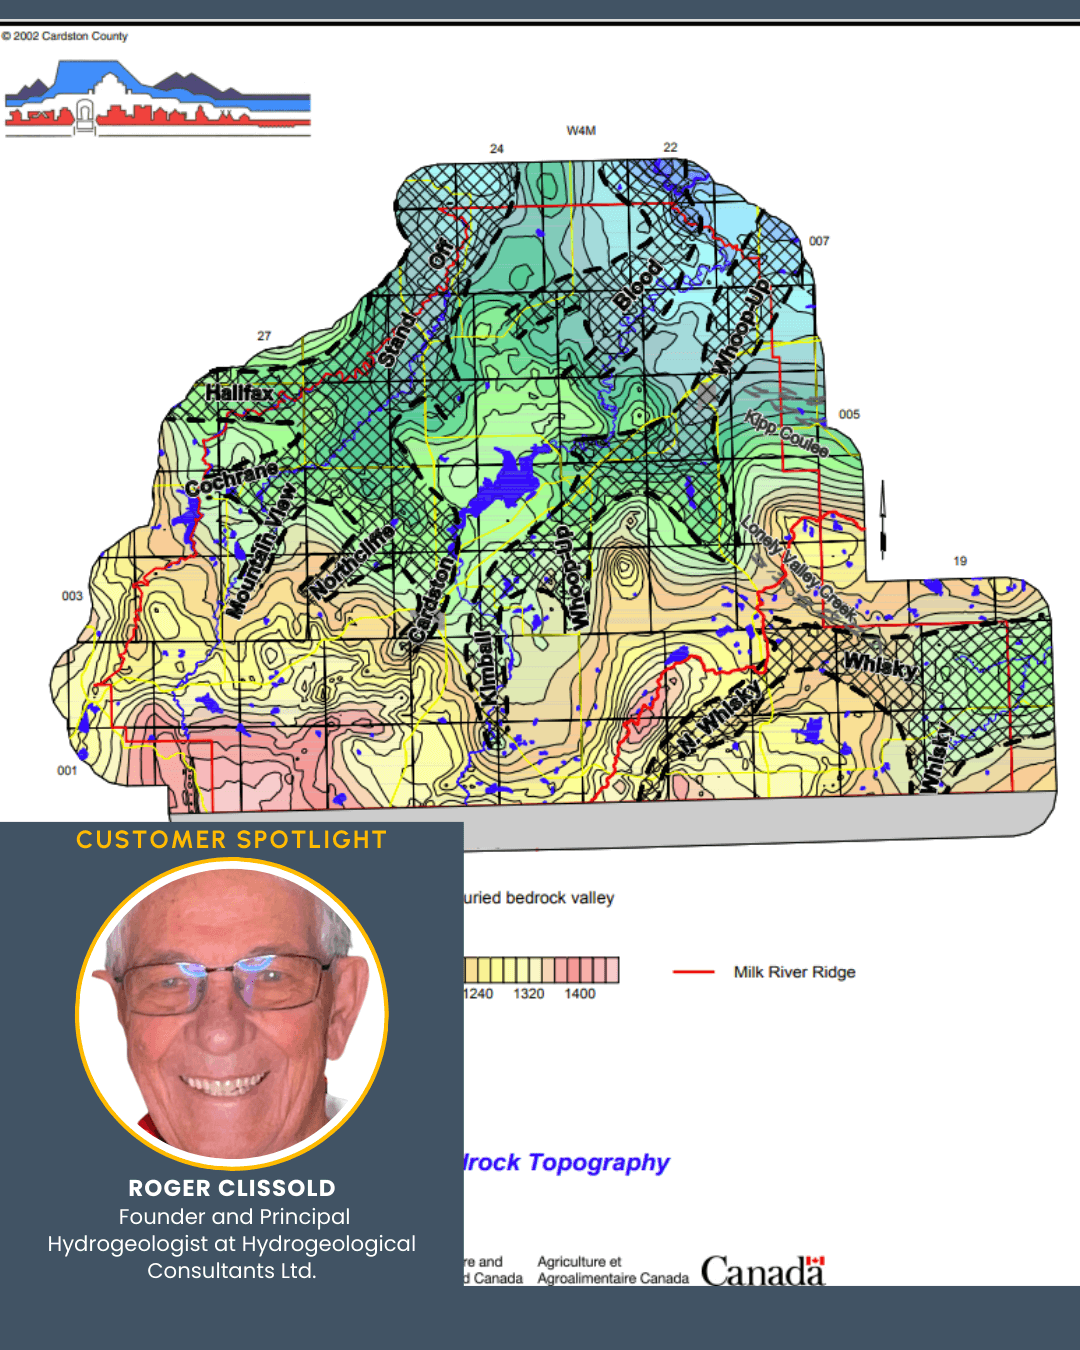
Gridding methods such as Kriging helped Hydrogeological Consultants Ltd. map groundwater resources for 40% of Alberta, Canada. Learn more.
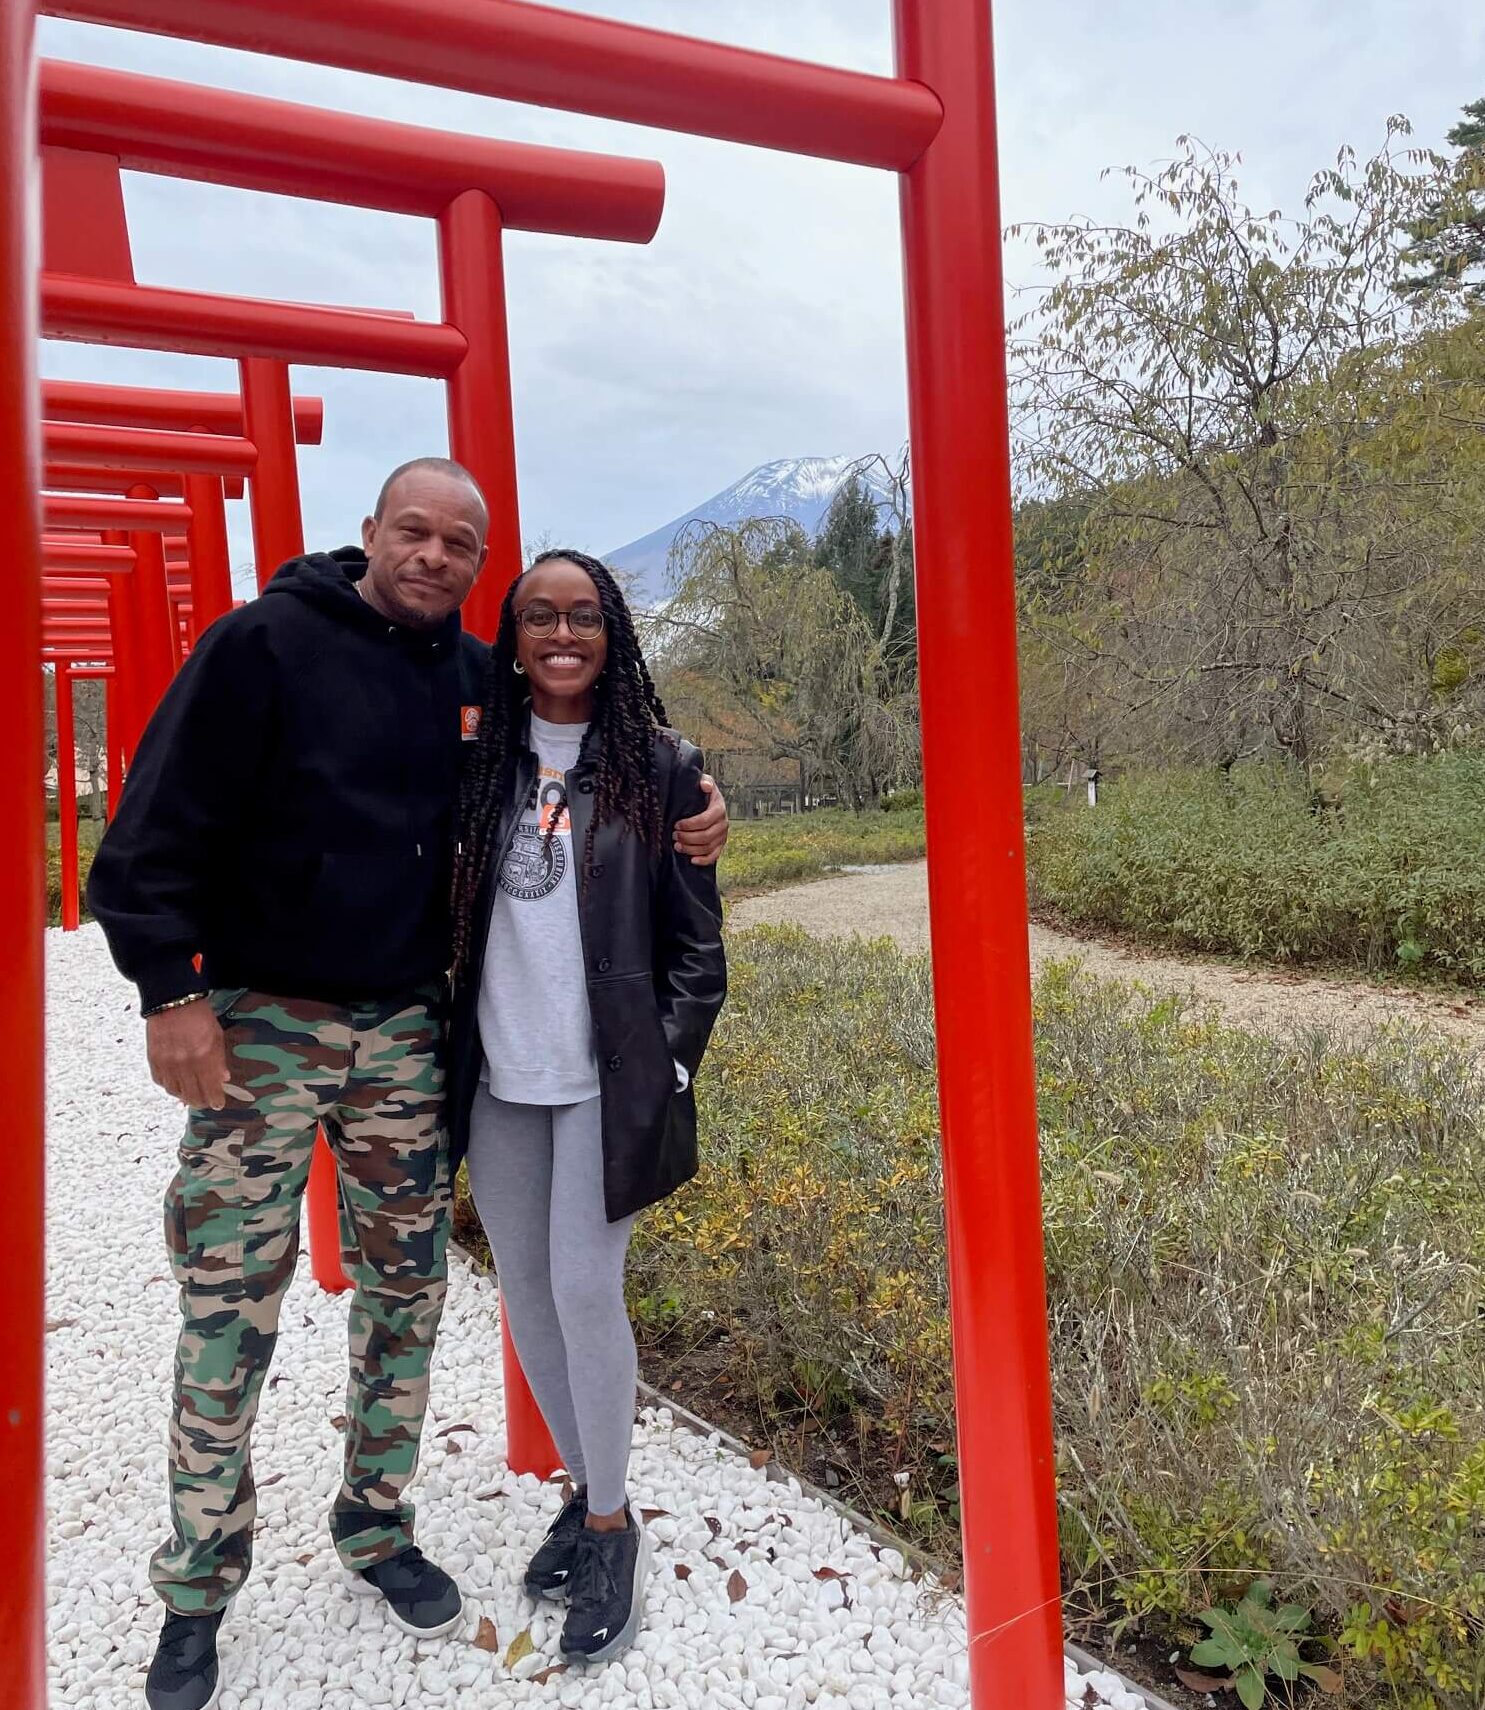
- Dec 30, 2025|Gabbie Rhodes|7 min
Recently, our Content Marketing Specialist Gabbie Rhodes went to Japan with her dad. Her trip included cultural discoveries, good food, and more.
- Dec 30, 2025|Gabbie Rhodes|4 min
When you regularly work with updated data or similar projects, recreating your plots is the norm. Fortunately, templates make it easier than ever!
- Dec 23, 2025|Gabbie Rhodes|4 min
Do you want to create an effective data visualization every time stakeholders need one? Templates not only make that possible but easy.
- Dec 23, 2025|Gabbie Rhodes|5 min
Want to create a visual that truly impresses stakeholders? The finishing touches matter. Learn how to wow stakeholders with quality maps & models.
- Dec 17, 2025|Gabbie Rhodes|7 min
The latest version of Grapher is enhancing efficiency and visual quality at the same time with templates, collaboration tools, and more.
- Dec 17, 2025|Gabbie Rhodes|4 min
When using a new graphing tool or trying to create a new plot in your current software, there's always a learning curve. Templates can help.
- Dec 10, 2025|Gabbie Rhodes|9 min
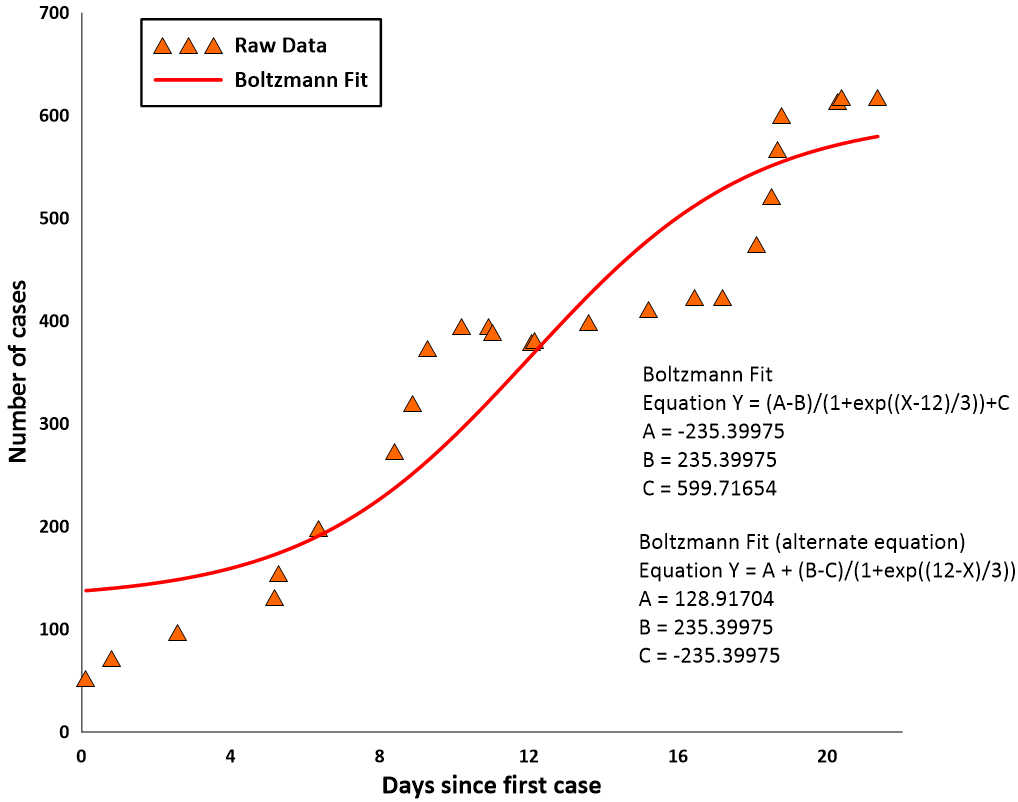
Need to create graphs and charts that are understandable and trustworthy? Fit curves help achieve those goals. Learn more.
- Dec 10, 2025|Gabbie Rhodes|4 min
Graphing isn't always a quick and easy process, but there's a way you can streamline it: take advantage of ready-to-use graph templates.
- Dec 4, 2025|Gabbie Rhodes|3 min
Wondering if your 2D maps are clearly communicating surface and subsurface data? There are signs that can let you know. Read more.
- Dec 4, 2025|Gabbie Rhodes|5 min
John Andersen is a Senior Geologist with O’Chiese Energy LP. He helps guide drilling decisions using subsurface data. Learn how.
- Nov 26, 2025|Gabbie Rhodes|4 min
Want to easily create 3D contact picks and surfaces from your drillhole data? Surfer now equips you to do that very thing. Learn more.
- Nov 26, 2025|Gabbie Rhodes|5 min
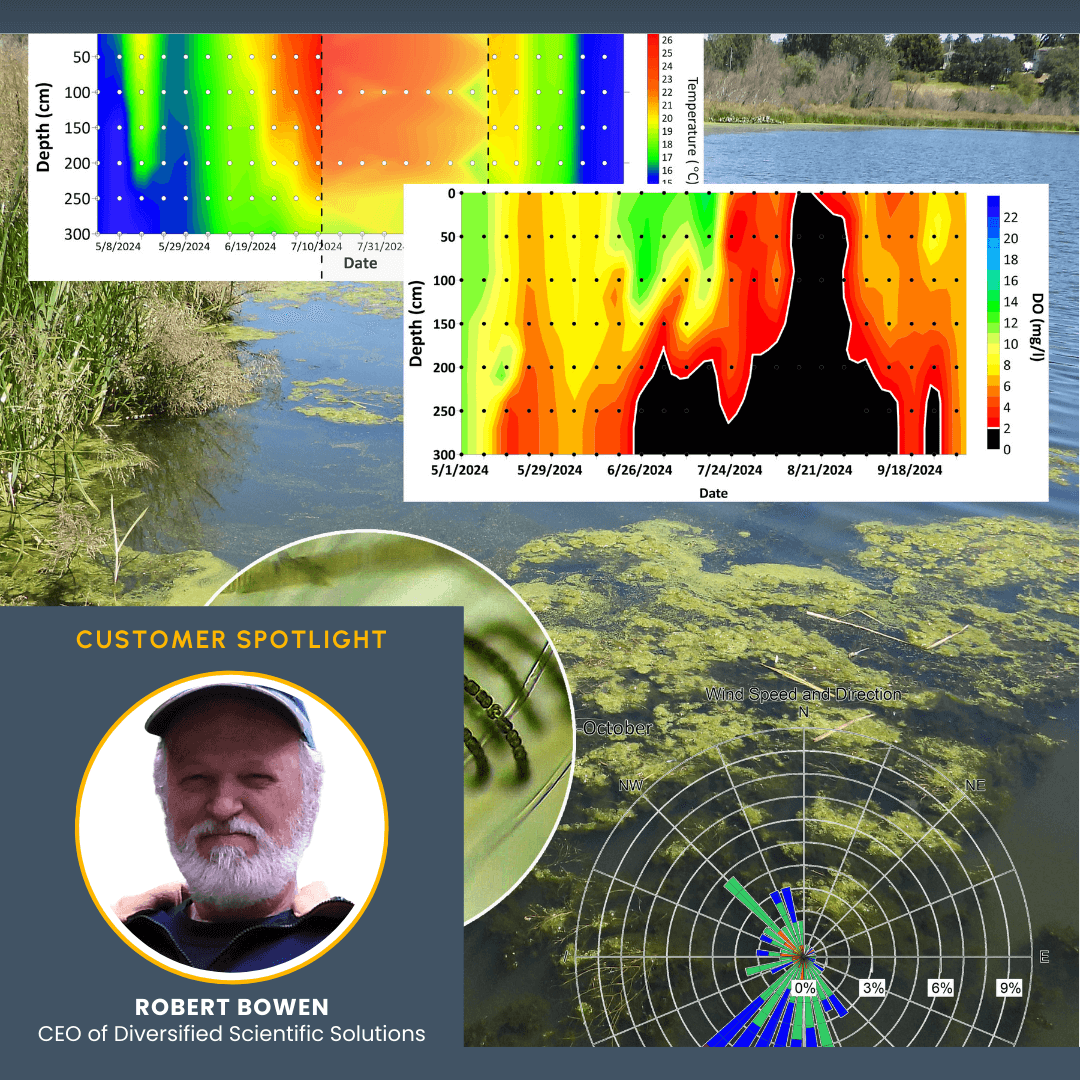
Robert Bowen, CEO of Diversified Scientific Solutions, has been returning to Swan Lake to better understand its health. Discover what he's learned.
- Nov 19, 2025|Gabbie Rhodes|5 min
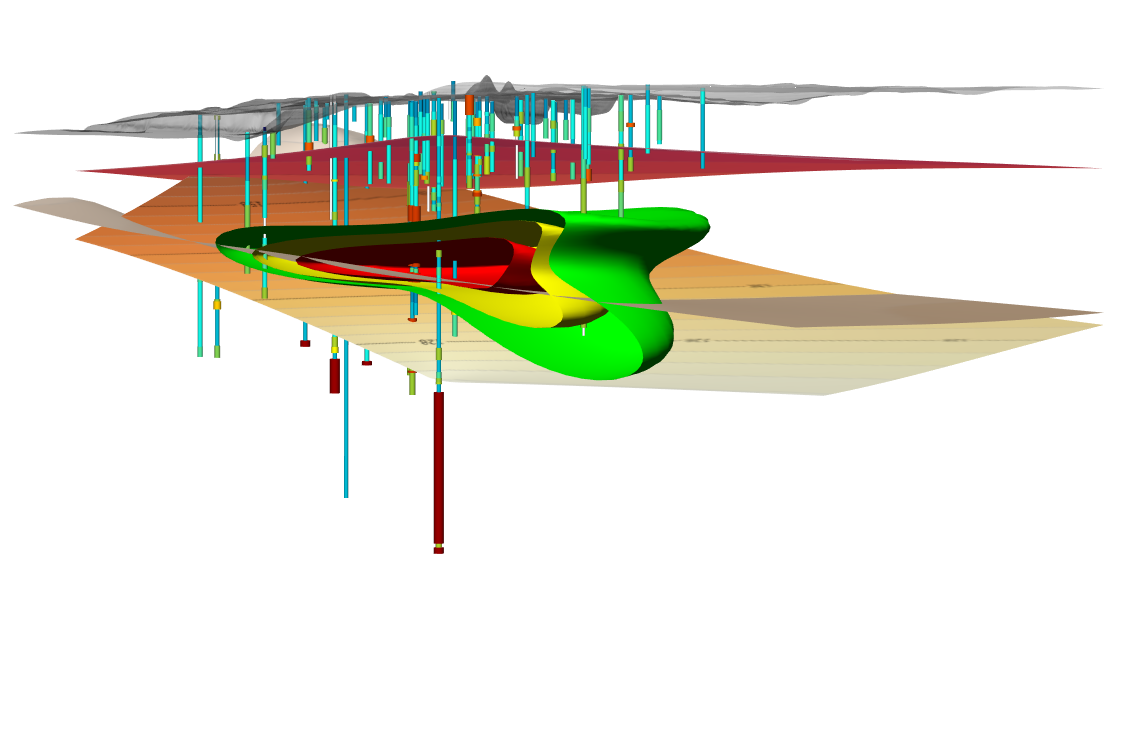
Clarity is critical when creating a 3D model. After all, you need stakeholders to understand your insights. The right lighting can help get the job done.