- Oct 15, 2025|Gabbie Rhodes|6 min read
To prepare the next generation of scientists, WMU has a hydrogeology field camp. Professor Dogan is one of the instructors helping equip students.

About Golden Software
40 years ago, Golden Software began as a small company that develops, sells, and supports scientific visualization software.
Today, we still develop, sell, and support scientific visualization software, and more.
Surfer – Create an Immersive 2D/3D Model in Under 2 Minutes!
Grapher – If You Can Imagine It, You Can Graph It!
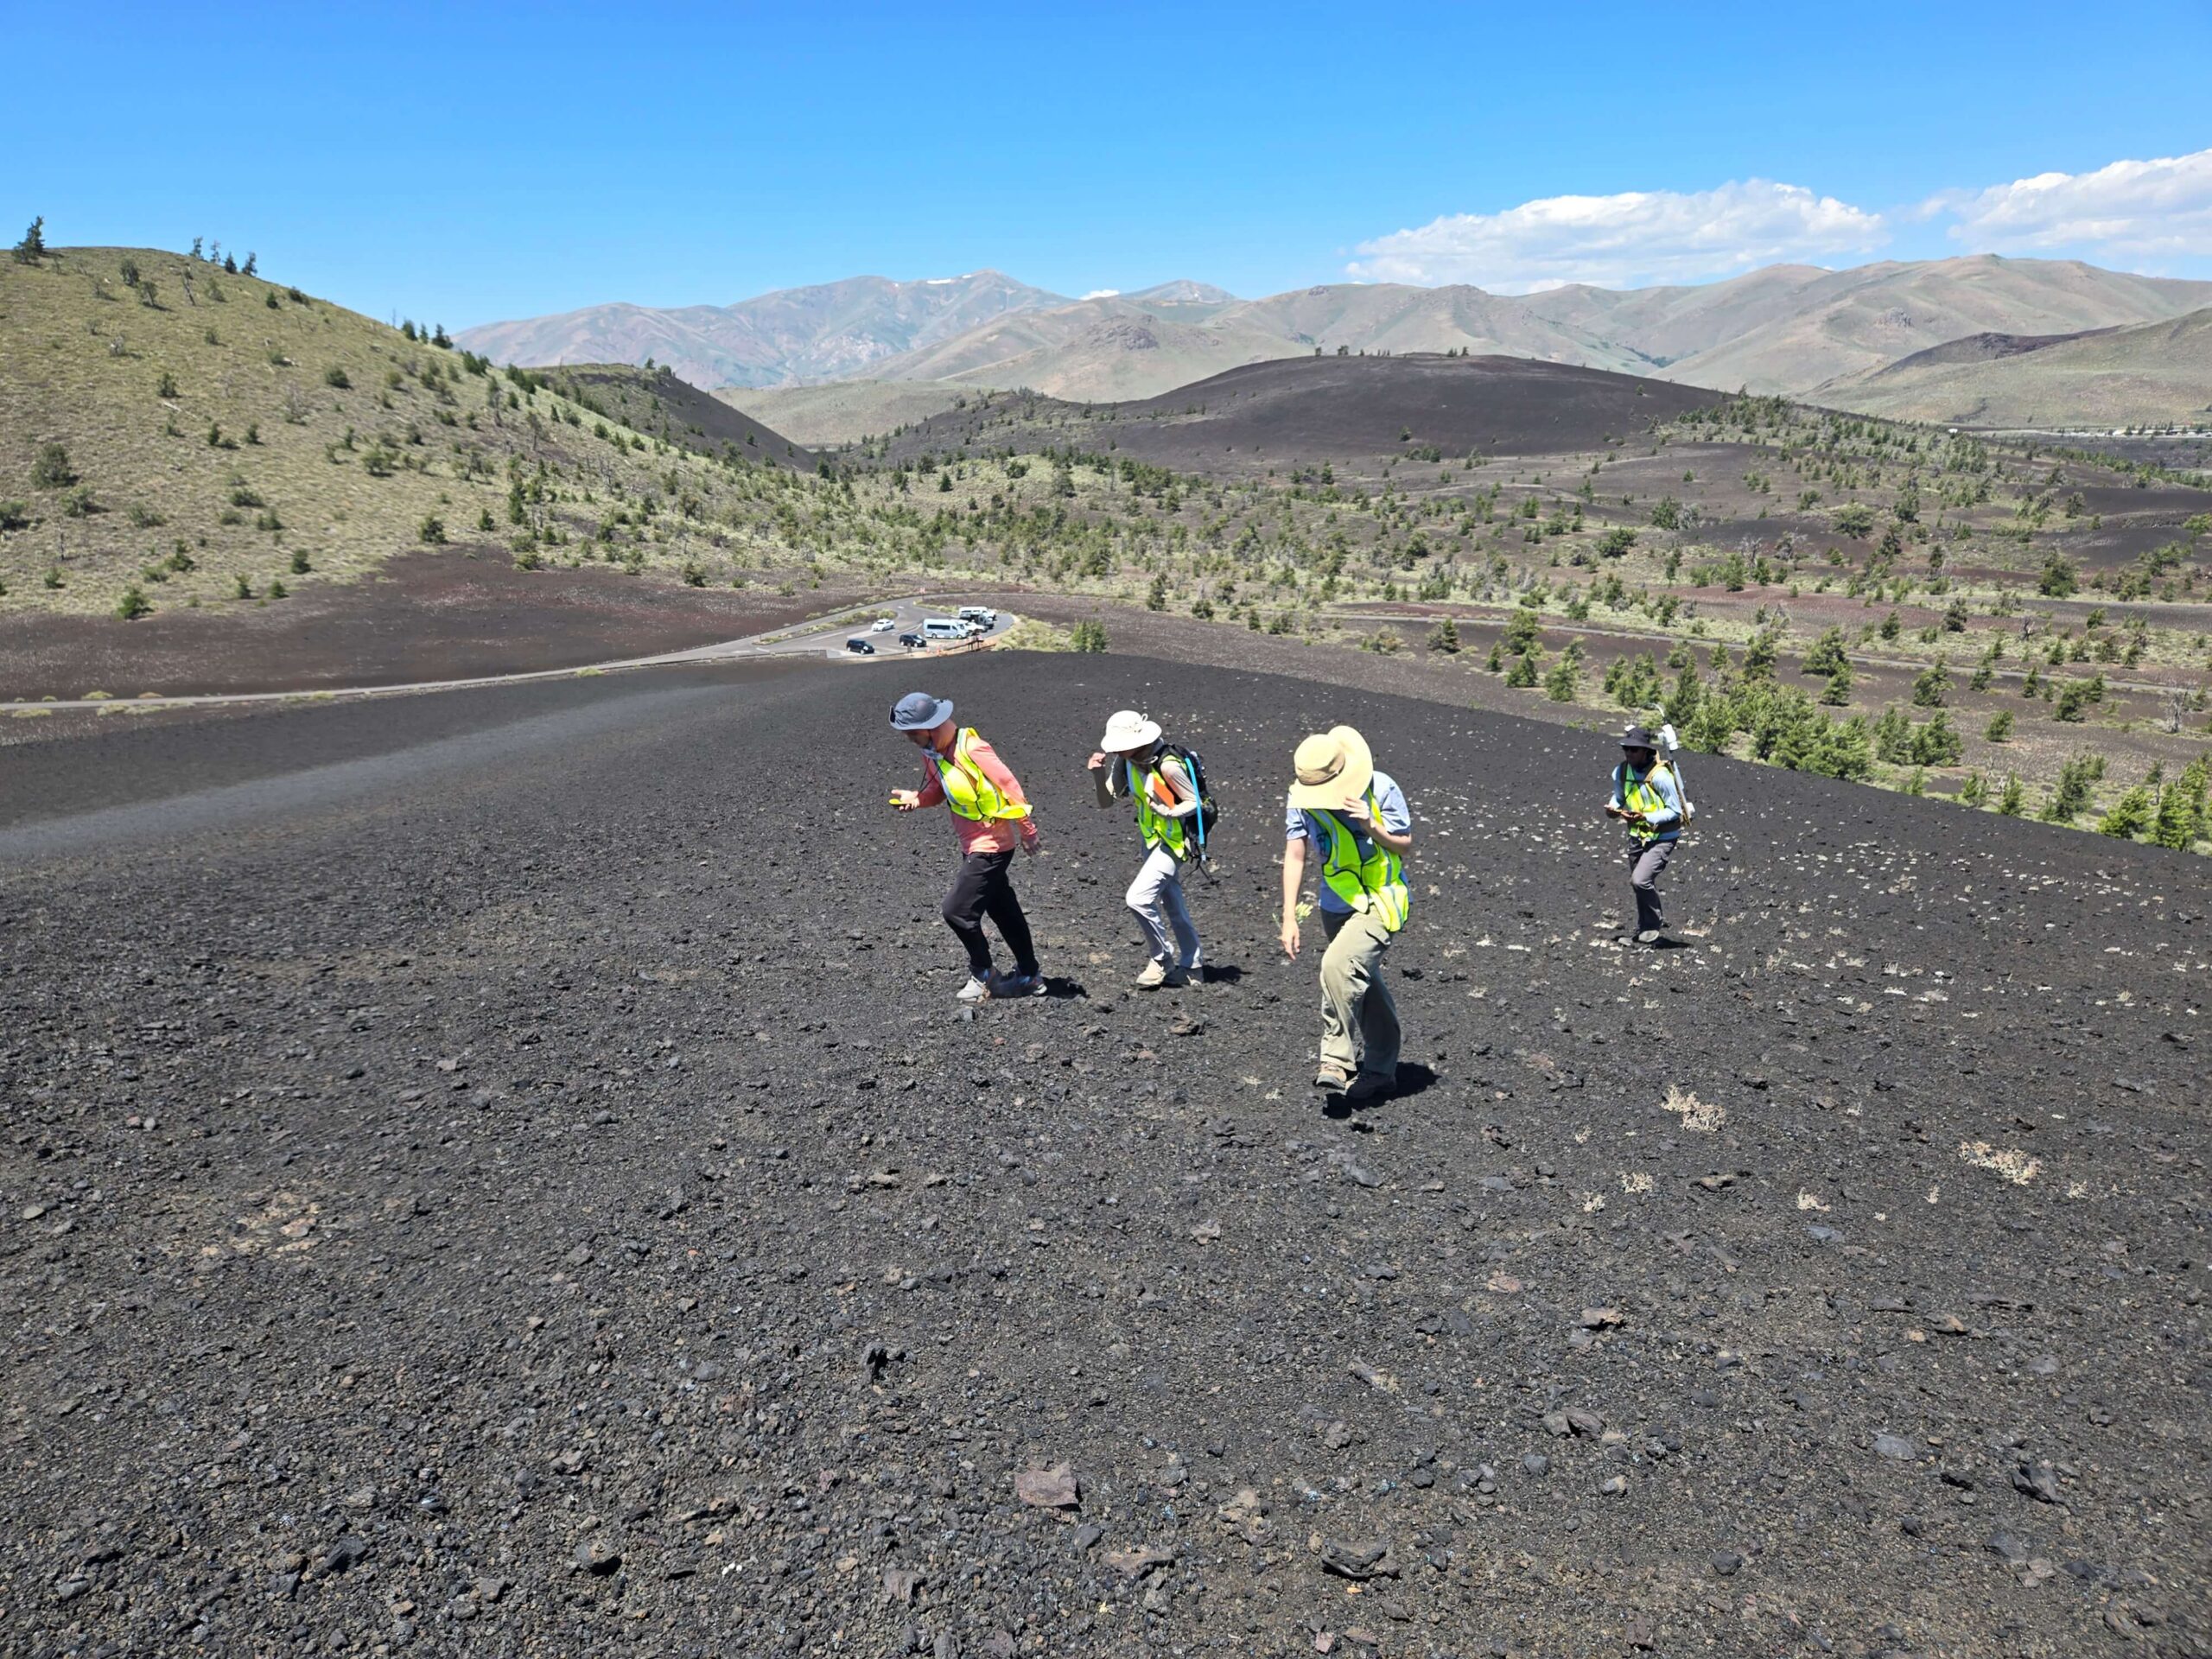
- Sep 3, 2025|Gabbie Rhodes|10 min
Get a glimpse into the University of South Florida's field camp, which includes a geophysics course in Idaho, advanced equipment, and Surfer.
- Aug 28, 2025|Gabbie Rhodes|5 min
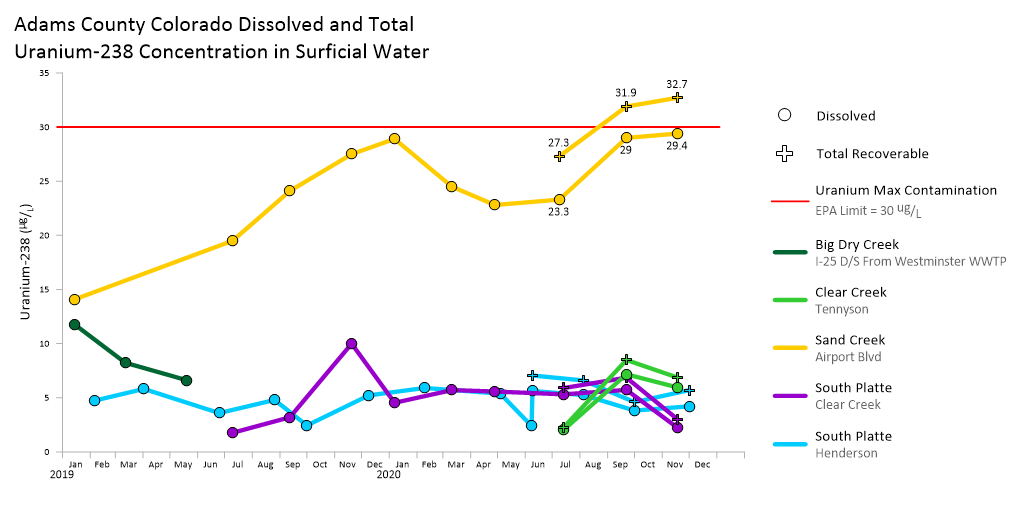
Do you regularly assess water quality for stakeholders? Then, you need to transform your water quality data into great visualizations.
- Jul 23, 2025|Gabbie Rhodes|7 min
Sometimes, you have to convince your boss that getting better software is worth the purchase. The good news is that it can be done. Learn more.
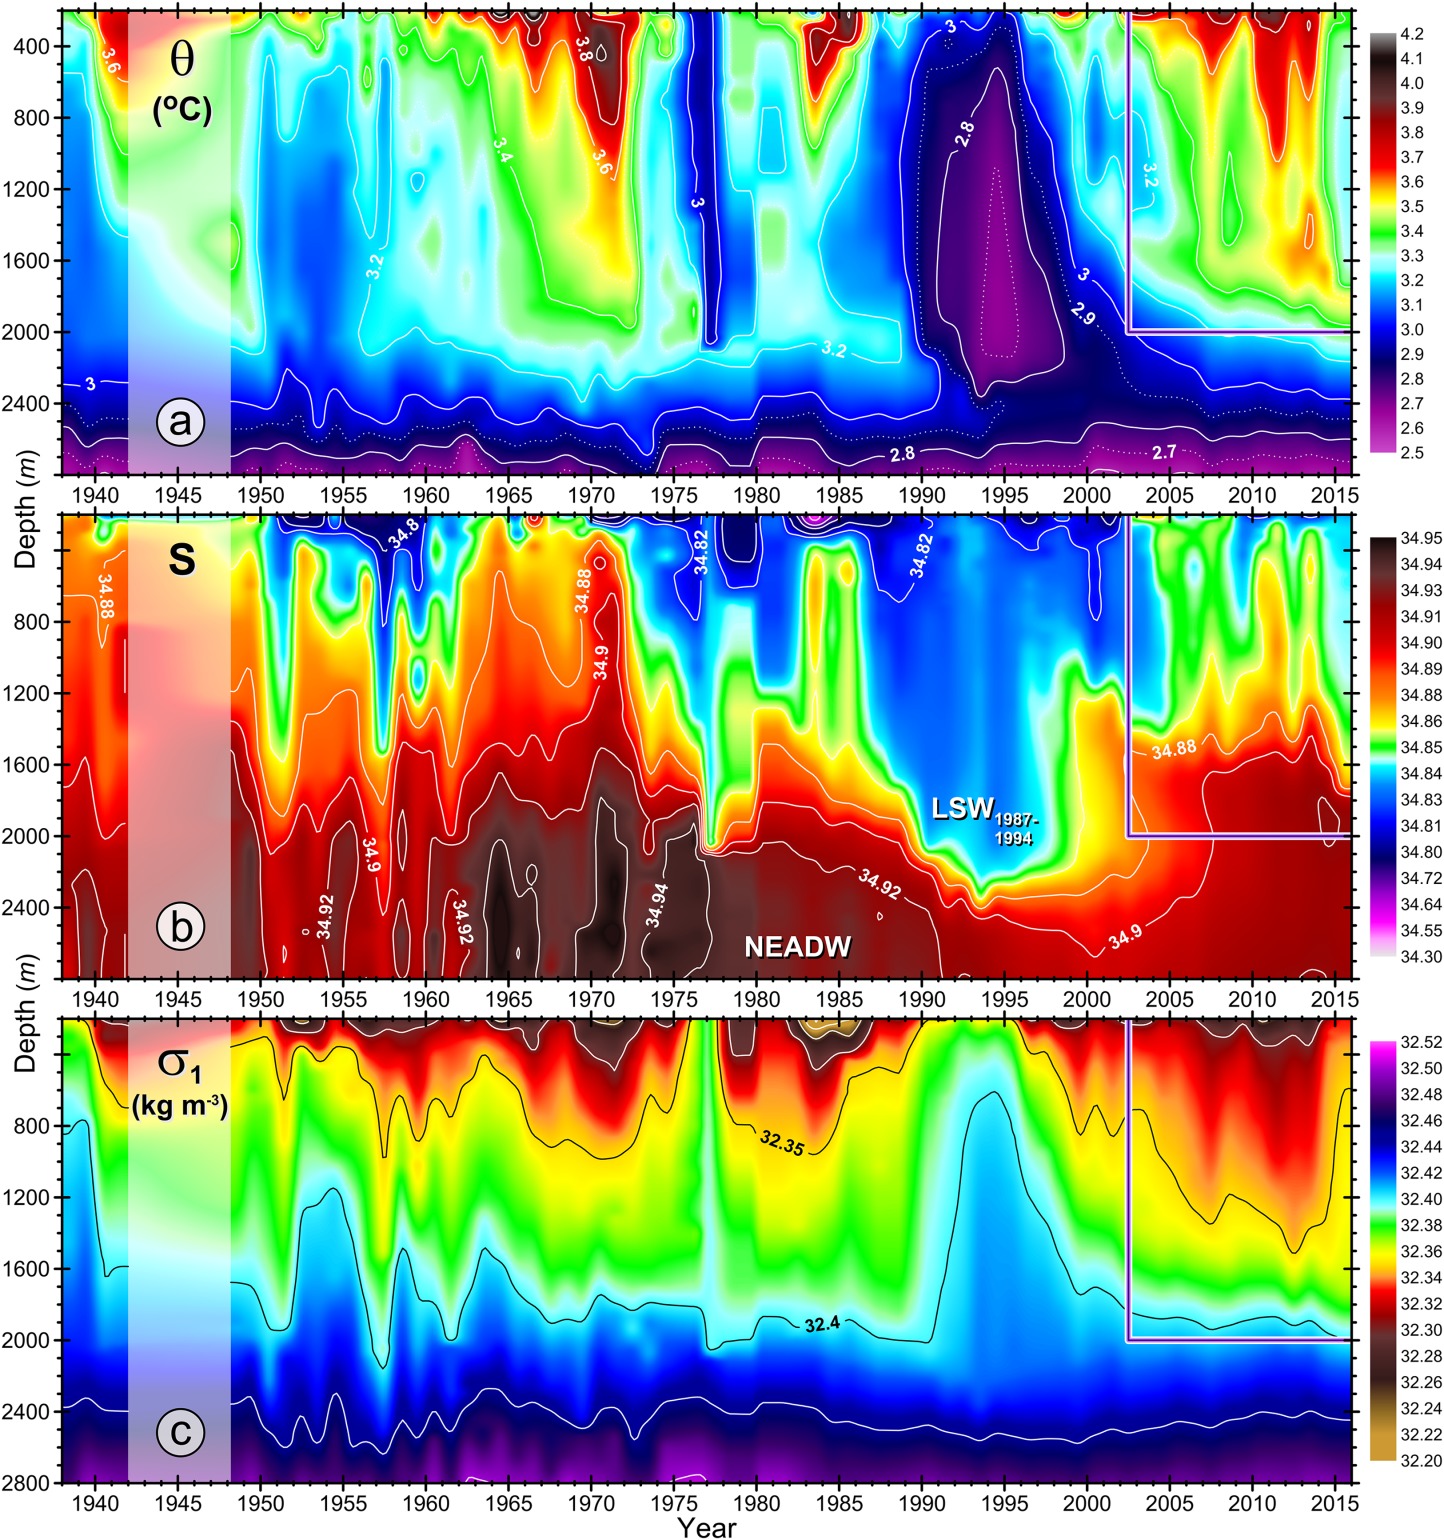
- Apr 23, 2025|Gabbie Rhodes|11 min
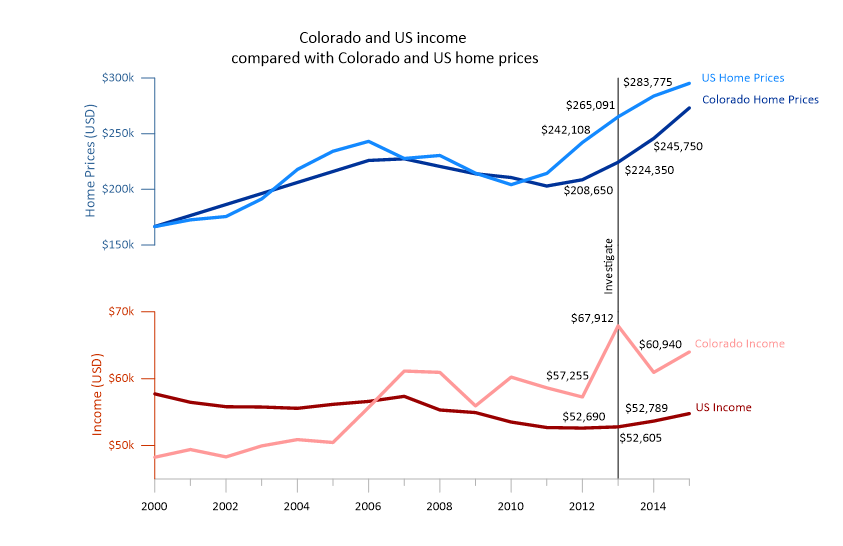
Some data visualizations are so good they stand the test of time. One is a high-profile plot that was created in Surfer and that's still relevant today.
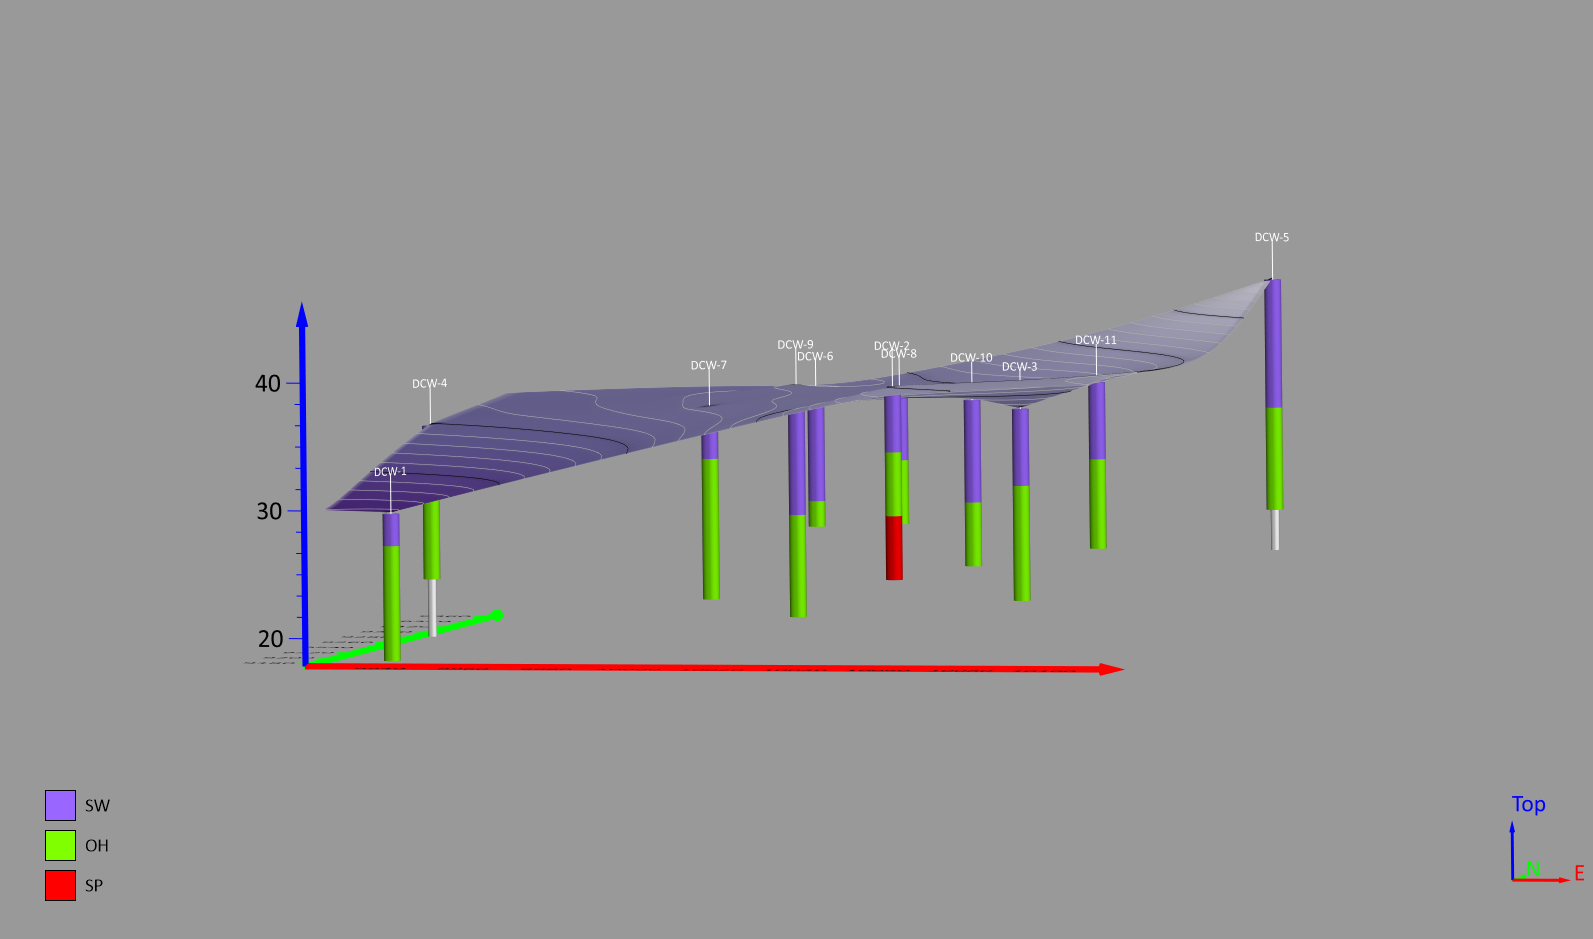
- Apr 23, 2025|Gabbie Rhodes|7 min
Do you want give stakeholders more insight into the subsurface? There's a specialized map type you should consider using: drillhole maps!
- Apr 16, 2025|Gabbie Rhodes|8 min
Want to make your data visualizations better so they appeal to any audience? We've created an ultimate guide to help you do it. Learn more.
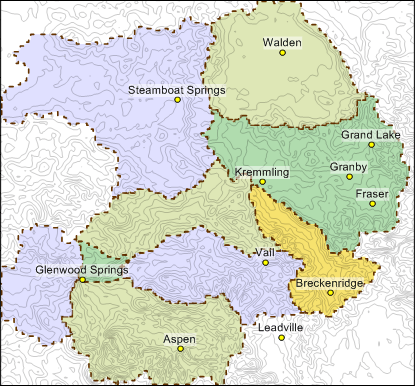
- Apr 16, 2025|Gabbie Rhodes|7 min
What are different types of maps you can use to showcase your data? There are mainstream maps and specialized maps. Learn more.
- Apr 2, 2025|Gabbie Rhodes|9 min
If you want to create high-quality, story-driven graphs and charts, you need to think like a designer. Learn what steps to take.
- Mar 26, 2025|Gabbie Rhodes|6 min
You don't create data visualizations for nothing. You want to capture and guide stakeholders' attention. Learn how to do it successfully!
- Mar 19, 2025|Gabbie Rhodes|9 min
Whether you're creating a graph or chart, there's one thing you must do: de-clutter your data visualization. Here's how to do it effectively.
- Feb 19, 2025|Gabbie Rhodes|5 min
Our team is kicking off a Storytelling With Data series to share the takeaways we took from Cole Nussbaumer Knaflic's book.
- Jan 15, 2025|Gabbie Rhodes|8 min
There are several common mistakes you may make when designing maps and graphs. You can avoid them using data visualization best practices.