- Jan 22, 2025|Gabbie Rhodes|10 min read
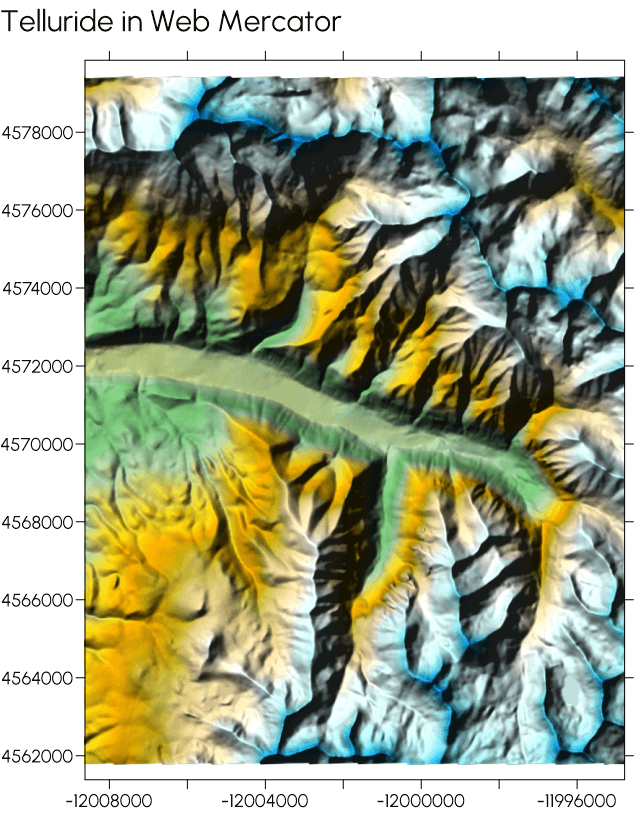
It's common to have data in different coordinate systems. But how do you create a clear, compelling, and accurate map in that situation? Read more.
About Golden Software
Since 1983, Golden Software has been at the forefront of scientific data visualization.
Today, we empower professionals to solve real-world problems by transforming complex data into clear, impactful visual stories through our industry-leading software and legendary customer support.
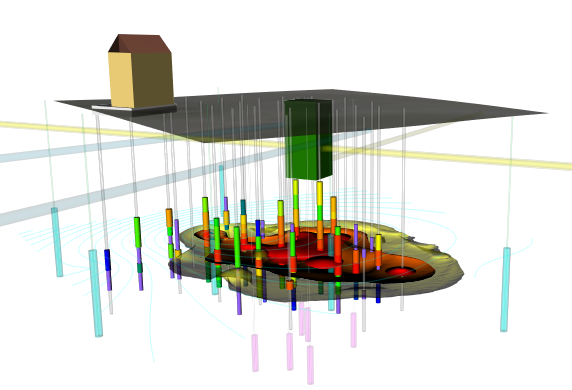
Surfer – Create an Immersive 2D/3D Model in Under 2 Minutes!
Grapher – If You Can Imagine It, You Can Graph It!
- Jan 15, 2025|Gabbie Rhodes|8 min
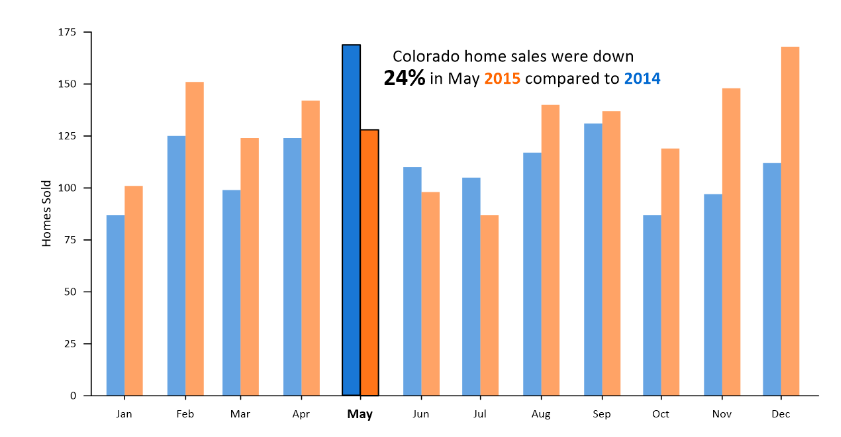
There are several common mistakes you may make when designing maps and graphs. You can avoid them using data visualization best practices.
- Jan 15, 2025|Gabbie Rhodes|7 min
Without good customer onboarding, you may not see the full value of your purchase. But what does good onboarding look like? Learn more.
- Jan 8, 2025|Gabbie Rhodes|7 min
Ever wanted to use new features but didn't know how long it'd take to learn and integrate them? Here's insight to understand the process.
- Dec 12, 2024|Gabbie Rhodes|17 min
Getting stakeholders engaged and inspired isn't easy. However, it's not impossible, especially when you provide cool data visualizations.
- Dec 5, 2024|Gabbie Rhodes|5 min
Topographic 3D maps are great tools for delivering insights to stakeholders, but they shouldn't be used in every situation. Learn more.
- Nov 27, 2024|Gabbie Rhodes|7 min
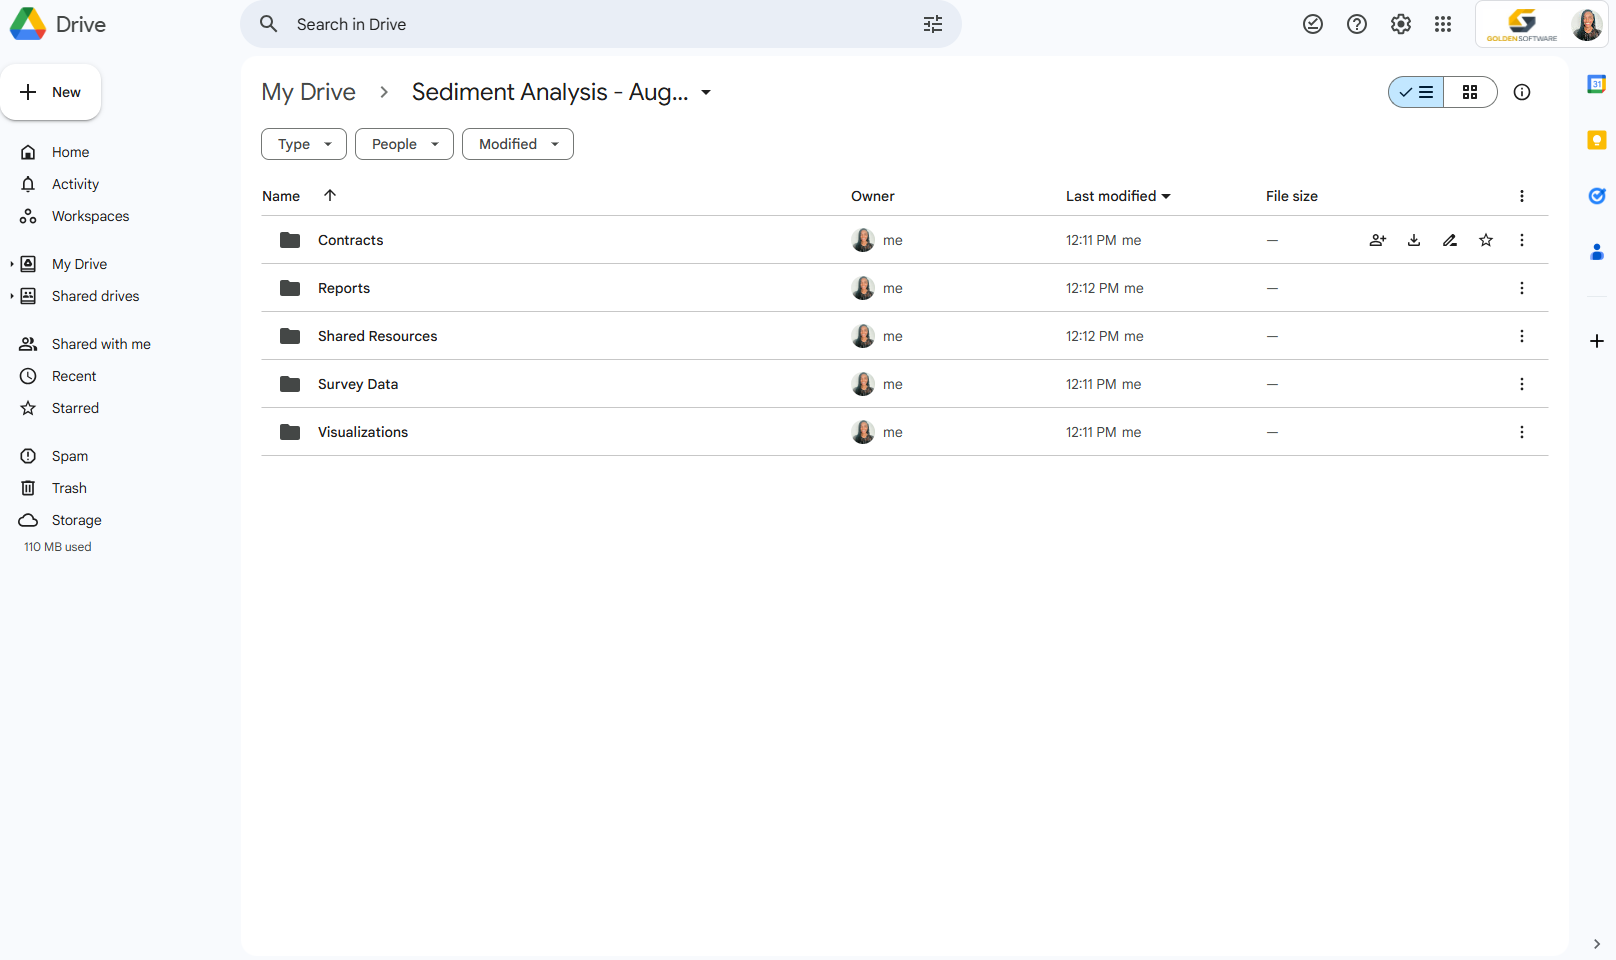
Stop wasting time searching for documents. Learn how to declutter digital files and build an efficient file management system with these 5 tips.
- Oct 24, 2024|Gabbie Rhodes|4 min
Want to create graphs that wow stakeholders? If so, there are essential design principles for effective graphing you should implement.
- Oct 16, 2024|Gabbie Rhodes|7 min
Gridding LiDAR data isn't easy for multiple reasons. Fortunately, there are best practices that make gridding this type of data easier.
- Oct 2, 2024|Gabbie Rhodes|5 min
When you have a good workflow, you may not want to change it. But there are good reasons to incorporate 3D visualization into your process.
- Sep 26, 2024|Gabbie Rhodes|7 min
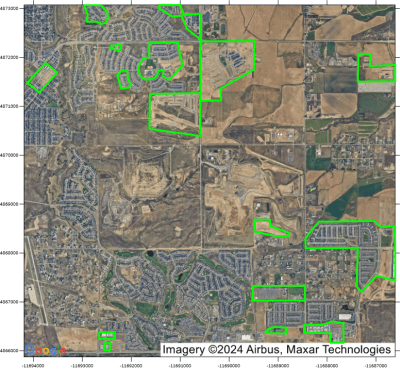
Satellite imagery can add context to your maps, but only when it's used properly. Execution matters. Learn when and how to use this asset.
- Sep 4, 2024|Katie Yoder|4 min
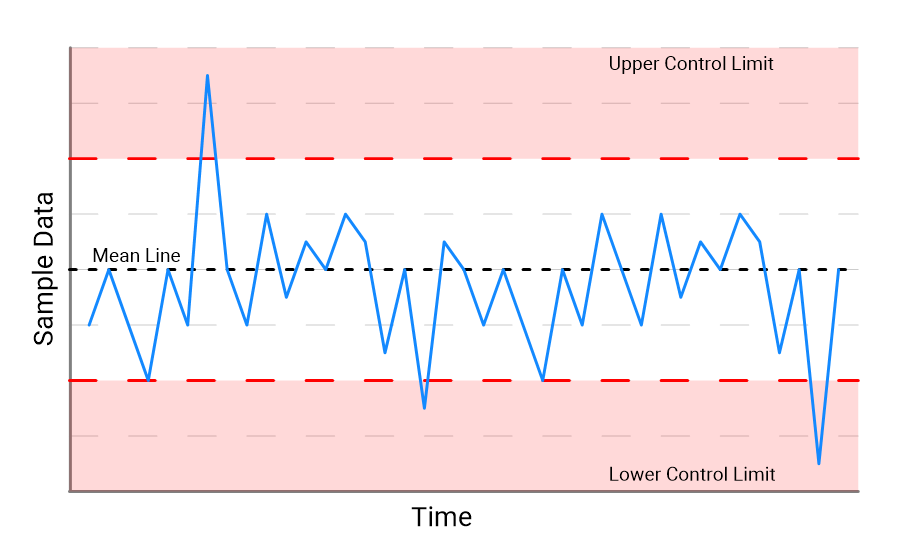
SPC charts are a powerful asset and are widely used across various industries for monitoring, controlling, and enhancing processes.
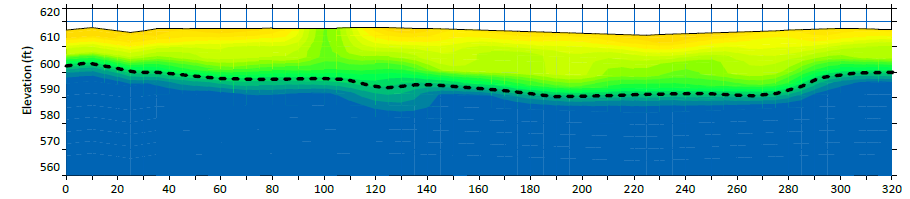
- Aug 29, 2024|Golden Software|6 min
Gridding geophysical section data comes with some unique challenges that can be overcome by using these three best practices!