Does AI Make Mistakes? What to Know Before Creating AI Maps
AI can generate a map in seconds. Upload a dataset, type a prompt, and suddenly you have contours, color gradients, labels, and even a summary of trends—all neatly packaged and presentation-ready. For busy geoscientists and engineers managing tight deadlines and complex datasets, that kind of speed is undeniably appealing.
But speed has a subtle downside.
AI-generated visuals often come with a polished veneer. On the surface, everything looks authoritative, but that’s exactly where the risk begins. When a map looks right, it’s easy to assume it is right. Yet behind that polished output may be incorrect assumptions, oversimplified models, misleading color scales, or missing geological context.
The question isn’t whether AI is useful—it absolutely is. The real question is: does AI make mistakes? The answer is a resounding yes.
Does AI Make Mistakes? The “Stochastic” Reality
When unpacking whether AI makes mistakes, it’s important to first understand how it works.
At its core, most AI systems are advanced pattern-recognition engines. They don’t understand geology, fluid flow, or structural mechanics in the way a trained geoscientist or engineer does. Instead, they predict the most statistically likely next value—whether that’s a pixel in a map, a contour line, or a summarized trend—based on patterns learned from massive training datasets. This process is stochastic, meaning it is rooted in probability, not physical law.
In simple terms, AI operates on the following:
- Statistical likelihood
- Pattern recognition
- Mathematical correlation
It does not inherently operate on these elements:
- Conservation laws or physical constraints
- Site-specific geological context
- Engineering judgment shaped by experience
That distinction matters. When a geoscientist or engineer creates a map manually, they’re not just connecting points. They’re evaluating context. They’re mentally stress-testing the output against physical reality. They’re also considering key factors like the ones below:
- Stratigraphy and depositional context
- Site history and prior investigations
- Sampling density and spatial gaps
- Anisotropy and directional trends
- Regulatory thresholds and safety implications
- Known subsurface behavior
There’s another critical mistake to keep in mind: AI lacks self-doubt.
A human expert might pause and say, “This dataset is too sparse to be confident in that trend,” or “That gradient looks suspicious given what we know about this formation.” AI doesn’t naturally express that hesitation. It presents every output with visual confidence unless explicitly prompted to calculate and display uncertainty. And in high-stakes geoscience and engineering, that gap is not trivial.
Small deviations in spatial analysis can translate into meaningful risk that present these challenges:
- A 5% error in a slope stability map can alter safety factors
- A slightly misrepresented contaminant plume boundary can affect remediation design
- An incorrect interpolation in a groundwater model can shift permitting or construction decisions
These types of errors influence budgets, regulatory compliance, structural integrity, and public safety.
Why AI Makes Mistakes With Maps
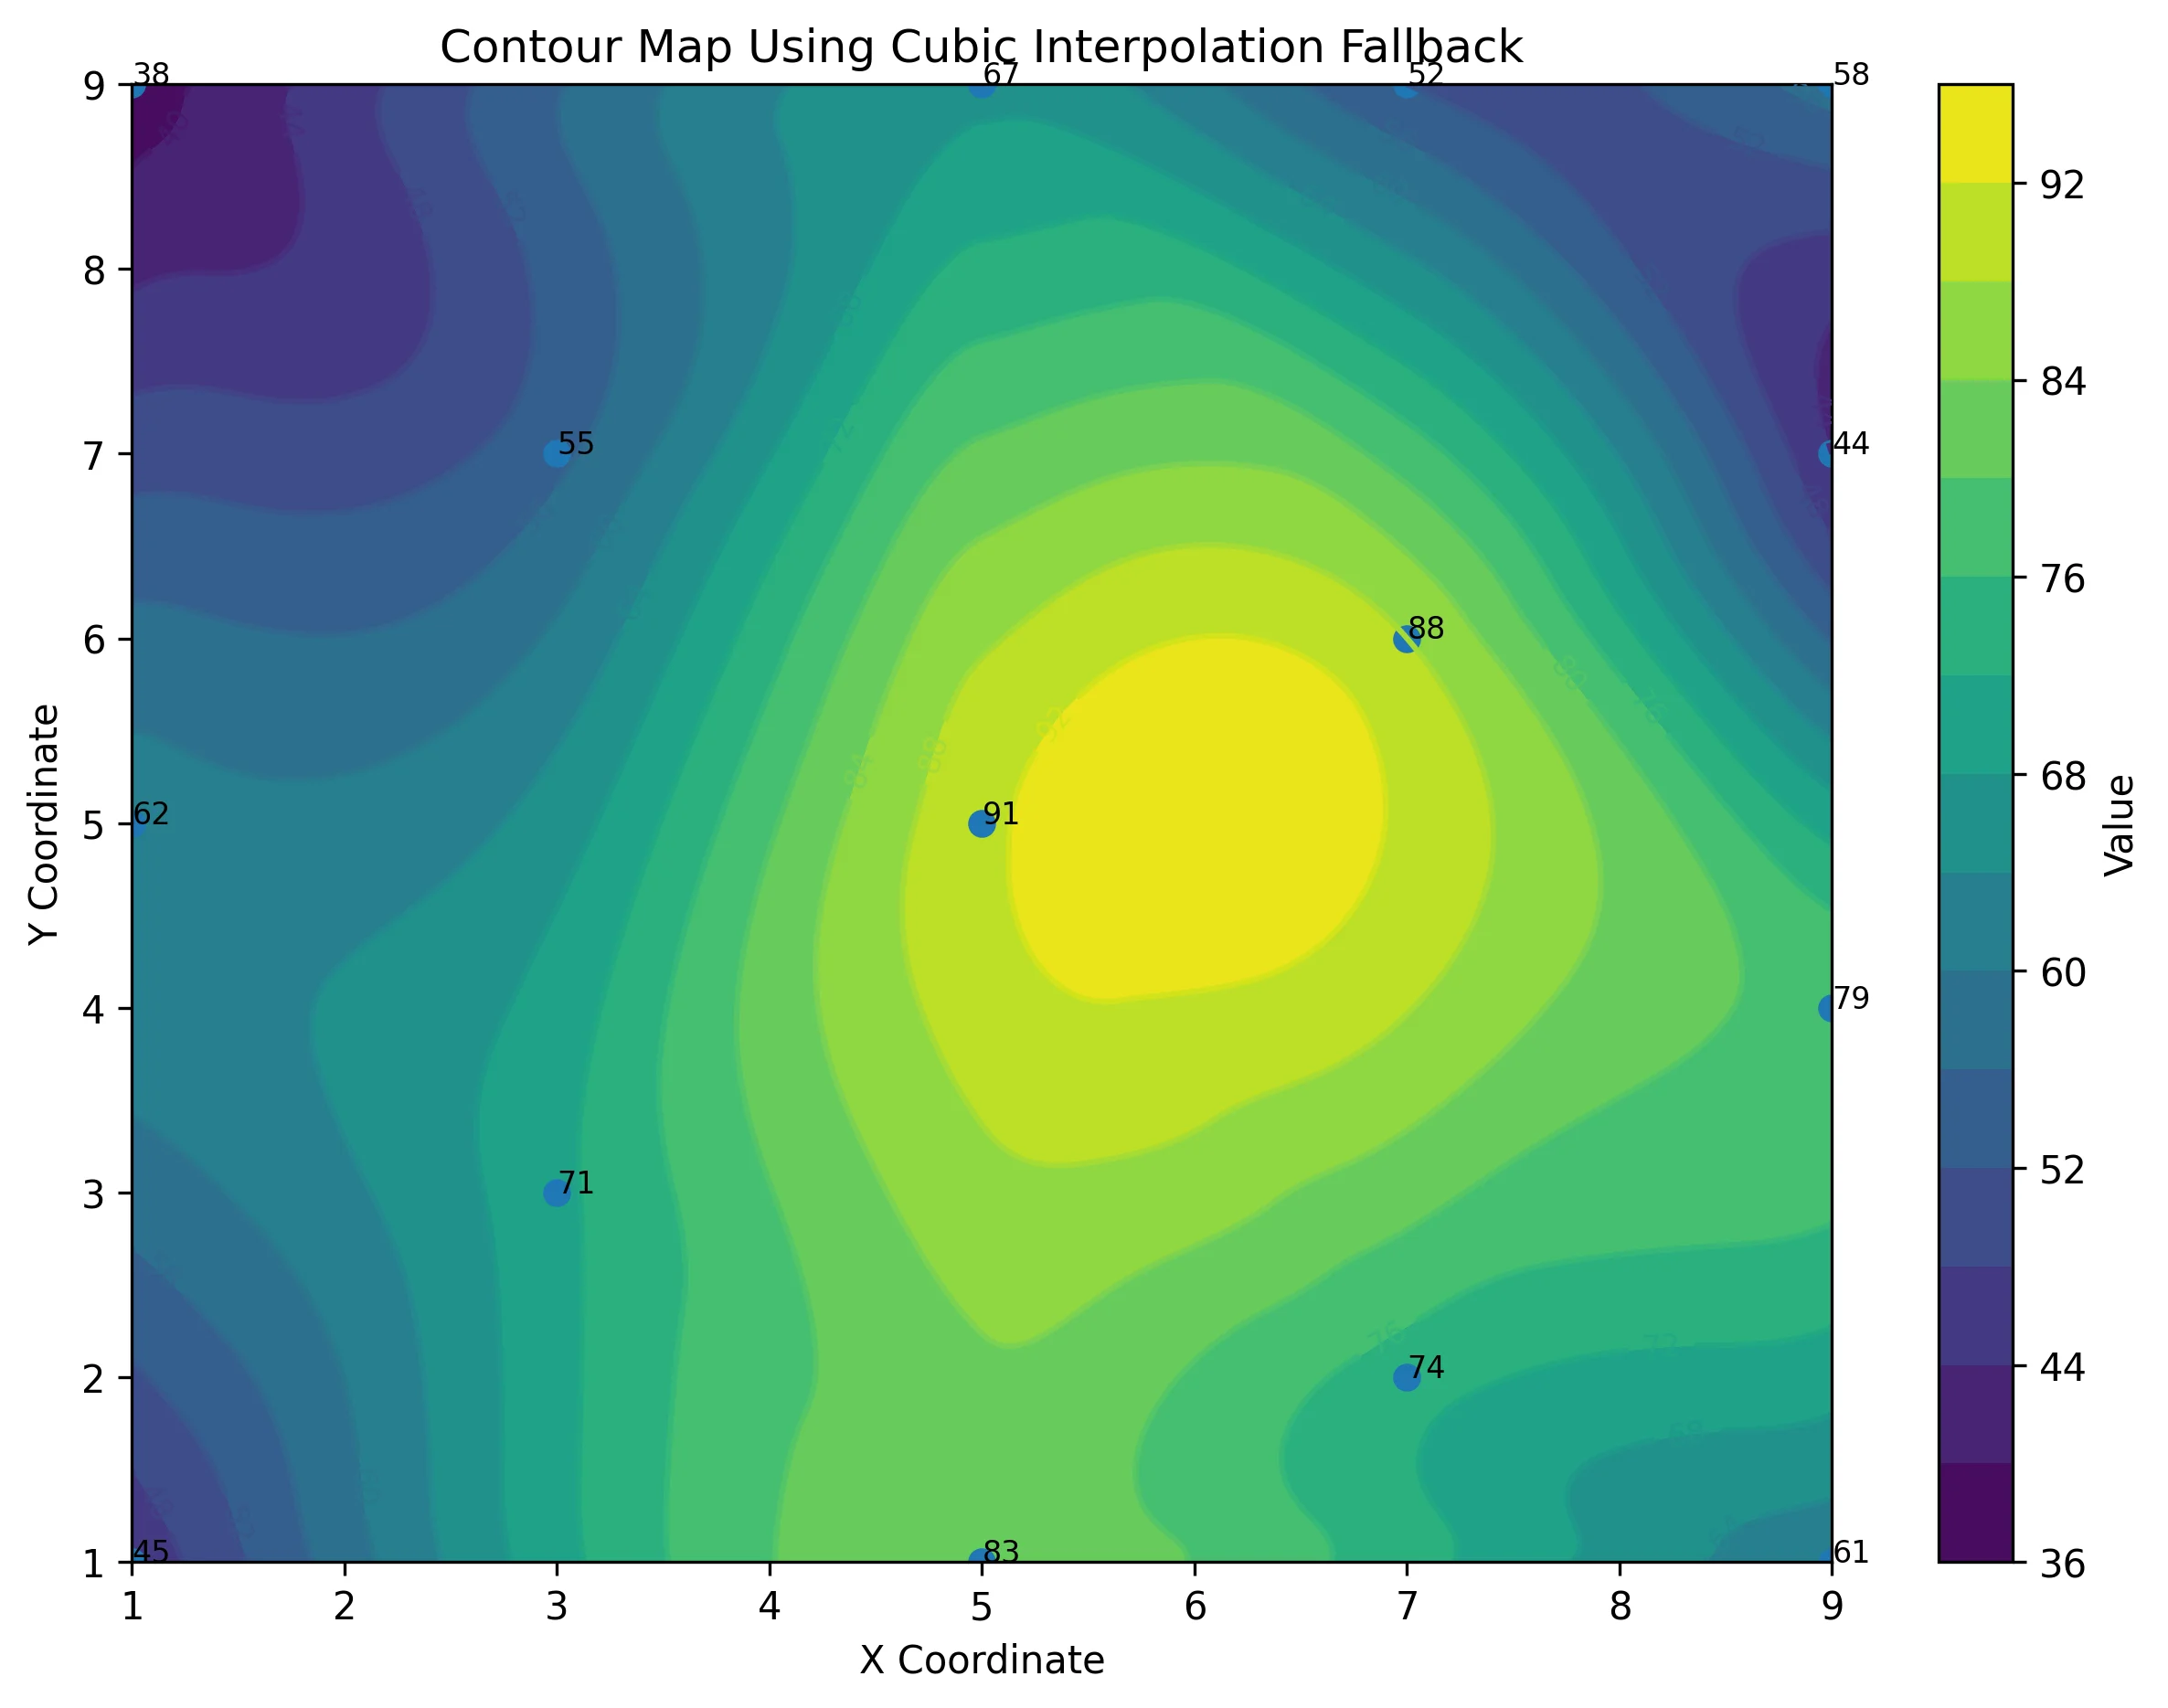
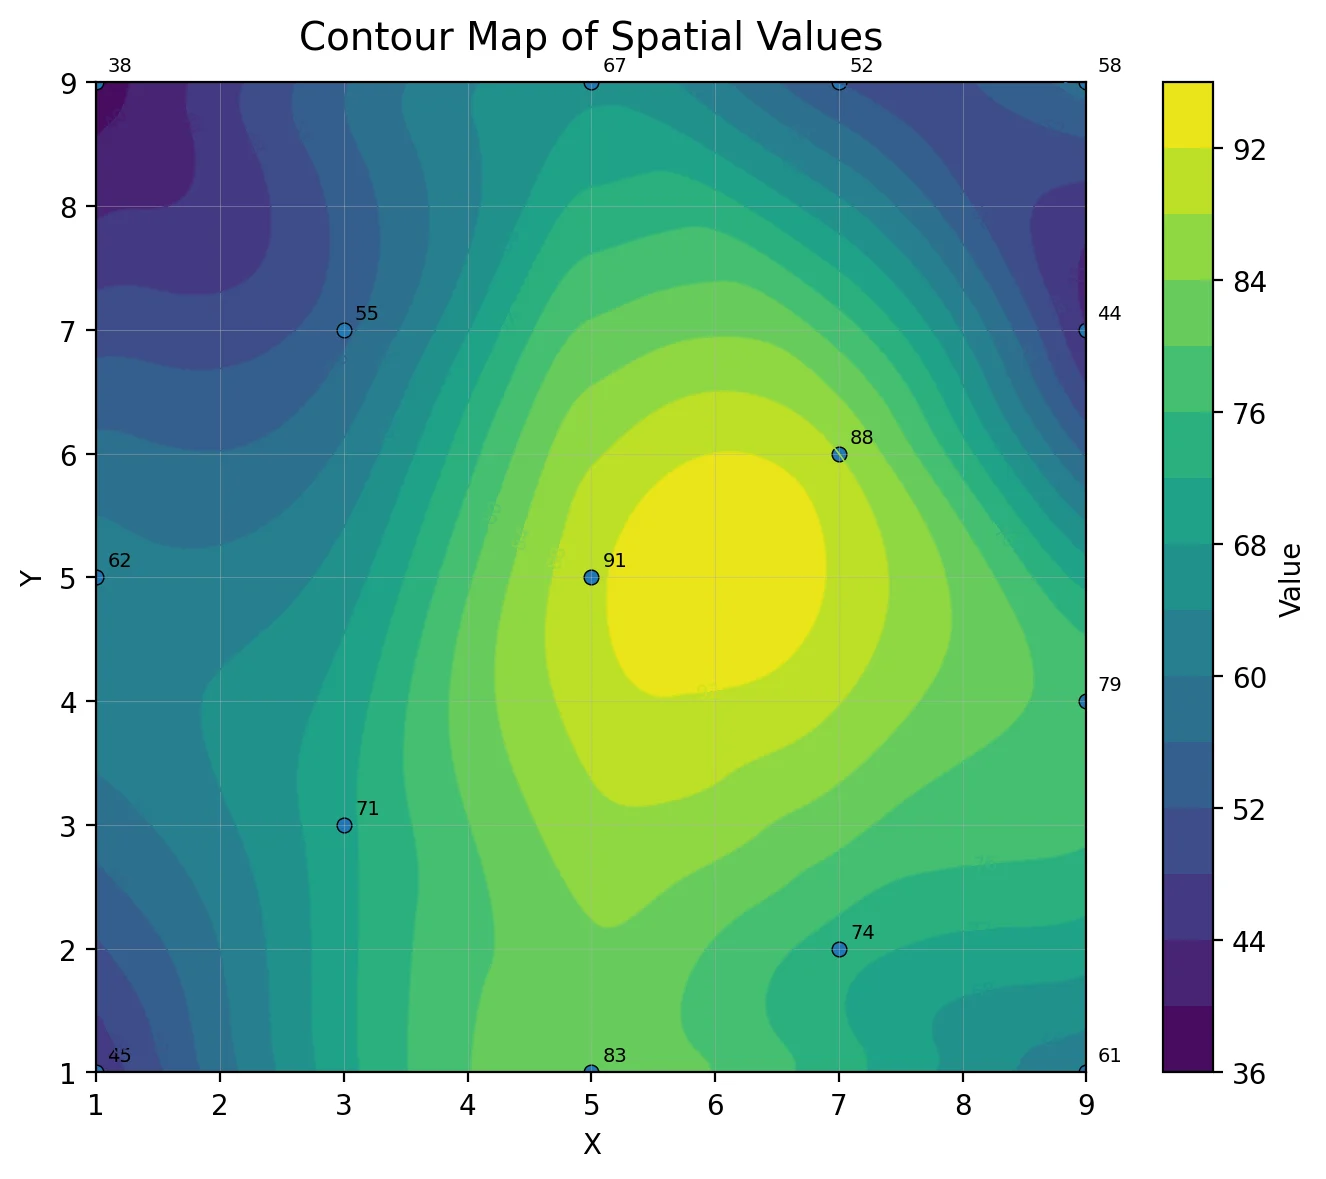
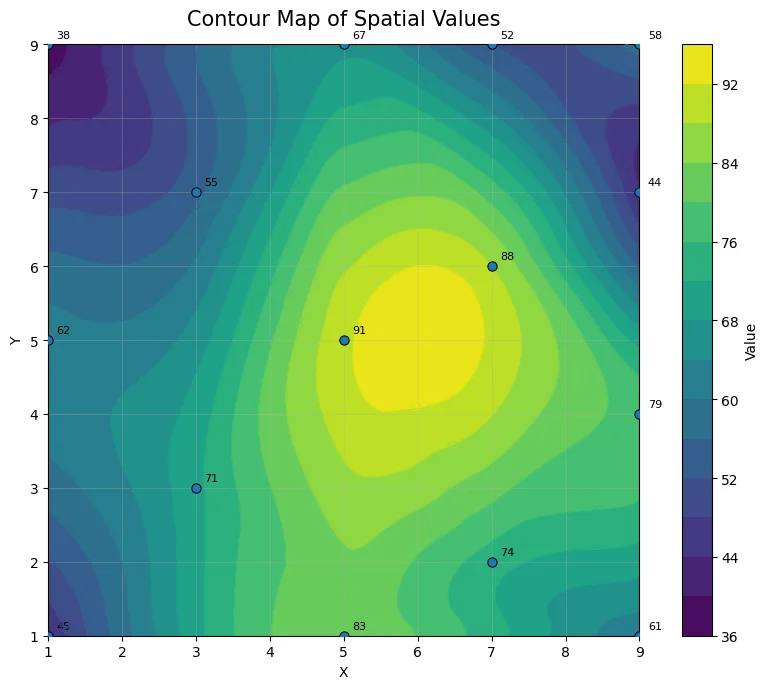
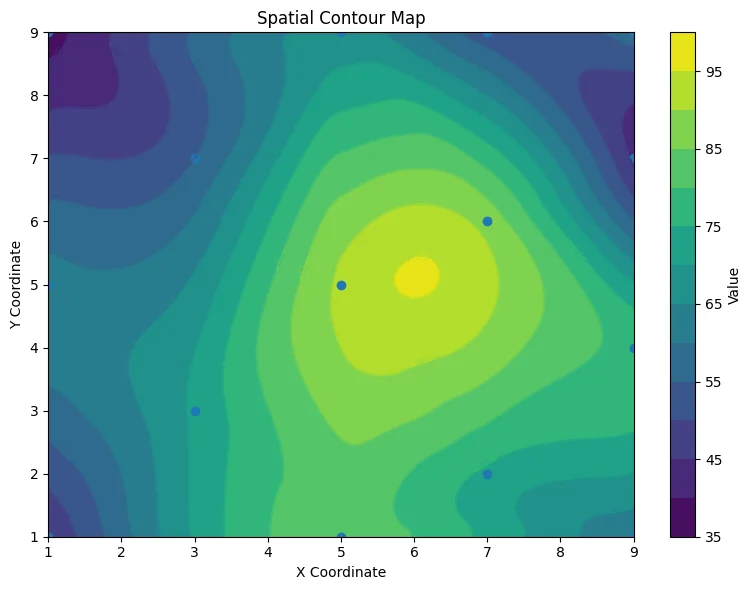
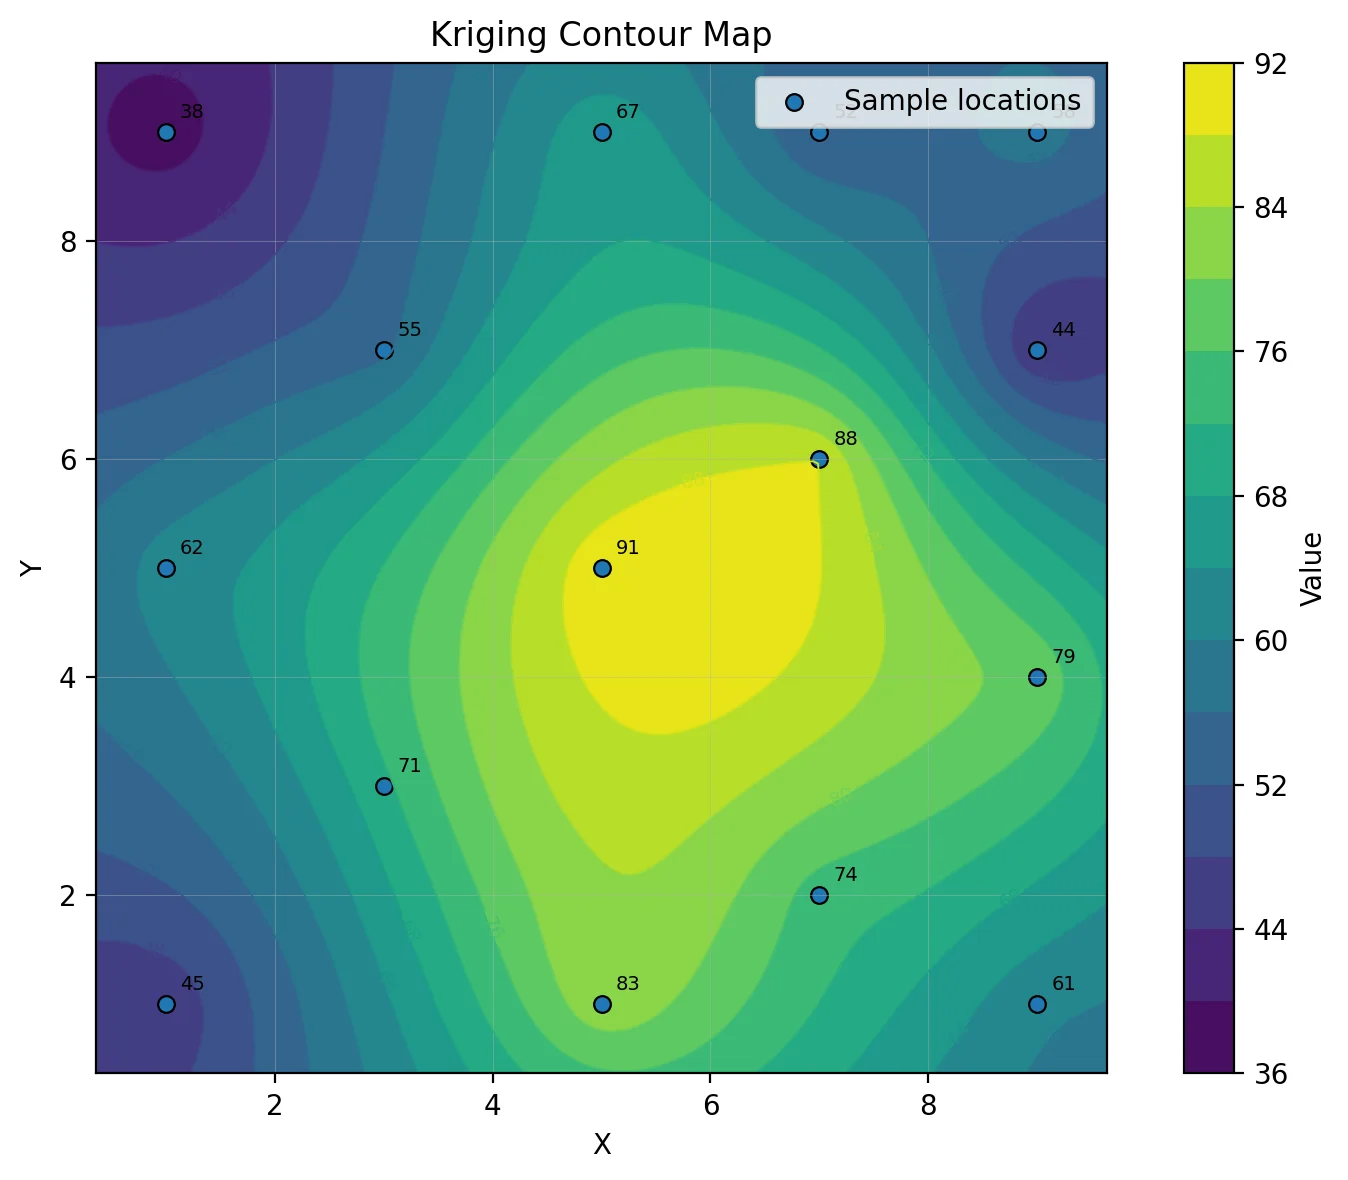
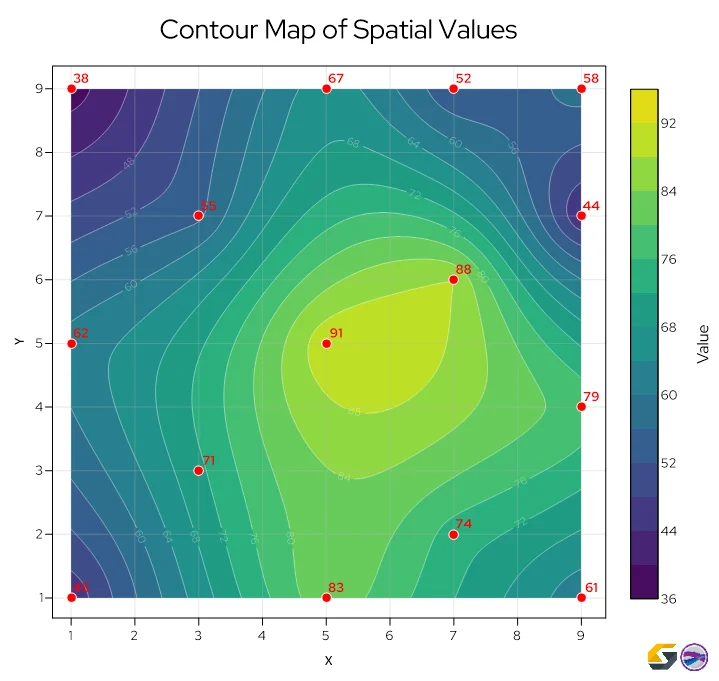
Fortunately, because AI’s limitations are structural, AI mistakes tend to fall into three predictable categories in scientific mapping: interpolation and visualization struggles, lack of reproducibility, and limited domain expertise combined with “black box” logic. Let’s unpack the mapping failures AI makes in these categories. Keep in mind that the AI-generated maps below—which were all created using the same dataset in ChatGPT—help put the mistakes within each category into perspective.
1. Interpolation & visualization struggles
AI-generated maps often look smooth and professional. However, under the surface, the math may not align with best practices. Here are some issues that typically arise.
The Interpolation Blindspot
AI may default to simpler interpolation methods. Even when prompted for advanced techniques, it might still use simpler methods such as Inverse Distance to a Power (IDP) or Linear Interpolation without clearly informing the user. The result is a surface that looks legitimate but is based on a different mathematical assumption than intended.
Spatial Hallucinations
AI dislikes empty space. When faced with null values or sparse regions, it may “fill in” areas with artifacts to make a map look visually complete. That can mean inventing contour lines, smoothing gaps, or implying topographic features that do not exist in reality.
Data Respect Issues (Honoring the Data)
Sometimes, AI fails to honor input data points. Contours may not pass through measured values correctly, and surfaces may visually contradict the original dataset. In geoscience and engineering, failing to respect control points undermines the integrity of the entire model.
Fortunately, specialized software provides the necessary levers to enforce accuracy, such as refining the grid resolution, selecting a new gridding algorithm, or adding more data points. But AI typically lacks these manual override capabilities, making it harder for you to force the model to respect the physical reality of your measurements.
Training Data Bias (The “Internet Data” Trap)
AI may appear impressively accurate when working with widely available example datasets, especially those likely included in its training. But when presented with unique, site-specific project data, performance often degrades. What looks like “intelligence” may simply be pattern familiarity.
Ignoring Metadata & Units
AI treats numbers as abstract values. It might not recognize that one “10” represents meters while another represents feet. Mixing units—especially on the Z-axis—can produce dangerous scaling distortions that are visually subtle but technically significant. While specialized mapping software equips you to manually define, convert, and reconcile these units to ensure technical accuracy, AI lacks these specific unit management tools, leaving you with little to no way of verifying or correcting the underlying scale.
Aesthetic Bias
AI is optimized to produce visually pleasing results. That means it may smooth sharp spikes or anomalies to create a more “natural” surface. In geoscience, however, that spike might represent contamination, instability, or a critical structural boundary, the very feature users wouldn’t want to soften.
The “Rainbow” Trap
Oftentimes, AI defaults to vibrant, high-contrast color scales. These vibrant gradients often lack perceptual uniformity, meaning the visual ‘jump’ in color doesn’t correlate to the actual mathematical jump in data. This can lead an engineer to perceive a steep cliff where there is only a gentle slope. To prevent this, specialized mapping software typically offers a library of perceptually uniform colormaps, empowering users to select a gradient that accurately reflects their data’s true values rather than being stuck with a misleading aesthetic default.
The “Bullseye” Effect
When data is sparse, AI may over-emphasize individual points, creating unrealistic rings or bubbles around them. Instead of reflecting a natural spatial trend, the map becomes a series of exaggerated focal points, misleading users into over-interpreting isolated measurements.
Professional technical software helps mitigate this effect by equipping users with various solutions, including regridding data and changing the smoothing value. These specialized tools empower users to guide the interpolation toward a more sound result that an AI platform cannot achieve on its own.
2. The failure of reproducibility
Scientific data visualization software is deterministic. Given the same dataset, the same parameters, and the same algorithm, it produces the same result every time. AI does not operate that way. Here are two things to keep in mind.
Same Input, Different Output
Running the exact same dataset through an AI system multiple times can yield different visual structures. Slight changes in prompts—or even no changes at all—may produce different interpolation shapes, contour densities, or smoothing behaviors.
Non-Reproducibility
If you cannot press “recalculate” and obtain the exact same result with a documented formula and parameters, the output becomes scientifically indefensible. In geoscience, engineering, environmental consulting, or regulatory reporting, reproducibility is foundational. Without it, a map or model cannot reliably support formal reports, compliance documentation, or expert testimony.
3. Limited domain expertise & the “black box” problem
Even when AI generates something that looks technically plausible, there’s a deeper issue: you cannot fully see how it arrived there. Below are a couple of common problems.
3D Modeling Constraints
AI can generate 3D code (such as HTML/Plotly visualizations) in seconds. But the underlying geometry often fails to represent true subsurface relationships accurately. Surfaces may intersect incorrectly, volumes may be miscalculated, and structural continuity may be implied where none exists.
The “Black Box” Problem
In regulated environments, geoscientists and engineers must be able to document their workflow. That means showing the gridding method used, the search radius applied, the assumptions made, and the variogram parameters selected. AI does not provide a clear audit trail of its internal decision-making. For example, you can’t inspect its variogram or validate its weighting scheme.
How to Use AI Responsibly: A Human-in-the-Loop Workflow
Nothing we’ve said means AI should be avoided entirely. The goal isn’t to reject AI but to encourage using it with parameters. AI can be a powerful accelerator in geoscience workflows, but it should function as an assistant, not the final authority. The key is maintaining a human-in-the-loop approach, where domain expertise remains the decision-maker. Here’s what that looks like in practice.
Use AI for the “grunt work”
One of the most effective ways to use AI responsibly is to assign it the mundane, low-level, and repetitive tasks that slow down technical workflows but don’t require deep domain judgment. AI can be extremely helpful for the following tasks:
- Initial data cleaning and reformatting
- Writing or debugging Python scripts
- Converting file types
- Drafting report summaries
These are areas where speed adds value and the technical risk is relatively low. Let AI accelerate the mundane parts of your work so you can spend more time visualizing data, interpreting results, validating assumptions, and driving informed decisions.
Pro Tip: Avoid the “Instruction Hallucination”
While AI can tackle a lot of grunt work, there’s one thing you should not ask it to do: provide step-by-step instructions on how to use professional data visualization software. In our experience, users seeking technical guidance often receive incorrect directions on how to use a software’s features. Of course, AI’s responses are delivered with total confidence but end up causing frustration and unmet expectations. For software-specific “how-to” guidance, always rely on official help documentation, verified knowledge bases, or customer support.
Prioritize specialized software for final outputs
AI can assist with general mundane tasks, but final deliverables—especially for geoscience, engineering, or any scientific field—require precision and defensibility. That’s why professional data visualization software is still necessary. Here are a couple of reasons that give deeper context.
The Precision Gap
AI often struggles to correctly apply advanced algorithms such as Kriging, sometimes defaulting to simpler interpolation methods without disclosure. Specialized geoscience software provides explicit control over search parameters, gridding methods, and variograms, ensuring the surface reflects your intent.
The Need for Reproducibility
As established earlier, scientific defensibility relies on deterministic results. Using professional tools ensures your final deliverables can withstand peer review, regulatory audits, and legal scrutiny—all of which stochastic AI outputs can’t guarantee.
Speed + Specialized Control: Finding the Right Balance
AI is not the enemy of good data visualization and interpretation. In fact, when used correctly, it can make technical workflows faster and more efficient. The most effective approach isn’t choosing between AI and specialized software—it’s combining them. Let AI handle the repetitive grunt work. Then rely on domain expertise and purpose-built tools to visualize, refine, and finalize your analysis.
In the end, the expert must stay in the driver’s seat. Use AI as a capable assistant where it’s most reliable. But when it comes to interpolation methods, reproducibility, parameter control, and defensible conclusions, specialized tools and professional judgment should lead. In high-stakes mapping, accurate, transparent, and defensible results are what truly matter.
Have you ever caught an AI ‘hallucination’ in a map or a piece of code that looked perfect at first glance? Share your ‘near-miss’ stories in the comments—it helps us all learn what to look out for!
Recent Articles
- Jun 23, 2026|Gabbie Rhodes|10 min
Ever stop and wonder: does AI make mistakes? Before you start using AI tools to create your maps, discover the answer to this key question.
- Jun 23, 2026|Gabbie Rhodes|7 min
What contributions are women making in STEM? Discover eight examples of women in STEM fields and the meaningful impact they’re making.
- Jun 17, 2026|Gabbie Rhodes|8 min
Both work and family require energy and intentionality. To ensure you approach them effectively, discover tips to balance work and family life.
- Jun 17, 2026|Gabbie Rhodes|11 min
Senior Technical Sales Specialist Drew Dudley hosted a webinar to provide tips for ensuring coordinate systems display accurately and consistently.