A Deeper Dive into the Oxbow Lakes of New England
Previously we have worked with Steve Boynton on a blog titled: Striking LiDAR Map Reveals “Hidden” Features of the Baker River”. The blog detailed how Surfer can leverage LiDAR Data to highlight hydrologic features. Recently, we had the chance to follow up with Steve Boynton and we discussed some interesting additions to his findings as they related to the Baker River, oxbow lakes, and the original article.
Depositional Zones Along the Baker River
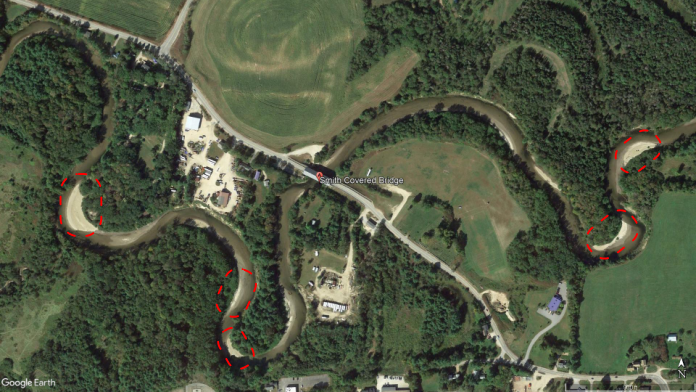
An oxbow lake, like the crescent shaped lakes that can be seen in the previous article, is created over a long period of time as soil erosion and deposition change the course of the river. During the deposition/erosion process, water flowing around a curved meander of the river moves faster around the outside of the curve, and slower around the inside. Suspended sediment is then deposited on the inside of the curves as the flow velocity decreases. You can clearly see this sediment deposition along the Baker River when looking at a recent aerial image and highlighting the areas in Surfer.
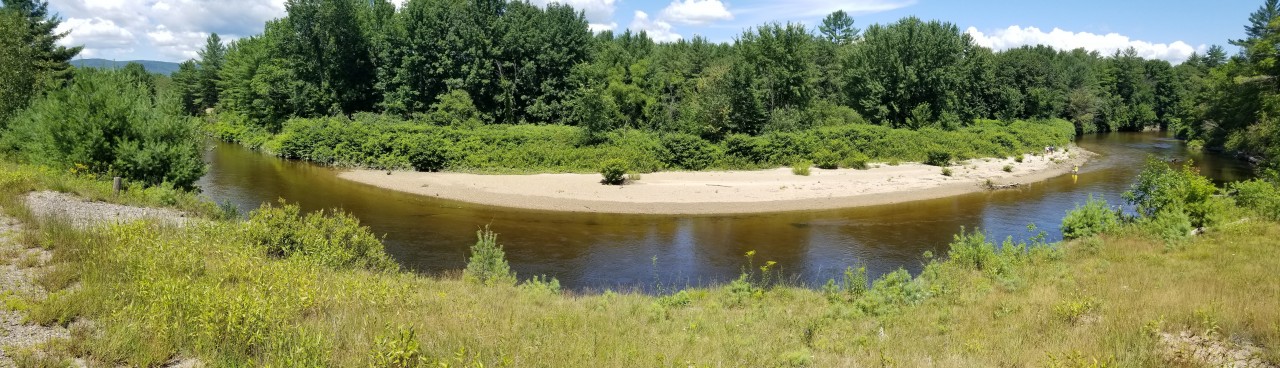
For the Baker River, the sediment is primarily sand and gravel since the river is so close to the steep White Mountains of New Hampshire. According to Boynton the sand and gravel that make up the soil create a safe area to walk along so long as the river level is low. A close up of one of these sediment areas and an aerial map of the areas can be seen below.
Formation of Oxbow Lakes
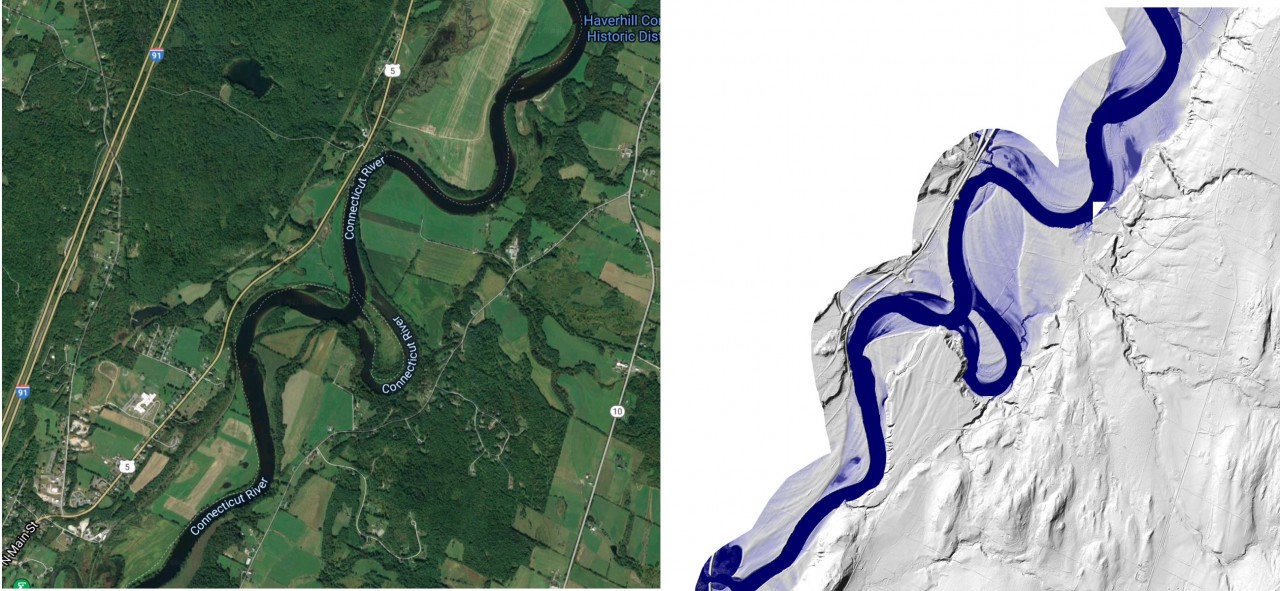
Over time, faster moving water on the outside of the curves continually erodes and undercuts the river bank. As this process continues the river meanders become more pronounced. Eventually, the bank between adjacent curves is breached, and the river starts following the new straight segment created by the breach. You can see an example of this at a recently breached oxbow of the nearby Connecticut River on the border of New Hampshire.
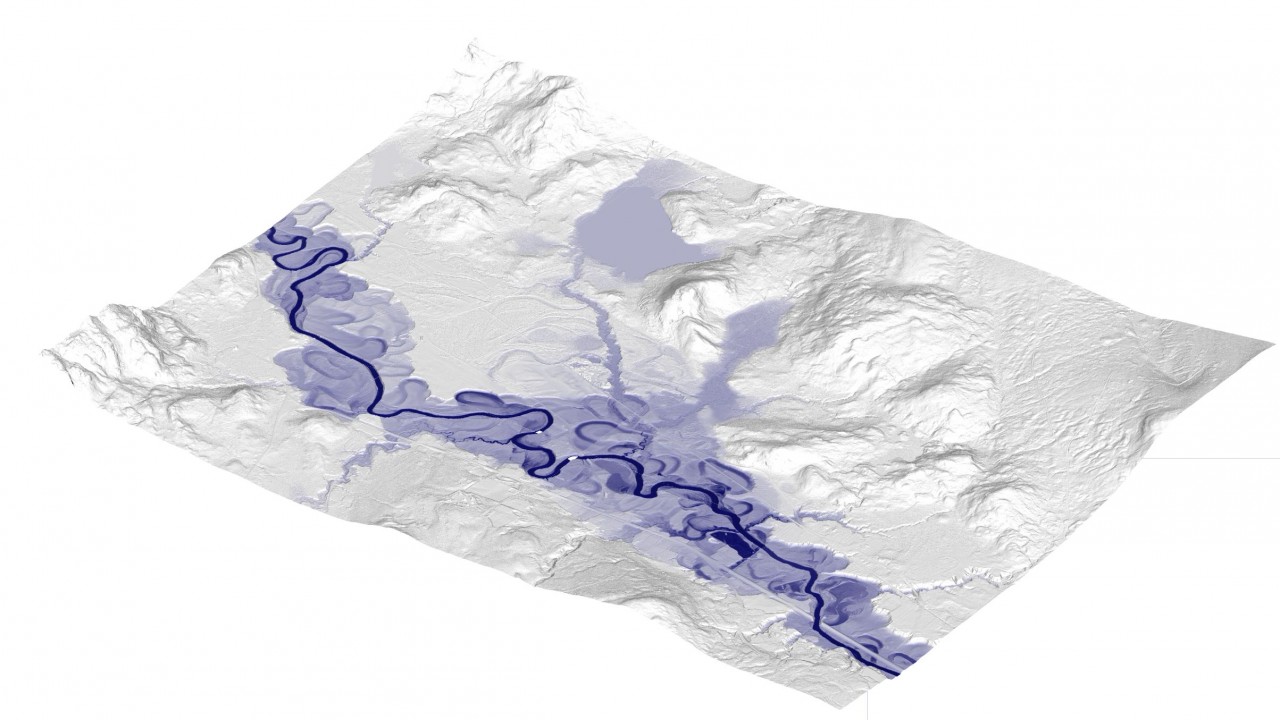
Modeling Hydrologic Features in 3D
Steve was curious what it would look like to take this LiDAR map style he has been working on into a 3D space. By using Surfer’s 3D view he was able to create a stunning model highlighting the meandering Baker River channel, oxbow lakes, and surrounding White Mountain foothills.
As always, we greatly appreciate Steve’s time as he shares his work with us and you can view more of his work at the link below.
Instagram: @subsurface_env
Recent Articles
- Jun 23, 2026|Gabbie Rhodes|10 min
Ever stop and wonder: does AI make mistakes? Before you start using AI tools to create your maps, discover the answer to this key question.
- Jun 23, 2026|Gabbie Rhodes|7 min
What contributions are women making in STEM? Discover eight examples of women in STEM fields and the meaningful impact they’re making.
- Jun 17, 2026|Gabbie Rhodes|8 min
Both work and family require energy and intentionality. To ensure you approach them effectively, discover tips to balance work and family life.
- Jun 17, 2026|Gabbie Rhodes|11 min
Senior Technical Sales Specialist Drew Dudley hosted a webinar to provide tips for ensuring coordinate systems display accurately and consistently.