How to Visualize Geophysical Data in 3D for Better Subsurface Insight
Geophysical profiles offer powerful insight into what’s happening beneath the surface. Whether you’re analyzing resistivity, seismic velocity, or other subsurface measurements, profiles help reveal structures, anomalies, and material changes along a defined line. They’re essential tools for understanding the underground story. They’re essential tools for understanding the underground story your geophysical data presents.
But when profiles are viewed in isolation, something is missing.
A single geophysical profile can feel disconnected from the broader landscape. It becomes harder to understand where that line sits relative to topography, infrastructure, drillholes, or adjacent survey lines. You may clearly see an anomaly but not fully grasp its spatial relationship to the rest of the site. The geophysical data is valuable, but interpretation requires mental reconstruction. The solution? 3D visualization.
The Limitation of Viewing Geophysical Profiles in 2D
To understand why 3D matters, we first need to examine how geophysical profiles are typically presented and what that format limits.
Traditionally, geophysical profiles are viewed as flat, standalone slices of geophysical data displayed independently from the surrounding landscape. On their own, these 2D representations can be incredibly detailed. They can show changes in values along a line, highlight anomalies, and reveal structural variations beneath the surface. However, they still have limitations.
When profiles are confined to a 2D view, you can encounter these challenges:
- Limited spatial awareness, making it difficult to visualize how the profile fits within the broader site
- Difficulty relating the profile to real-world features like terrain, roads, boreholes, or infrastructure
- Increased complexity when comparing multiple profiles collected across an area
For example, if you collect several survey lines across a site, each geophysical profile may look clear individually. However, understanding how those lines intersect, align, or correlate spatially requires jumping through mental hoops. You have to imagine how they fit together rather than seeing the relationships directly.
That cognitive effort can slow interpretation and make communication with stakeholders more difficult. Instead of showing how subsurface features connect across space, you’re asking stakeholders to piece it together themselves.
What Changes When You Bring Geophysical Profiles Into 3D
If you bring geophysical profiles into a true 3D environment, they stop functioning as isolated slices and start behaving like spatial objects. They have real-world coordinates and occupy space, align with terrain, and relate to surrounding data. That shift immediately changes how you interpret geophysical data.
In a 3D environment, you’ll be equipped to do the following:
- See exactly where each profile sits relative to terrain and surface features
- Understand the orientation and alignment of survey lines across a site
- Compare multiple profiles across space in a single view
Here’s a scenario that puts this into perspective. If several survey lines intersect or run parallel across a study area, 3D visualization equips you to view them together. You can tilt, rotate, and zoom to understand how anomalies extend between lines. Instead of imagining continuity, you can see it visually.
This changes analysis in a meaningful way. Patterns become easier to recognize. Spatial relationships become clearer. And inconsistencies between profiles become more obvious.
It also transforms communication.
When stakeholders see profiles positioned within the landscape—aligned with topography, infrastructure, or drillholes—they don’t have to interpret a disconnected slice of data. They can see how everything fits together.
Key Elements of a 3D Geophysical Data Visualization
Now, it’s time to answer an important question: how do you actually create a 3D model so your geophysical profiles effectively communicate geophysical data? A strong visualization intentionally layers context so interpretation becomes clearer and more defensible. That said, here are several elements to consider adding to transform isolated geophysical profiles into a cohesive 3D model.
Align profiles with real-world coordinates
Everything begins with spatial accuracy.
Start by defining each profile path using polylines that reflect the actual survey lines collected in the field. These polylines serve as the structural backbone of your visualization. Once defined, position each geophysical profile precisely within the correct coordinate system.
To ensure spatial integrity, take steps such as the following:
- Use surveyed or GPS-derived coordinates for profile paths
- Confirm projection settings match other site datasets
- Validate alignment against known surface features or control points
This step is critical because it anchors geophysical data to real-world geography. Without accurate positioning, even the most detailed profile loses credibility. When profiles are properly georeferenced, you can confidently compare them with terrain, boreholes, infrastructure, and other spatial datasets.
Add topography for surface context
Incorporating elevation data as a grid surface adds immediate context. When topography is included, you can evaluate how anomalies relate to slopes, ridgelines, depressions, drainage pathways, or engineered features.
Adding surface context empowers you to achieve these objectives:
- Assess whether subsurface anomalies align with surface expressions
- Identify relationships between elevation changes and geophysical responses
- Communicate findings more intuitively to stakeholders
For example, an anomaly that appears significant in a 2D geophysical profile may align directly with a surface feature once placed in 3D. That spatial alignment can change how you interpret the cause and extent of the feature.
Overlay aerial imagery
Once profiles and terrain are positioned correctly, overlaying aerial imagery provides an additional layer of clarity.
You should align imagery to the same coordinate system to ensure accurate placement. When done correctly, this step accomplishes several things:
- Provides a familiar visual reference for stakeholders
- Helps orient viewers quickly within the site
- Bridges the gap between technical data and real-world recognition
When someone sees recognizable roads, buildings, or landscape patterns, they immediately understand where the profile sits. That familiarity reduces explanations and improves communication effectiveness.
Visualize profiles above or below the surface
One of the advantages of a true 3D environment is flexibility. Depending on your objective, you may choose to position profiles slightly above the ground surface to improve visibility, or below the surface for a more realistic representation of subsurface conditions.
To enhance clarity, consider making these adjustments:
- Elevating profiles slightly to prevent visual obstruction by terrain
- Applying transparency to surface layers
- Adjusting lighting to emphasize profile contours
The flexible options in 3D empower you to tailor a visualization to your analytical goal. During internal analysis, realism may be prioritized. During stakeholder presentations, visibility and clarity may take precedence.
Add supporting 3D data (optional but powerful)
To move from profile visualization to site-wide modeling, incorporate additional 3D datasets.
Depending on the project, you may choose to include these elements:
- 3D grids representing interpolated subsurface properties
- Surfaces such as groundwater elevation or bedrock topography
- Boreholes or other spatial investigation points
Layering these datasets creates a more complete framework for interpreting geophysical data. It equips you to test interpretations directly. Does the anomaly intersect the groundwater surface? Does it align with borehole lithology? The more integrated the model, the stronger the analytical confidence.
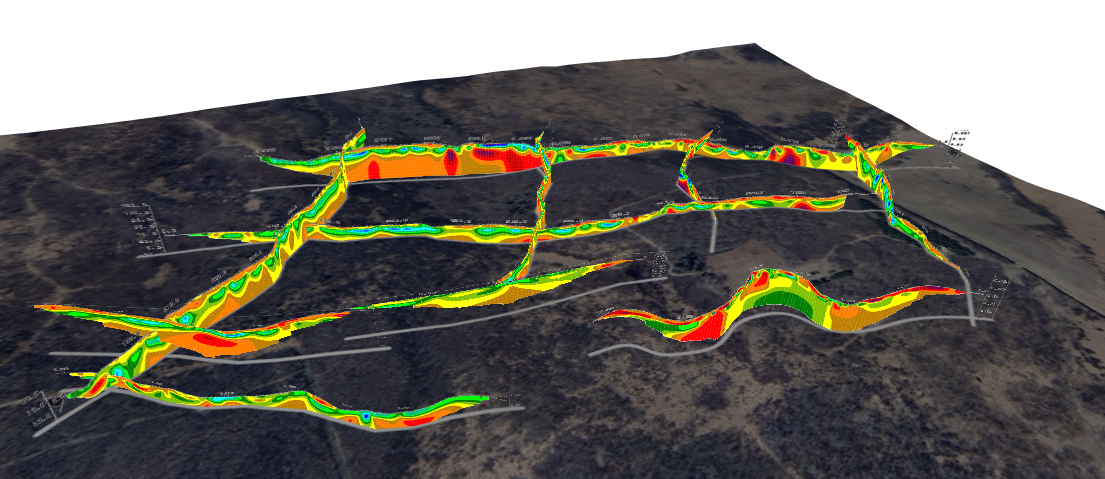
Compare multiple profiles to reveal site-wide patterns
Finally, one of the most significant advantages of 3D visualization is the ability to evaluate multiple profiles simultaneously.
When several profiles are aligned along their true spatial paths, you can analyze continuity across the site more effectively.
To uncover broader patterns, you can do the following:
- Rotate the model to observe alignment between anomalies
- Assess whether features extend consistently across multiple lines
- Identify gaps or inconsistencies in data coverage
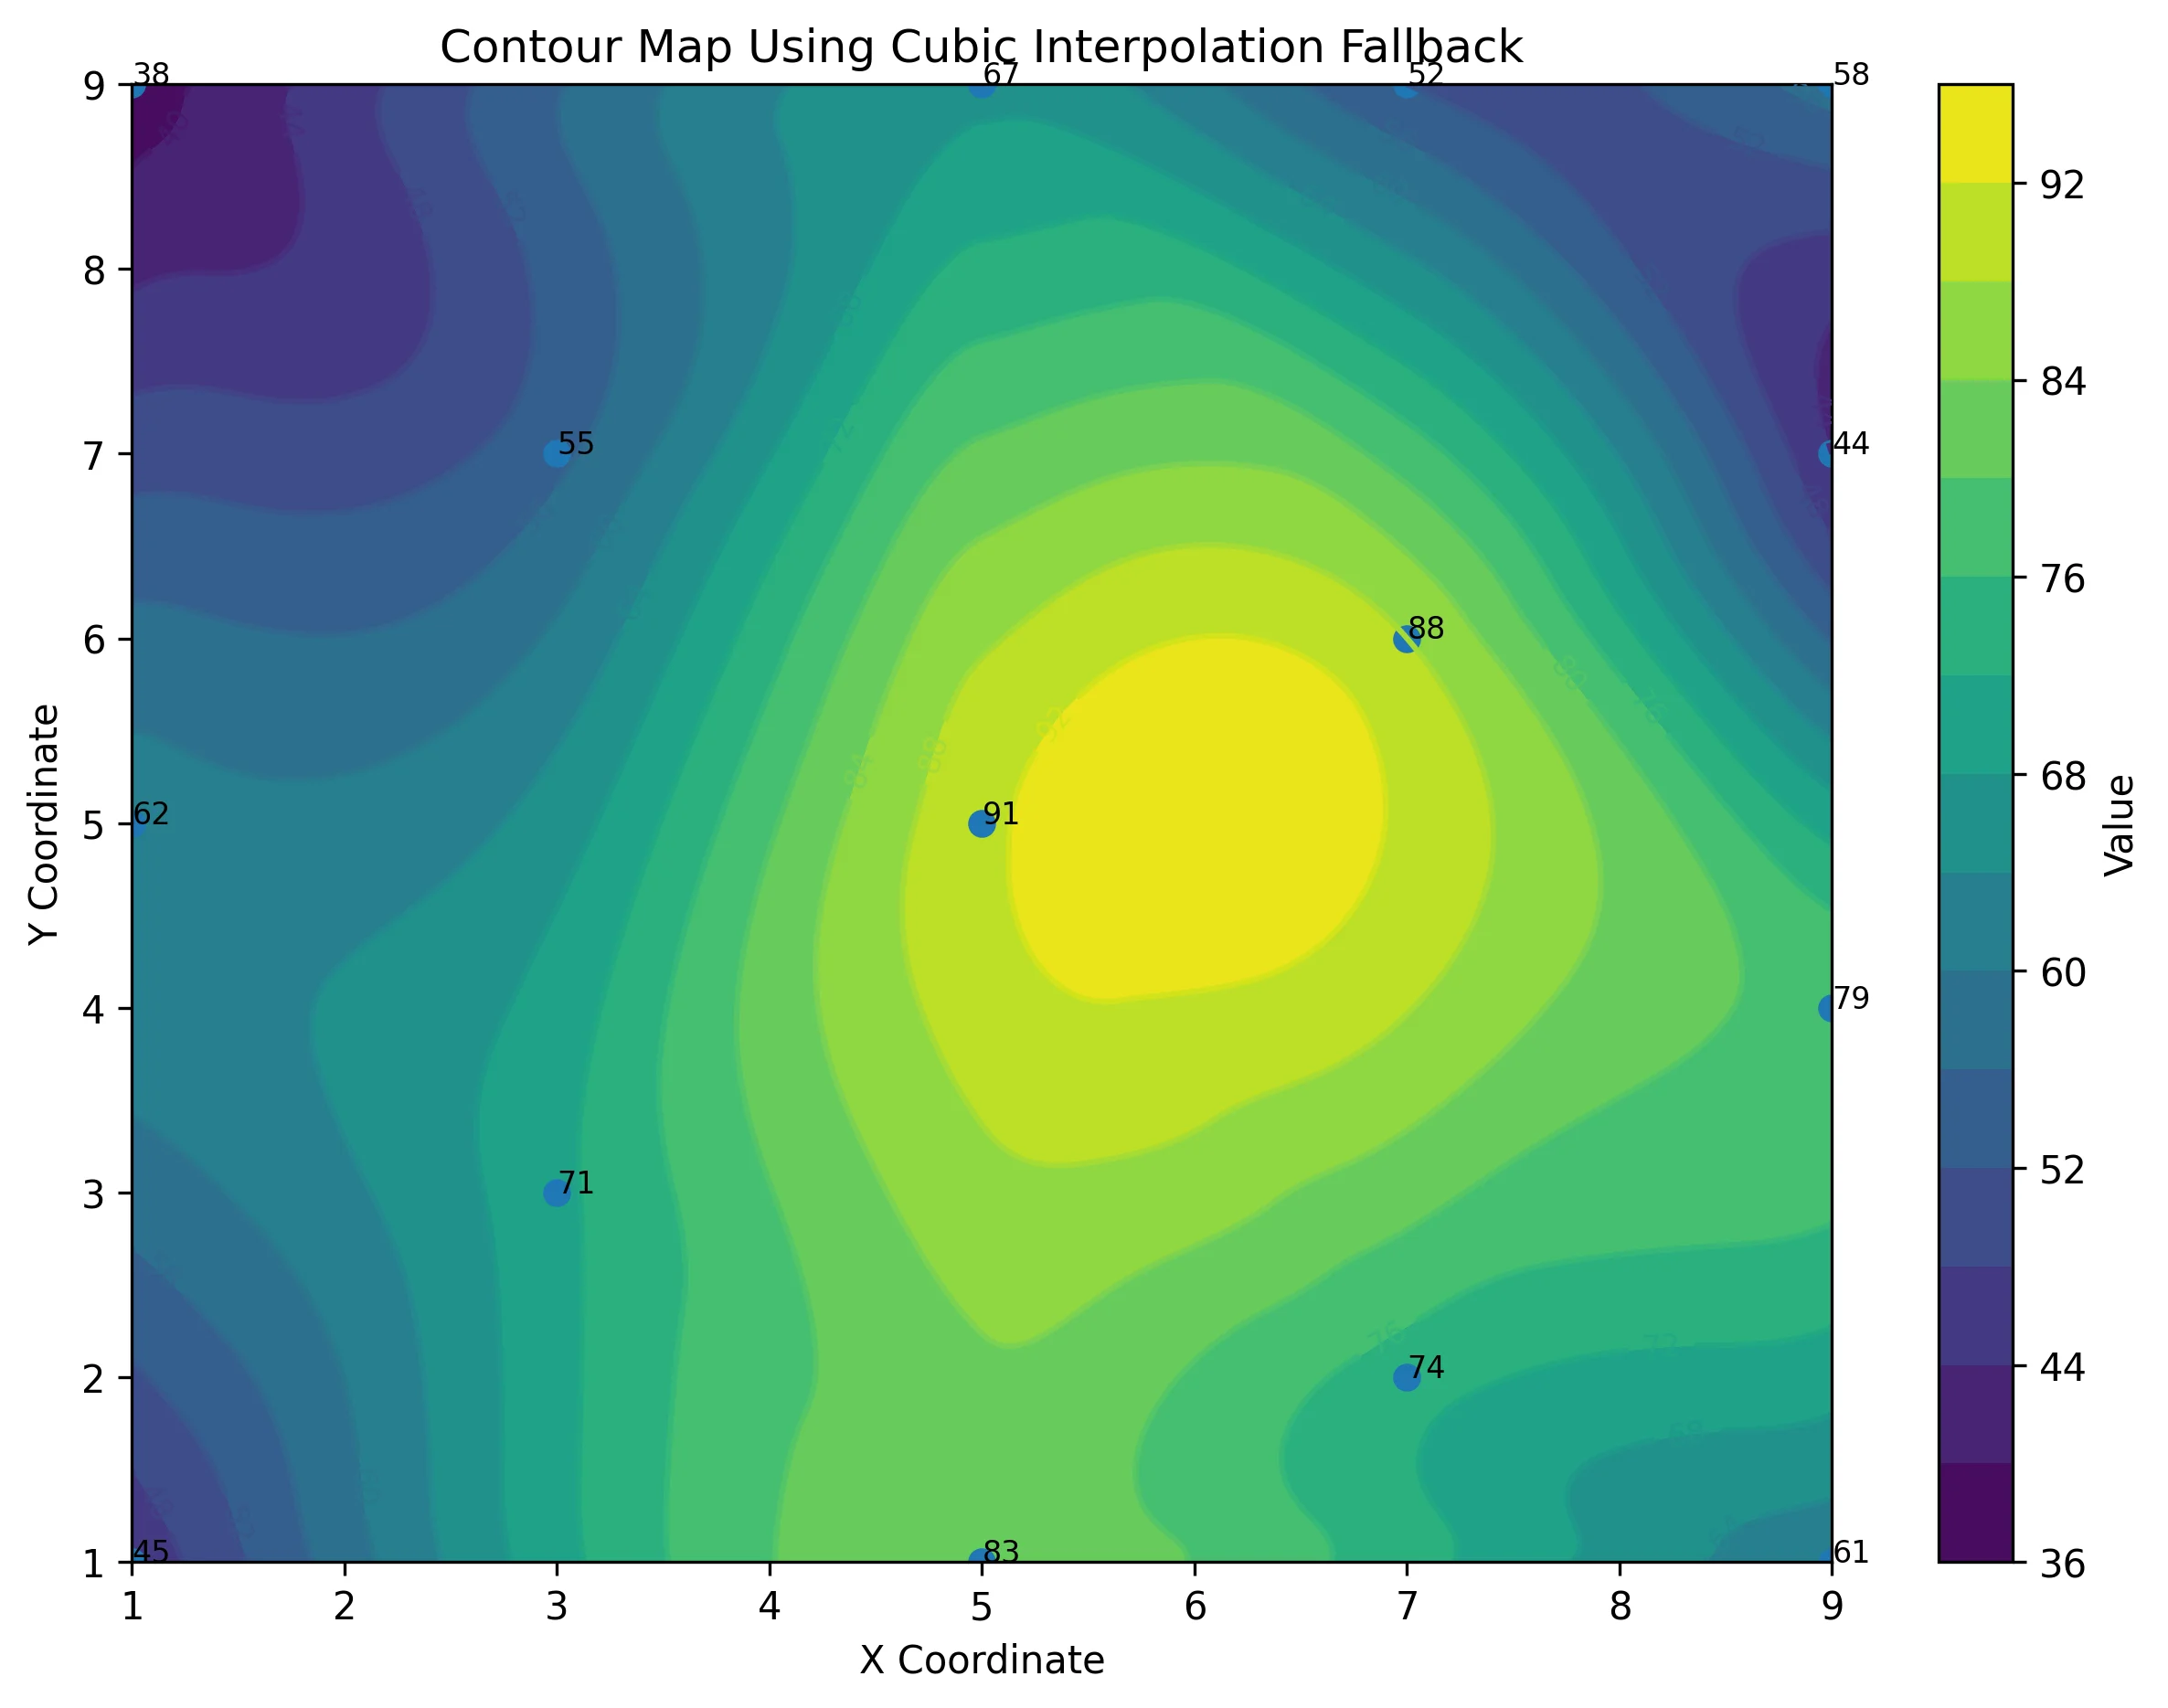
When contour visualizations are combined across profiles, spatial relationships become clearer. Trends that are difficult to detect in isolated 2D sections emerge naturally in a 3D environment. This is where 3D visualization moves beyond presentation to enhance interpretation.
See the Full Picture and Help Others See It Too
Bringing geophysical profiles into a true 3D environment changes how you interpret and communicate geophysical data. By anchoring subsurface information into a real-world space, you provide a clearer visual.
That clarity has a practical, two-fold impact. On your end, it improves analysis by showing exactly how anomalies extend between lines and how they relate to surface features like drainage or infrastructure. On the stakeholders’ end, it provides an intuitive picture for informed decision-making.
When terrain, imagery, and multiple profiles come together in one spatial model, you’re no longer presenting isolated slices of information but a cohesive visual. This integrated context is what helps boost analysis and stakeholders’ success.
Want to discover more about why spatial context matters beyond geophysical profiles alone? Download our free guide Why 2D Isn’t Enough: The Cost of Overlooking 3D in Geoscience & Engineering. Inside, you’ll discover how 3D visualization improves both analysis and communication in ways 2D can’t achieve.
Recent Articles
- Jul 1, 2026|Gabbie Rhodes|7 min
Geoscience projects are built on collaboration, but even the strongest teams can struggle with communication silos. Learn how to overcome them.
- Jul 1, 2026|Gabbie Rhodes|7 min
See how 3D visualization transforms geophysical data by connecting profiles with terrain, boreholes, and other datasets for better interpretation.
- Jun 23, 2026|Gabbie Rhodes|10 min
Ever stop and wonder: does AI make mistakes? Before you start using AI tools to create your maps, discover the answer to this key question.
- Jun 23, 2026|Gabbie Rhodes|7 min
What contributions are women making in STEM? Discover eight examples of women in STEM fields and the meaningful impact they’re making.