What Damage Can a Tornado Cause? Visualizing the Answer to Improve Planning & Resilience
Tornadoes vary in path, intensity, and duration. Some carve narrow corridors of extreme destruction while leaving nearby structures largely untouched. Wind speeds fluctuate along the track. Debris disperses unevenly. Damage patterns shift block by block. In other words, tornado impacts are rarely uniform, and that complexity makes them difficult to understand without examining the full spatial picture.
To truly answer the question, what damage can a tornado cause, it’s critical to analyze broader patterns across communities and landscapes. Where does structural damage concentrate? How does debris distribution change across a storm’s path? Which infrastructure systems are most vulnerable? And how can data visualization make the damage clearer and more actionable to improve planning and resilience?
Understanding U.S. Tornado Patterns
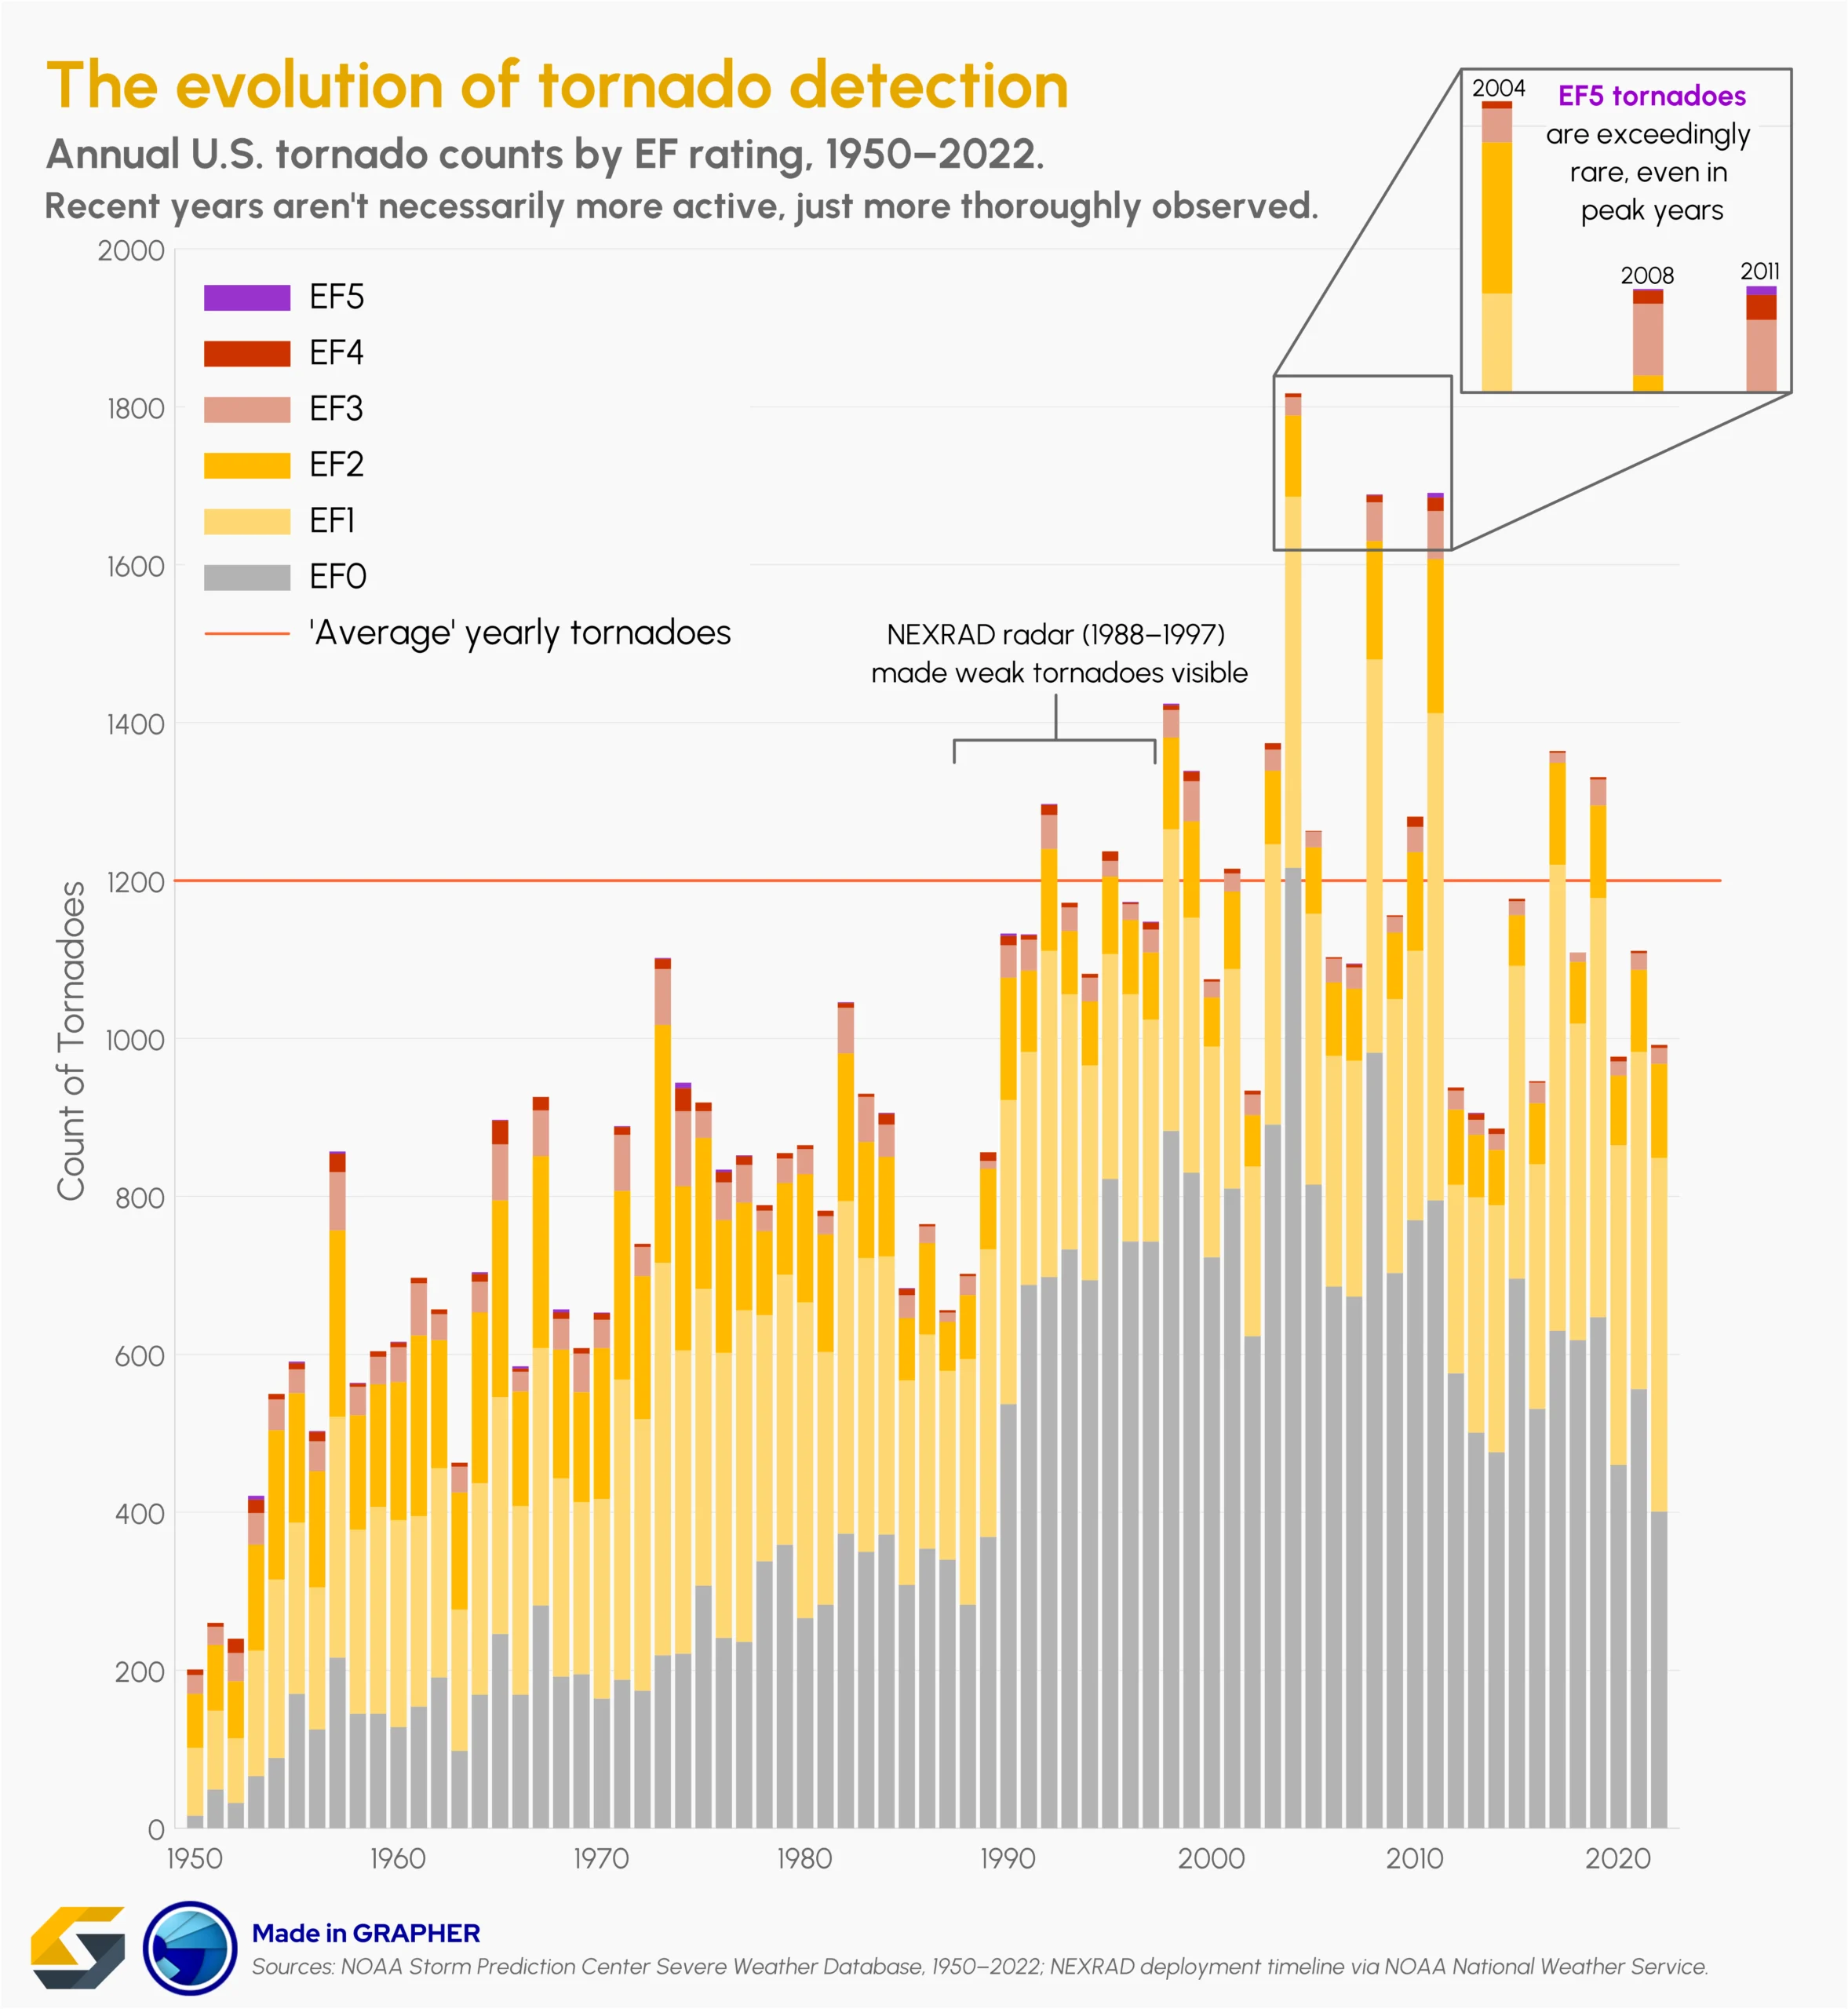
To start examining the broader patterns, we have to ground this discussion in a few key statistics. On average, about 1,200 tornadoes strike the United States each year. That number alone highlights how common these events are in the U.S. While activity tends to peak during what’s often called “tornado season,” that season does not look the same everywhere.
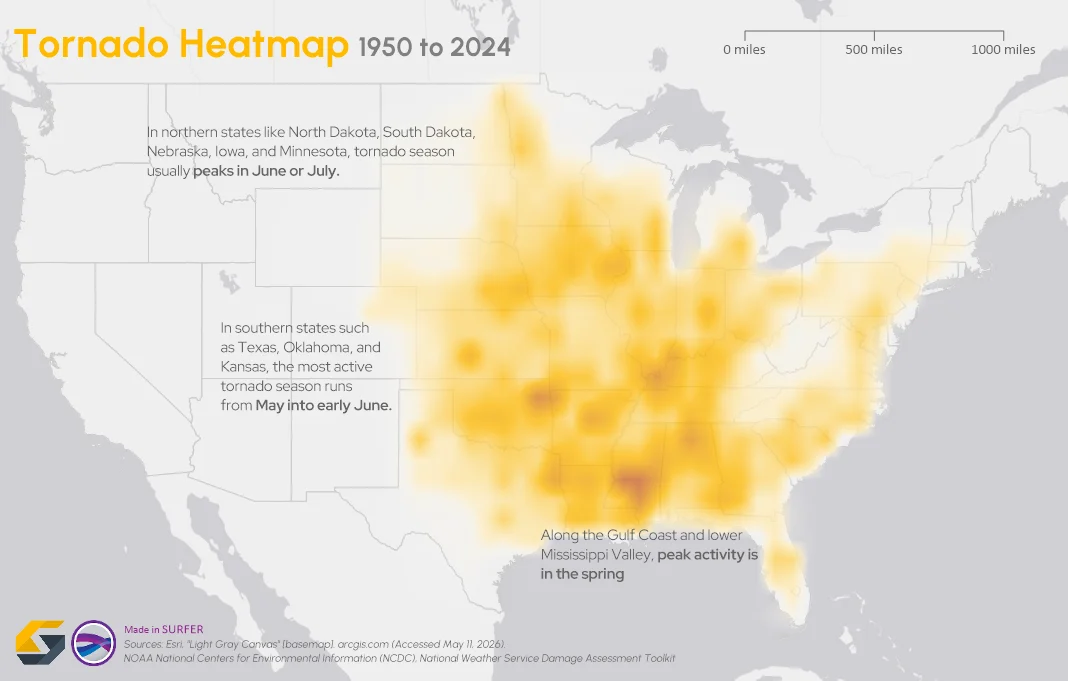
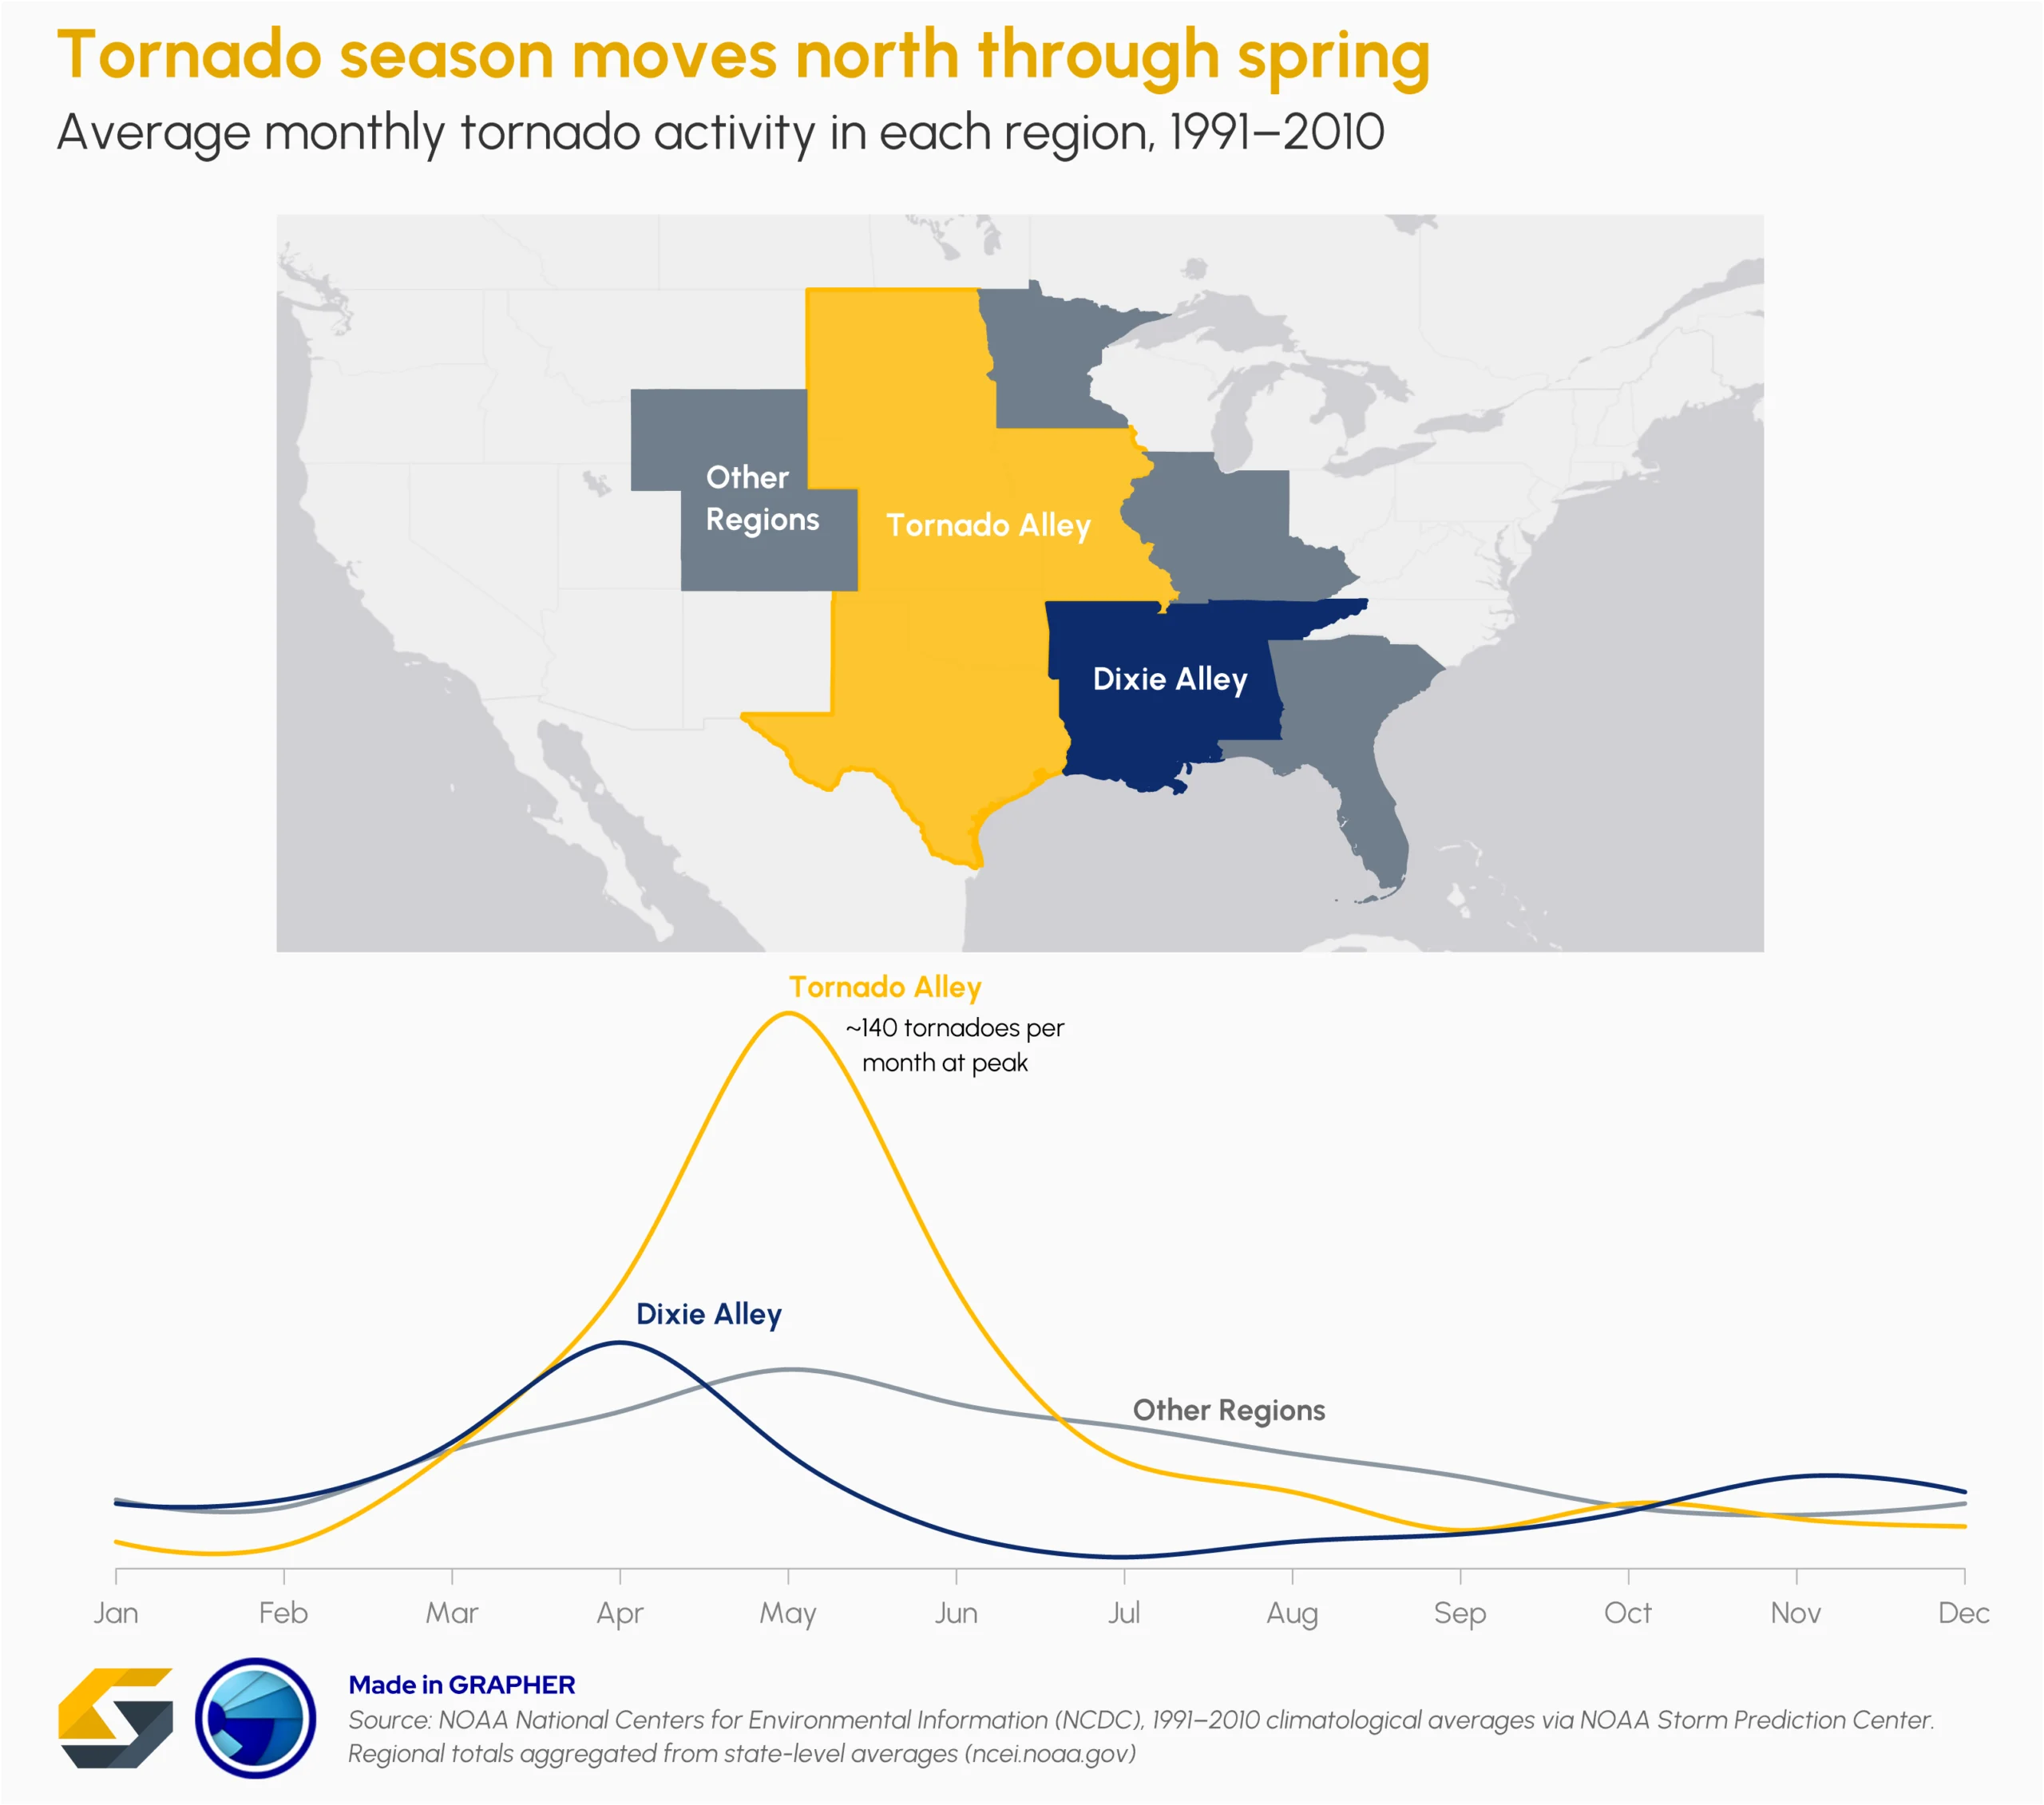
“Tornado season” typically refers to the time of year when activity peaks in a given region. In the southern Plains—such as Texas, Oklahoma, and Kansas—the most active period generally runs from May into early June. Along the Gulf Coast and lower Mississippi Valley, peak activity tends to arrive earlier in the spring. In the northern Plains and upper Midwest, including states like North Dakota, South Dakota, Nebraska, Iowa, and Minnesota, the season usually peaks in June or July.
But these timeframes can be misleading if taken too rigidly. Tornadoes can occur at any time of year. They can also form at day or night, though most tend to develop between 4:00 and 9:00 p.m., when atmospheric conditions are often most favorable for severe storms.
These statistics reveal an important reality: tornadoes are not isolated or rare anomalies. They are recurring, regionally variable storms. And because their timing and intensity shift across geography and season, understanding their broader spatial patterns becomes essential for long-term planning and resilience.
What Damage Can a Tornado Cause? A Breakdown of Impact
Now that we’ve grounded this discussion in national patterns, we can answer the central question directly: what damage can a tornado cause? The short answer is this: far more than some may realize. Tornado damage extends beyond collapsed buildings. It reshapes communities, disrupts infrastructure, and alters landscapes in ways that ripple outward long after the storm has passed. To put that into perspective, below are four primary categories of tornado damage and the impact they leave.
1. Structural Damage
The most visible and immediate impact of a tornado is structural destruction. Homes, commercial buildings, and industrial facilities can all be affected, but the severity is rarely the same.
Structural damage varies based on these interacting factors:
- Construction type and materials: This includes framing systems, anchoring methods, and roof design.
- Wind speed and wind-induced pressure differentials: These two elements combine to create the powerful uplift forces on roofs and lateral loads on walls that often lead to structural failure.
- Debris impact: This factor refers to airborne materials acting as high-velocity projectiles.
Ultimately, structural damage can range from minor roof loss and broken windows to complete structural failure, where buildings are reduced to their foundations. Damage intensity also often fluctuates dramatically across short distances, forming narrow corridors of destruction adjacent to areas of comparatively minor impact.
In extreme cases—such as the 2011 Joplin tornado—hundreds of businesses and residential buildings can suffer catastrophic failure. Entire neighborhoods were flattened, with losses from the built environment nearly reaching $3 billion, demonstrating how wind intensity and debris impact can combine to overwhelm structural systems.
2. Debris Distribution
As winds intensify during a tornado, building materials, vehicles, and vegetation are lifted and transported across significant distances. This creates secondary damage zones that extend well beyond the main path of the tornado. Debris fields commonly include:
- Structural components: This includes lumber, roofing materials, and metal framing that can cause significant secondary damage.
- Vehicles and heavy objects: These can become airborne and are capable of breaching walls, buildings, and infrastructure systems.
- Vegetation and natural materials: These can accumulate in roadways or waterways, creating additional hazards and access challenges.
Historic events like the Tri-State Tornado demonstrated how debris can travel for miles from its origin. During the extreme weather event, the tornado started in Ellington, Missouri, but went through Illinois and Indiana, traveling 219 miles and setting records for distance.
3. Infrastructure Disruption
Tornado damage frequently disrupts the systems that empower communities to function effectively. Roads, bridges, power lines, water systems, and communication networks are all vulnerable to high winds and debris impact. When these systems fail, the consequences extend far beyond the initial path of destruction. Infrastructure breakdown can lead to the following:
- Isolated neighborhoods: Blocked roadways can delay emergency response efforts and restrict access to critical medical care.
- Widespread power outages: These outages can disrupt hospitals, water treatment facilities, and communication systems across entire regions.
- Natural gas leaks and fire risk: Ruptured lines from uprooted trees or shifted foundations create immediate fire hazards, often forcing the suspension of search-and-rescue operations until utilities can be manually shut off.
- Regional grid instability: Damage to substations or transmission corridors can affect areas well beyond the immediate tornado footprint.
The April 2011 tornado outbreak in Alabama serves as a historic benchmark for this type of systemic failure. During this event, nearly half of the state’s power customers were left without electricity as the storm unleashed unprecedented damage on the regional grid. The scale of the disruption required the replacement of over 7,600 poles, 3,000 transformers, and 890 miles of power lines.
4. Environmental Impact
Beyond structures and infrastructure, tornadoes can significantly reshape the natural environment. High winds uproot trees, strip vegetation, and disturb soil layers. In more severe cases, tornadoes can cause this type of impact on the environment:
- Large-scale deforestation: Entire forested areas can be flattened, altering canopy structure and disrupting habitat distribution.
- Soil disruption and ground scouring: Topsoil can be removed or displaced in extreme EF4+ cases, permanently changing land contours and increasing erosion risk.
- Ecosystem shifts: Watershed stability, wildlife habitats, and long-term vegetation recovery can all be affected for years after the storm.
The 2011 Super Outbreak—an event that produced more than 360 tornadoes over three days—illustrated how widespread and persistent environmental impacts can be. Entire forested areas were flattened, and in some locations, ground scouring permanently altered the landscape.
Why Tornado Damage Is Hard to Understand Without Visualization
The challenge with tornado damage isn’t just its severity but also its distribution. Damage varies dramatically across space, and the result is an impact zone with a patchwork of varying intensity. Without visualization, that spatial complexity is difficult to interpret.
Damage reports may list affected structures. Surveys may assign ratings. Insurance data may quantify losses. But when information is presented as isolated points or written summaries, it becomes hard to achieve these objectives for planning and resilience:
- Understand how intensity changes across neighborhoods
- Identify clusters or high-risk corridors
- See where infrastructure disruption overlaps with structural damage
- Communicate the full spatial scope of impact to planners and decision-makers
In practice, this means these critical questions remain harder to answer:
- Where did damage intensify most?
- How did terrain influence impact zones?
- Which systems failed together and where?
Tornado damage is geographically dynamic. And when impact varies block by block, decision-makers need spatial clarity. That clarity comes from seeing patterns in data visualizations.
Turning Visualization Into Better Planning & Resilience
Data visualization can help inform what comes next. When tornado impacts are mapped, modeled, and graphed clearly, patterns emerge. Those patterns become evidence. And evidence becomes the foundation for smarter planning, stronger infrastructure, and faster recovery. In other words, when stakeholders see the patterns of the past clearly, they can build a more resilient future. For example, below are a few specific strategies that data visualization can inform to directly strengthen planning and resilience.
Hardening Infrastructure: Data-Driven Building Codes
The Strategy: Use maps of damage intensity gradients and estimated wind-speed contours to identify where wind forces are most consistently extreme.
The Impact: Instead of relying on uniform, one-size-fits-all building standards, cities can justify higher structural requirements in high-probability strike zones. Since the Enhanced Fujita (EF) scale is a forensic tool used to estimate wind speeds based on observed damage after an event, visualizing these historical intensity gradients provides the evidence needed to support reinforced roofing systems, impact-resistant materials, and properly engineered safe rooms.
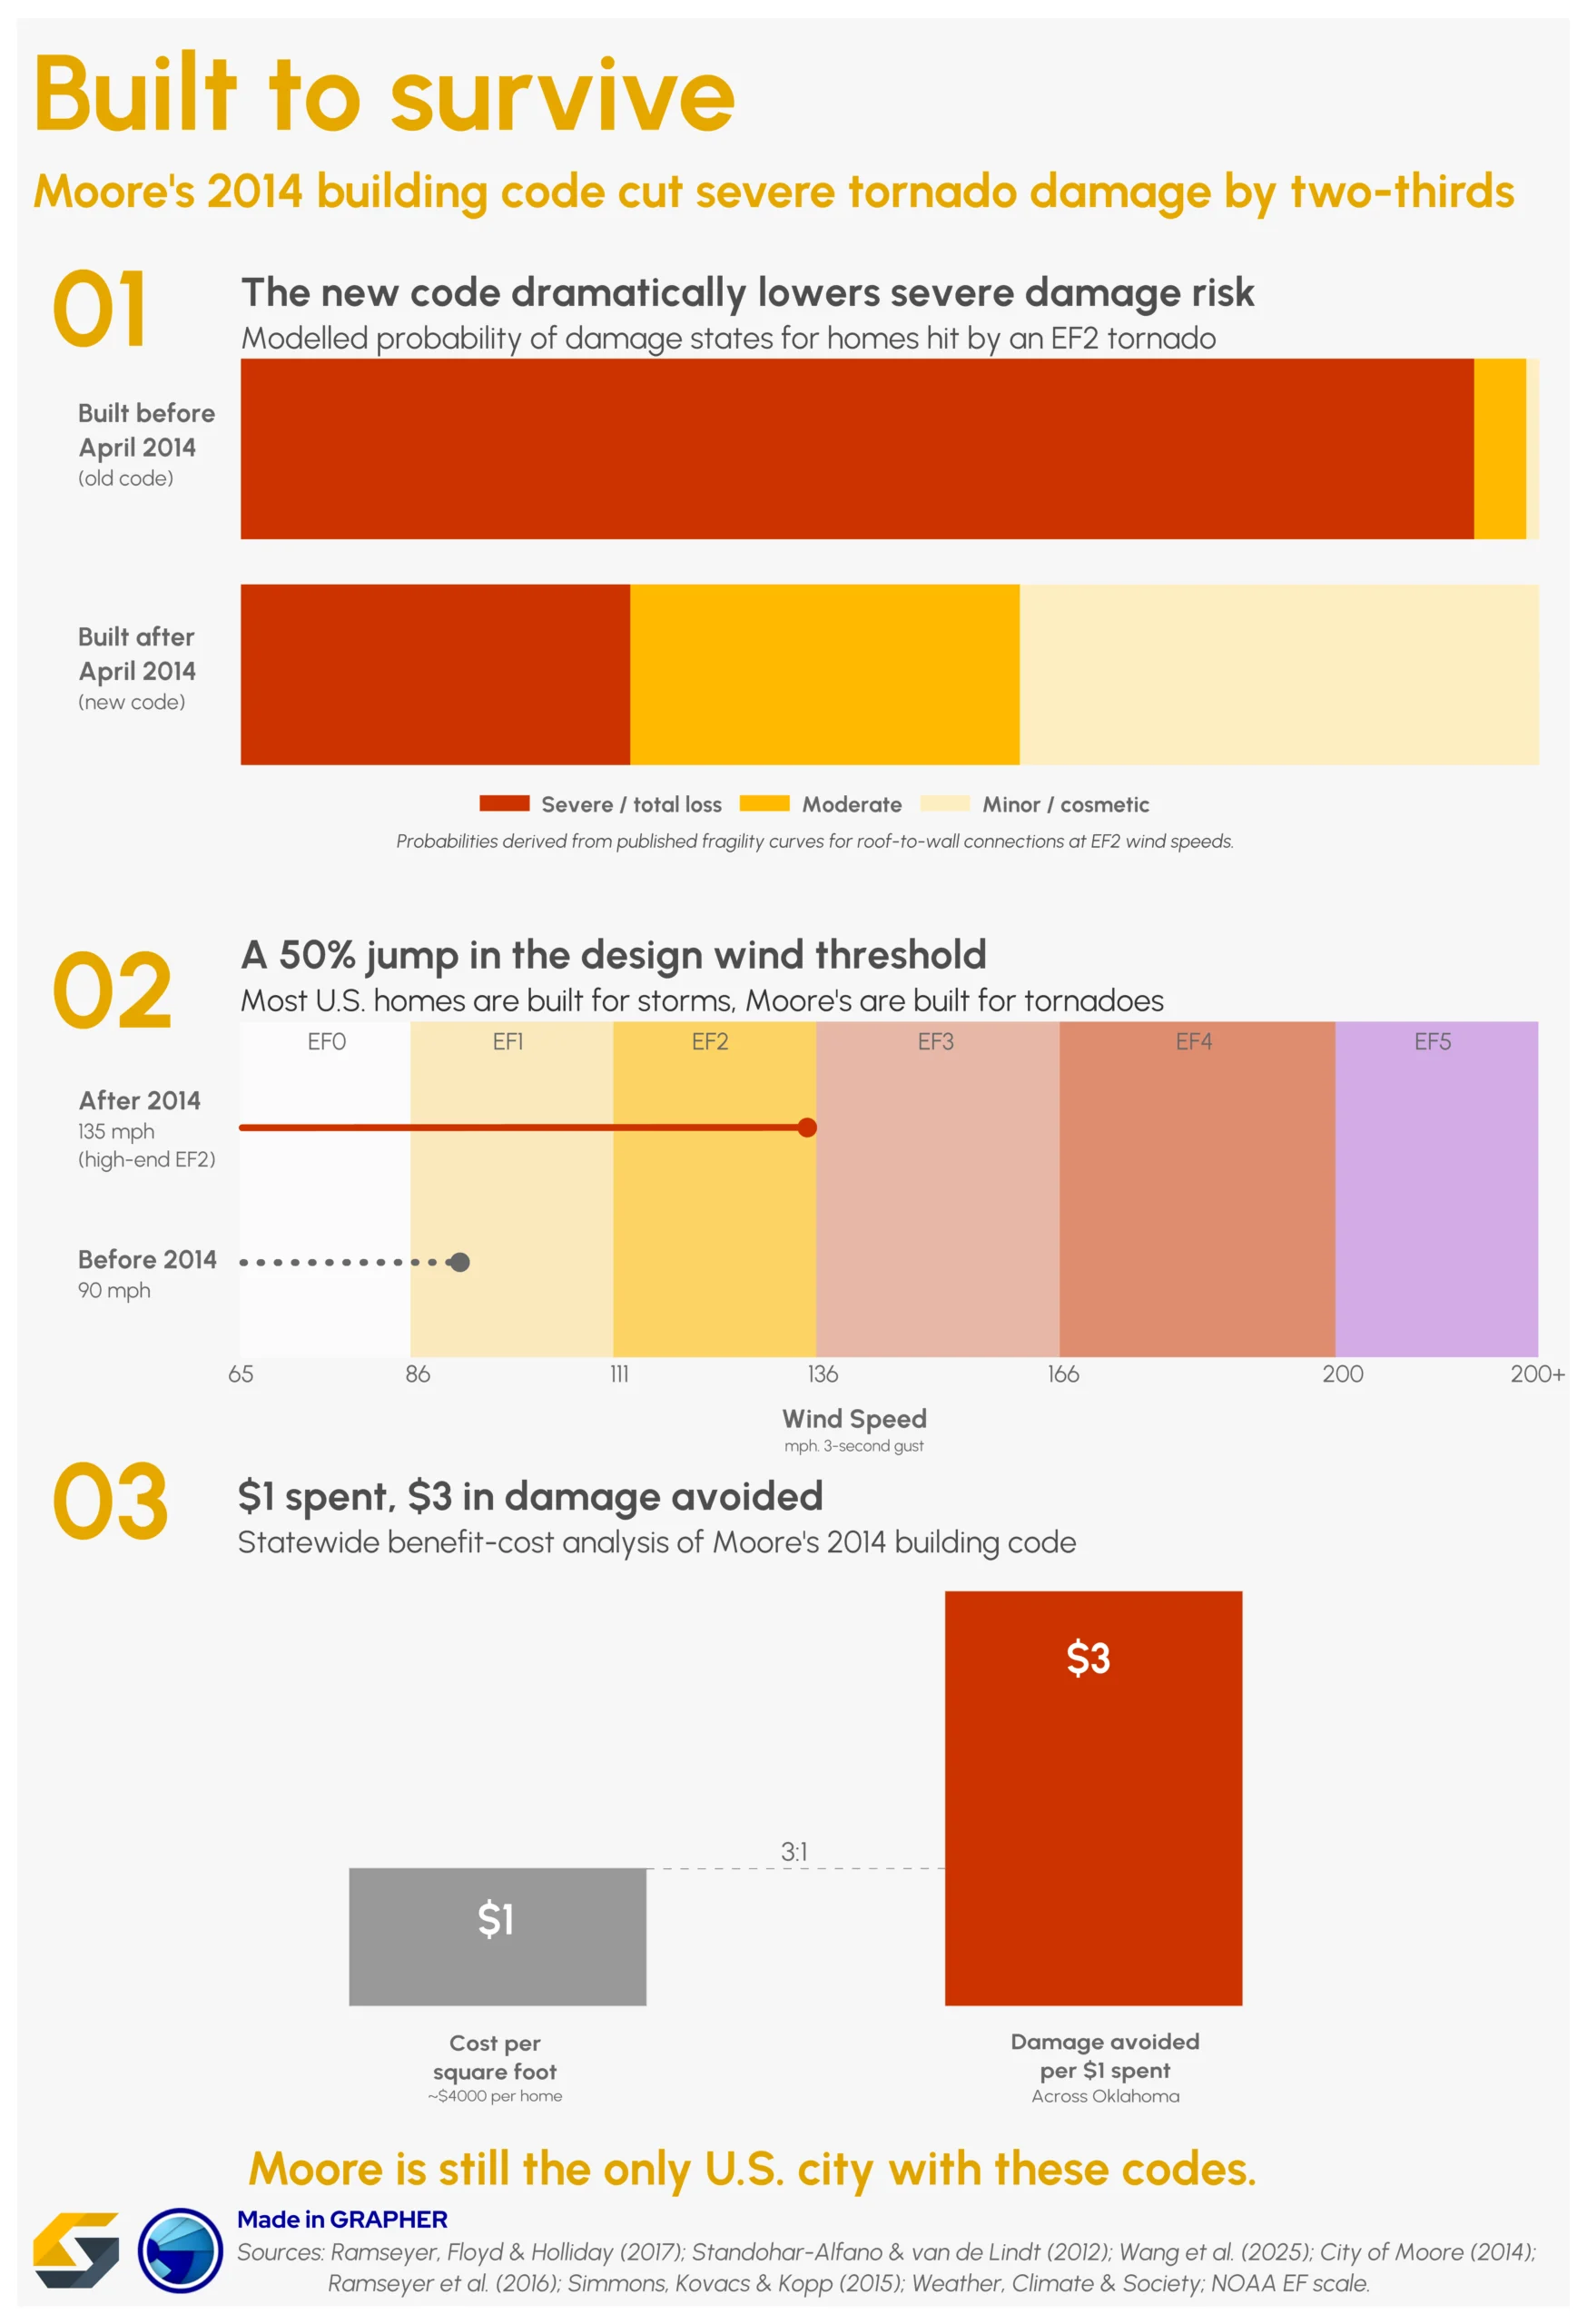
While many small towns across tornado-prone regions still rely on outdated infrastructure and older building codes, cities like Joplin, Missouri, and Moore, Oklahoma, serve as blueprints for modern resilience. Here are some steps these cities have taken:
- Joplin, MO: After the 2011 EF5 tornado devastated the city—including the direct hit to St. John’s Regional Medical Center—the community prioritized building back better. The hospital, for example, hardened its infrastructure by adding a concrete roof, a window system designed to withstand 250 mph winds, and safe zones on every floor.
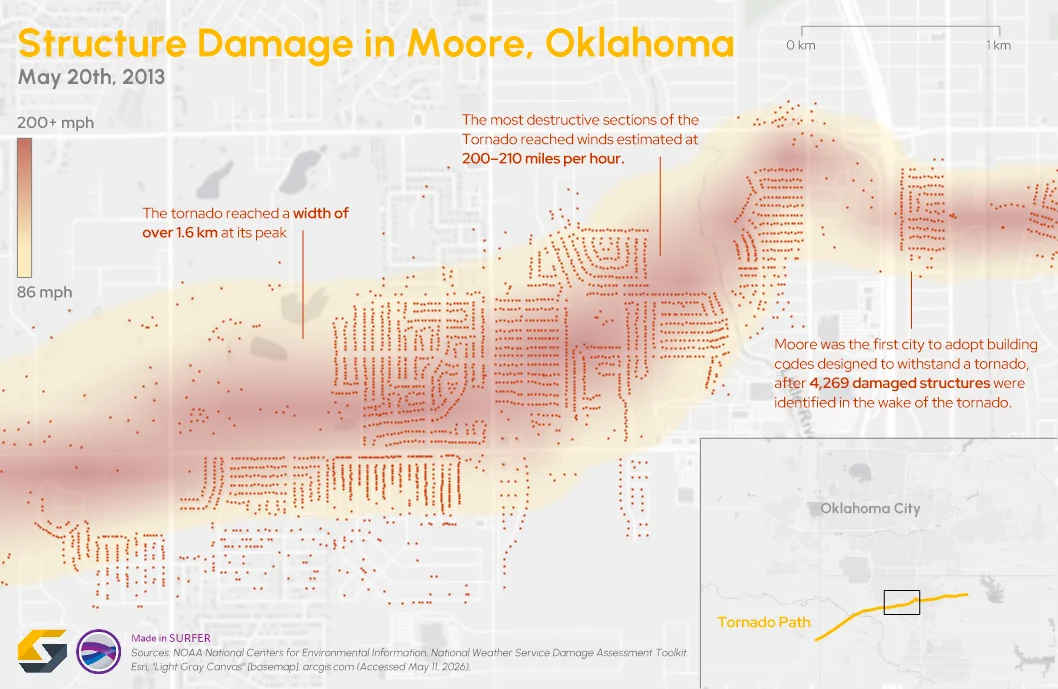
- Moore, OK: Soon after Moore was hit by a 2013 tornado that became its third most powerful storm, the city was the first in the U.S. to adopt building codes specifically designed to withstand a tornado. Some of the new building codes include using plywood or OSB on gable end walls and continuous wood structural panel sheathing on all exterior walls.
By bridging the gap between data and municipal policy, these cities demonstrate that while we cannot stop a tornado, we can use spatial evidence to ensure that infrastructure is built as effectively as possible.
Precision Emergency Response: Proactive Access Mapping
The Strategy: Use real-time path mapping and infrastructure overlays to identify potential access bottlenecks before they become life-threatening barriers.
The Impact: By simulating tornado paths across city maps, emergency managers can visualize which hospitals, fire stations, or major roadways are most vulnerable to debris blockage. Resources—including heavy equipment, ambulances, and chainsaws—can be pre-positioned in areas likely to be isolated.
Visualization helps direct responders where they are needed most before full ground assessments are complete. By bridging the gap between the storm passing and the start of rescue operations, spatial data ensures that life-saving efforts are not delayed by unforeseen logistical failures or blocked transit corridors.
Utility Resilience: Protecting the Grid
The Strategy: Overlay power grid infrastructure with historical tornado frequency maps and debris corridors.
The Impact: Utility providers can identify high-risk intersections between transmission lines and recurring storm paths. This insight can inform decisions about where to bury lines underground, install break-away poles, or reinforce substations.
By visualizing where storm paths and grid vulnerabilities overlap, communities can reduce the risk of cascading outages—like those that happened during major tornado events such as the April 2011 tornado outbreak in Alabama.
Financial & Insurance Accuracy: Managing Risk
The Strategy: Use spatial analysis to estimate Probable Maximum Loss (PML) based on historical footprints and intensity distributions.
The Impact: When insurers can see the true geographic distribution of past damage, they can set fairer premiums, allocate reserves more accurately, and ensure faster claim payouts after a strike. While less visible than rescue operations, this financial clarity supports long-term recovery. Accurate visualization strengthens a community’s economic backbone, helping it rebuild with confidence rather than uncertainty.
Public Communication: The Power of the Picture
The Strategy: Translate complex GIS datasets into intuitive, color-coded risk maps for public use.
The Impact: A spreadsheet listing 150 mph wind speeds may be technically precise, but it’s very abstract. A clearly labeled “High-Risk Zone” map is actionable. It tells homeowners whether they should invest in reinforced roofing, a storm shelter, or a preparedness plan.
Vulnerability Mapping: Identifying High-Risk Residential Clusters
The Strategy: Overlay socioeconomic and housing data—specifically mobile home parks and high-density RV communities—with the locations of community storm shelters and historical “short-warning” corridors.
The Impact: Not every structure provides equal protection; while an EF2 tornado may cause roof damage to a brick-and-mortar home, it can completely level a mobile home community. By visualizing the travel time between these vulnerable residential zones and the nearest community shelter, planners can identify neighborhoods where a safe shelter is too far away to reach in time.
In some cases, residents have about 15-20 minutes of warning, and in some “pop-up” supercell events, no warning at all. Data visualization empowers emergency managers to justify the placement of new community shelters specifically within these high-vulnerability zones, ensuring that the most at-risk citizens have a survival option that is reachable within a two-to-three-minute sprint.
Avoiding Analytical Bias in Tornado Risk Assessment
While data visualization is a powerful tool for planning and resilience, its impact decreases significantly when rigorous spatial analysis isn’t applied to the data. If tornado damage is analyzed through generalized assumptions rather than spatial patterns, the consequences influence everything from capital investment to long-term policy. Below are the most consequential analytical pitfalls that can quietly undermine resilience planning.
The Uniformity Trap: Miscalculating Wind Load
One of the most significant errors is treating a tornado’s path as a consistent band of destruction. In reality, wind intensity is a spatial gradient influenced by shifting rotational speeds, terrain-altered airflow, and debris concentration.
When this variability is overlooked, planning decisions become distorted. Municipalities may adopt blanket building code upgrades across an entire corridor, driving up construction costs in lower-risk areas while still under-protecting localized high-intensity zones. From a forensic engineering standpoint, averages obscure risk; if one structure fails and its neighbor survives, assuming uniform intensity can lead to blaming construction quality when the true driver was localized wind amplification.
Point-Data Fragmentation: The Need for Spatial Aggregation
Damage reports, insurance claims, and ground surveys provide essential data, but they are inherently point-based fragments. Relying primarily on isolated observations prevents decision-makers from seeing the broader systems at play.
Without spatial aggregation, emergency funding and recovery resources may be concentrated on high-profile damage sites rather than underlying intensity clusters. Spatial analysis is required to reveal whether structural collapse aligns with peak wind gradients or terrain acceleration zones. Without this context, post-event conclusions risk oversimplification, and oversimplified conclusions shape flawed resilience strategies.
Systemic Blind Spots: Neglecting Secondary Impact Zones
The visible destruction corridor often commands the most attention, but secondary impact zones frequently drive the longest-term consequences. Debris fallout, infrastructure disruption, and environmental contamination can extend miles beyond the central track.
If these extended impacts are not mapped and analyzed, mitigation strategies might under-address cascading system vulnerabilities. These secondary effects can include:
- Industrial Dispersal: Contaminants from industrial sites may travel far beyond the core path.
- Grid Propagation: Power grid failures can propagate regionally from localized substation damage.
- Logistical Bottlenecks: Transportation routes may be blocked outside the highest wind-intensity zones, delaying the initial critical window of emergency response.
Ignoring these zones compresses risk into a narrow corridor and underestimates a community’s true systemic exposure.
The Communication Gap: Translating Complexity into Action
Even the most rigorous technical datasets lose their value if they aren’t translated into accessible formats for multi-stakeholder alignment. If EF-scale gradients and infrastructure overlap zones are presented as abstract spreadsheets, stakeholders may default to generalized assumptions.
Clarity is a strategic requirement. When geoscientists and engineers use intuitive, color-coded risk maps, they provide the evidence needed to justify differentiated building standards and targeted investments.
From Destruction to Design: Building Resilience With Better Insight
While a tornado’s destruction may look chaotic, it follows gradients of intensity, debris distribution, and system-level disruption that vary across space. Understanding those patterns is the difference between reacting to damage and planning for it.
Data visualization turns patterns into actionable insight. When tornado paths, intensity zones, and infrastructure overlays are illustrated clearly, risk becomes measurable. Engineers can use spatial evidence to justify more resilient building codes and infrastructure standards. Emergency managers can anticipate bottlenecks. Utilities can protect vulnerable grid intersections. Planners can align policy with evidence rather than averages.
Resilience is built before the next storm forms. When stakeholders see how tornado damage actually distributes across a landscape, they can design stronger systems, smarter codes, and clearer communication strategies.
We want to hear from you: Because tornado resilience looks different for everyone—from hardening a hospital’s infrastructure to identifying the quickest path to a neighborhood shelter—what’s one takeaway from this article that you found most valuable? Join the conversation below and share your thoughts on how we can all better prepare for tornadoes.
Recent Articles
- Jul 1, 2026|Gabbie Rhodes|7 min
Geoscience projects are built on collaboration, but even the strongest teams can struggle with communication silos. Learn how to overcome them.
- Jul 1, 2026|Gabbie Rhodes|7 min
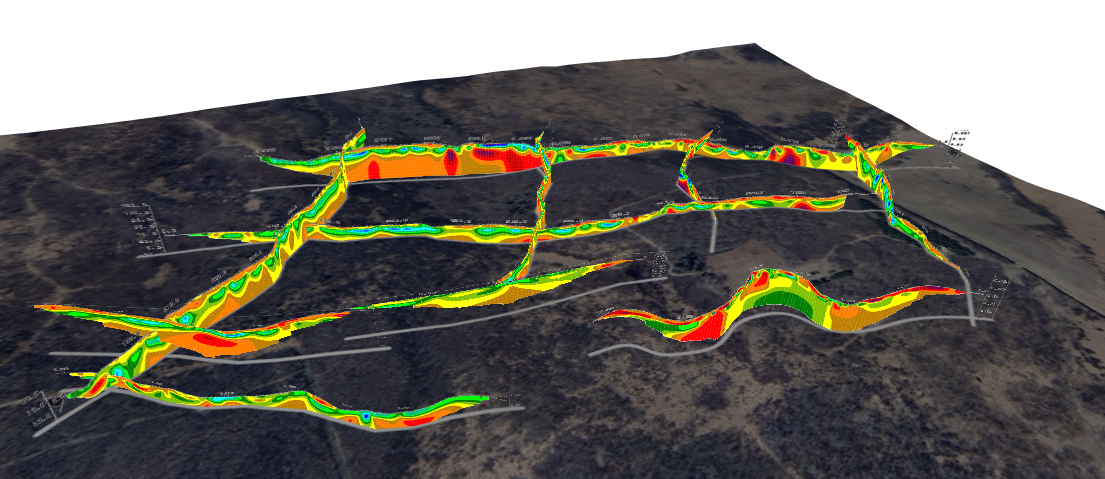
See how 3D visualization transforms geophysical data by connecting profiles with terrain, boreholes, and other datasets for better interpretation.
- Jun 23, 2026|Gabbie Rhodes|10 min
Ever stop and wonder: does AI make mistakes? Before you start using AI tools to create your maps, discover the answer to this key question.
- Jun 23, 2026|Gabbie Rhodes|7 min
What contributions are women making in STEM? Discover eight examples of women in STEM fields and the meaningful impact they’re making.