Mapping Harbor Depths: How Integrated Visualization Supported Smarter Dredging


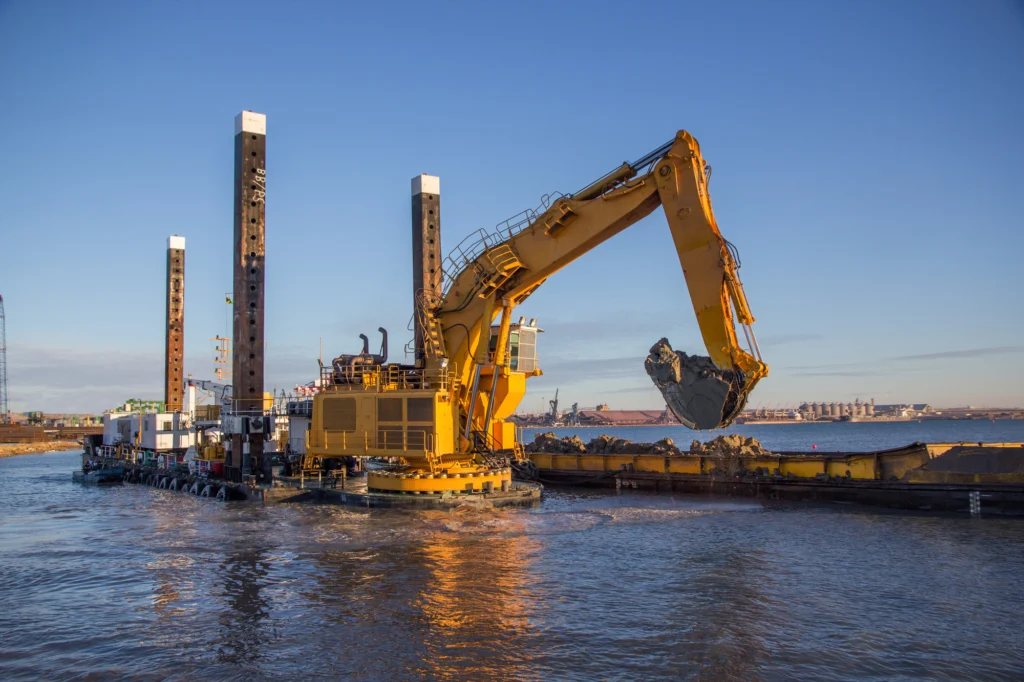
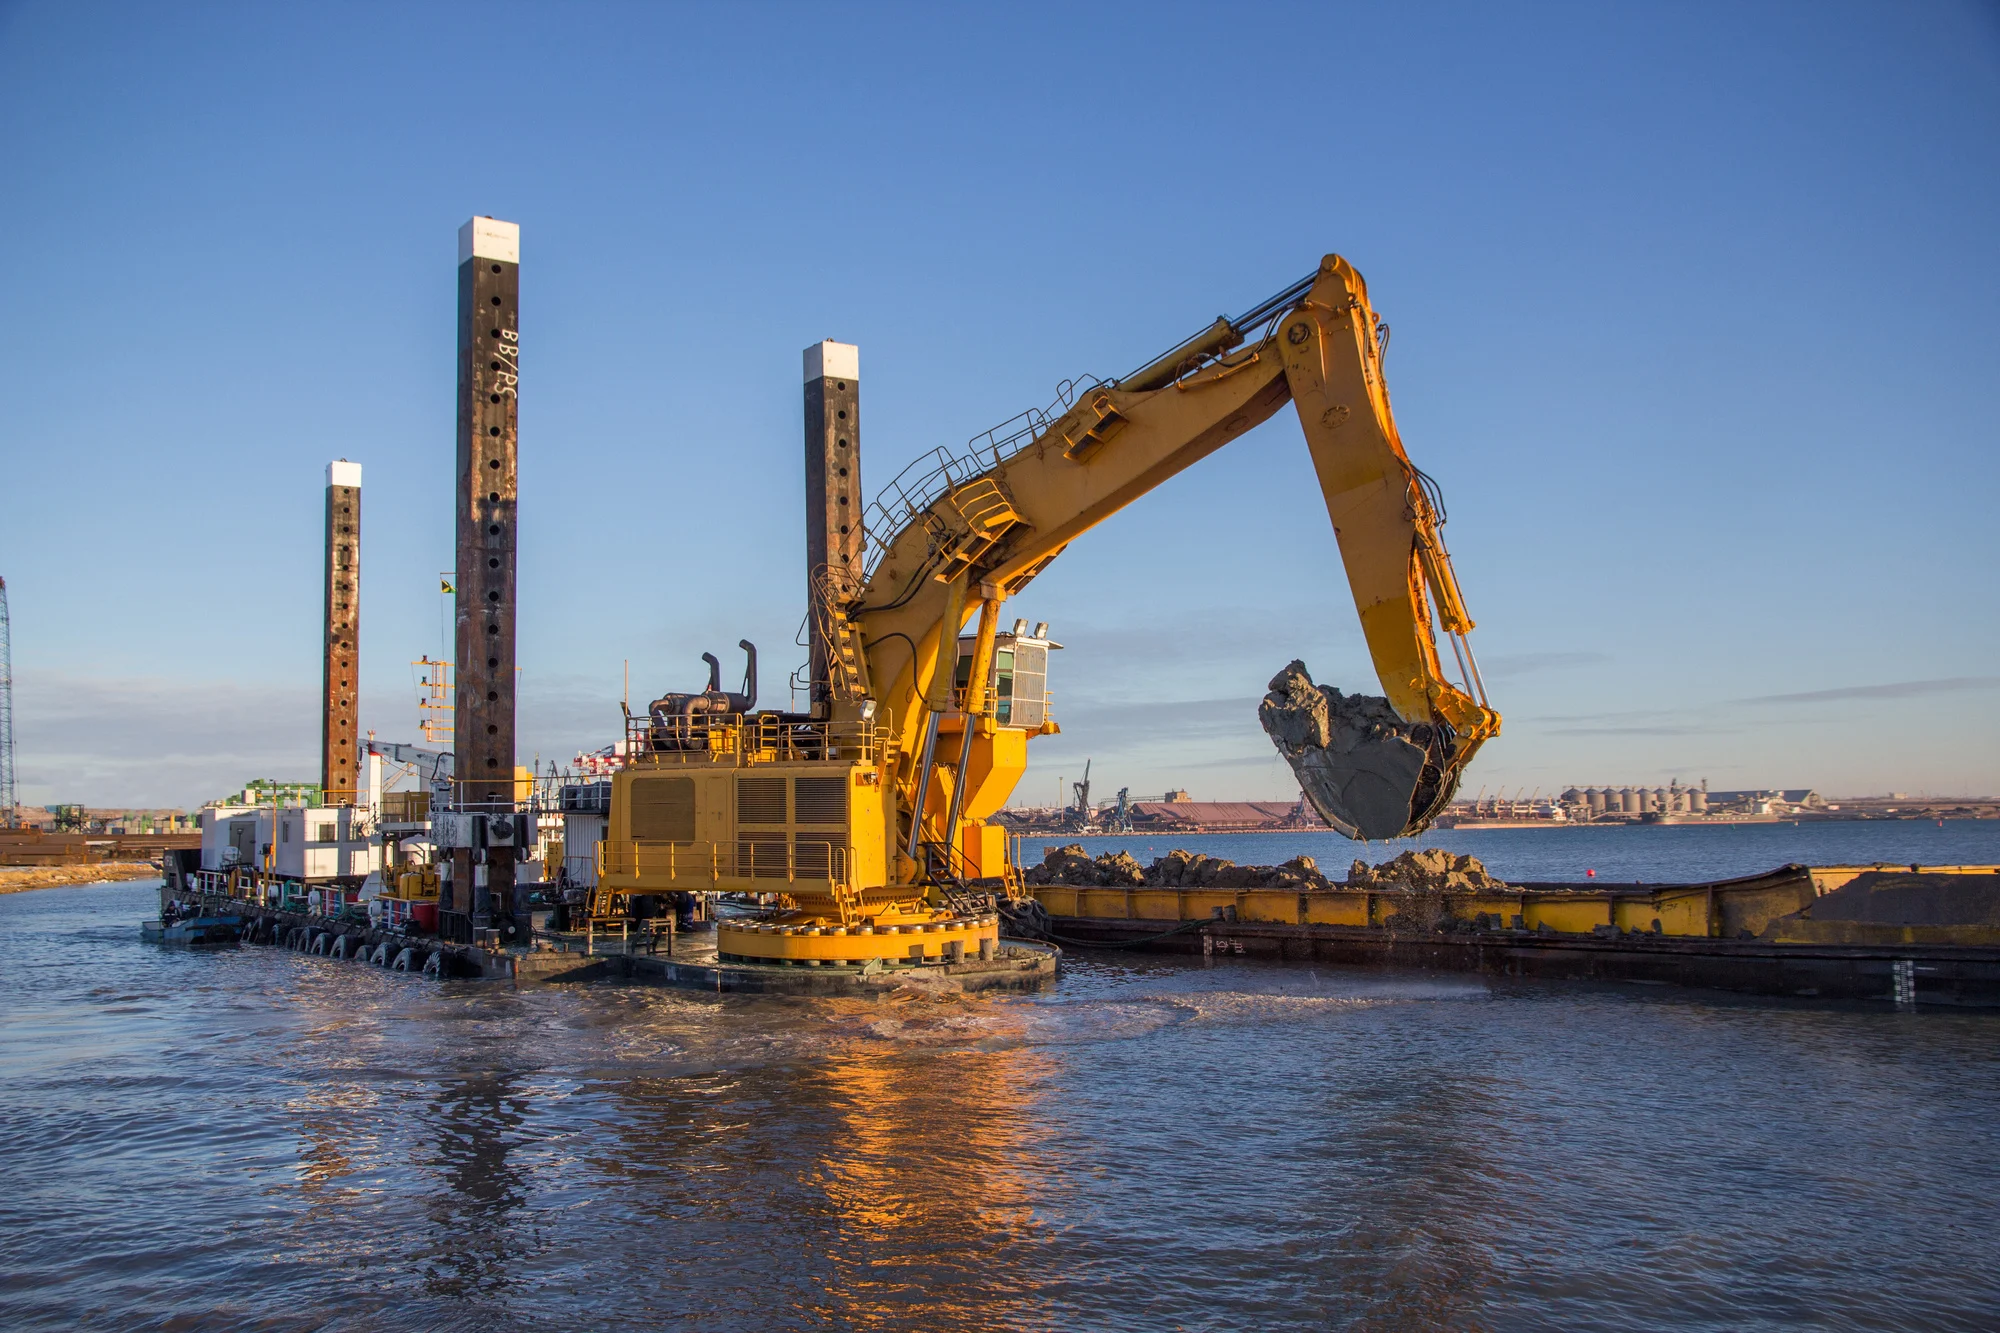
Expanding a harbor to accommodate larger ships sounds straightforward until the dredging equipment encounters solid granite beneath the seafloor. While loose sediments like sand, silt, and clay can be excavated relatively easily, unexpectedly striking hard bedrock can quickly slow a project, increase equipment wear, and drive up costs. Before any dredging begins, engineers must know not only how deep the harbor is but also what lies beneath it.
Those were the two questions facing a Norwegian city that wanted to deepen an aging harbor so larger vessels could safely dock. To answer them, Alexey Shulgin, Chief Geophysicist at Norway’s Submara Survey, combined drone photogrammetry, high-resolution bathymetry, and sub-bottom seismic profiling to build a comprehensive look of the harbor from the shoreline all the way down to the underlying bedrock.
But how did he transform several independent datasets into cohesive visualizations that engineers could confidently use to guide a major dredging project? Let’s walk through Alexey’s workflow from data collection to final deliverable.
Why an Integrated Site Investigation Was Essential
First, it’s worth taking a step back to understand why this project required more than a single survey method. The main reason is that no single dataset could answer the client’s central question: where can they safely and efficiently deepen the harbor?
For example, high-resolution bathymetry could provide a detailed picture of the seafloor, making it invaluable for understanding harbor depths and underwater topography. But it couldn’t reveal what lies beneath the seabed. On the other hand, boreholes could provide highly accurate information about subsurface conditions, but only at the exact locations where they’re drilled. Conditions between boreholes would largely remain an educated guess.
That’s why Alexey combined multiple datasets rather than relying on a single source of information. By integrating a drone-derived surface model, high-resolution bathymetry, and sub-bottom seismic data, he could create a complete picture of the site so engineers could calculate excavation volumes with greater confidence, select equipment better suited to the site’s conditions, and reduce the risk of unexpected bedrock slowing or complicating dredging operations.
Collecting Data From Sky to Seabed
With the value of an integrated site investigation understood, Alexey’s first step was collecting the data needed to build a complete picture of the harbor. He gathered information above the water, across the seafloor, and beneath it to ensure engineers understood not only the harbor’s current shape but also what lay below the surface. Here’s a deeper look at his data collection method.
Surveying the shoreline from above
Alexey flew a drone over the harbor, capturing more than 500 aerial photographs that were later processed using photogrammetry to create both a high-resolution orthophoto mosaic and a Digital Terrain Model (DTM) of the shoreline and nearby port facilities.
“Dedicated software blended the 500 drone photos together, handled processing and geo-referencing, and outputted an ortho-photo mosaic and a DTM grid file,” Alexey explained.
These datasets provided the onshore context that would later be combined with the marine surveys.
Mapping the harbor floor
Alexey also conducted a high-resolution bathymetric survey to accurately map the depth and shape of the harbor floor. This established the underwater topography, giving engineers a detailed picture of the seabed before looking deeper into what lay beneath it.
Looking below the seabed
To complete the entire picture, Alexey collected sub-bottom seismic profiles across the harbor. Unlike bathymetry, which maps the seafloor itself, seismic profiling would reveal the geological layers below it. For this project, the seismic data would help distinguish loose sediments from the underlying granite bedrock, information that’d become critical during the interpretation and visualization stages.
Visualizing the Harbor in Surfer: From Individual Datasets to One Complete Picture
After collecting the necessary data, the real value came from bringing those datasets together into visualizations that engineers could quickly interpret and use for decision-making. To complete this step, Alexey processed the drone imagery, bathymetry, and seismic data in their respective software. From there, he imported the outputs into Surfer, where he combined them through visualization and spatial grid calculations. Here’s how those individual datasets came together to tell the complete geological story of the harbor.
Overlay the onshore DTM and bathymetry
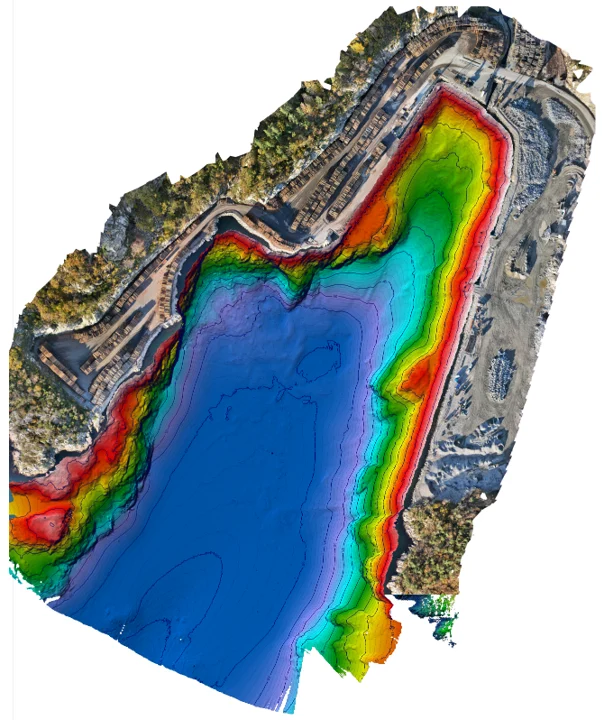
The first visual established the project area by combining the drone-derived orthophoto mosaic with the high-resolution bathymetry. By layering bathymetric color relief with elevation contours directly adjacent to the aerial shoreline imagery, Alexey created a seamless transition from the onshore port facilities down into the deepest parts of the harbor basin. This provided the essential geographic context before introducing subsurface data.
Add the seismic survey lines
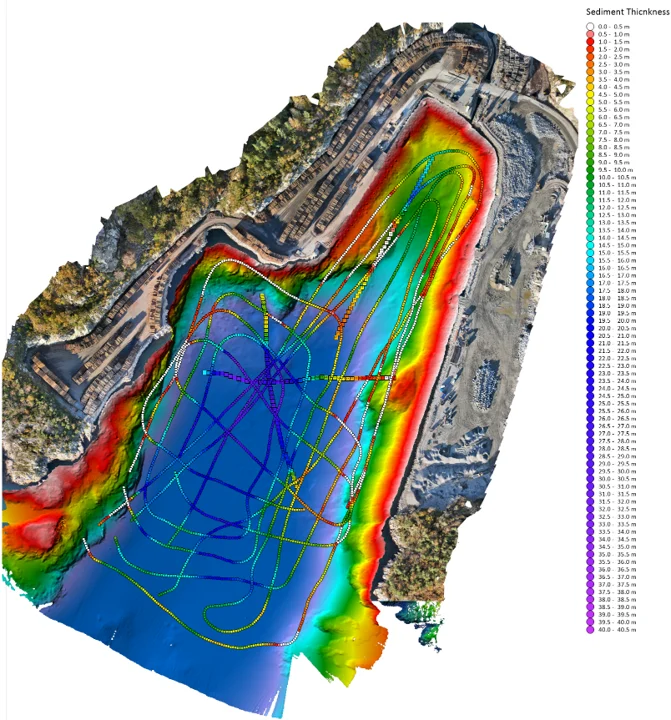
The second visual brought in the seismic profile data, overlaying the raw survey track lines directly onto the preliminary sediment thickness grid. Displaying the individual data points along Alexey’s boat tracks over the interpolated surface would equip geotechnical engineers to evaluate survey coverage, verify data density across critical zones, and validate the model’s accuracy before finalizing the excavation plan.
Visualizing sediment thickness
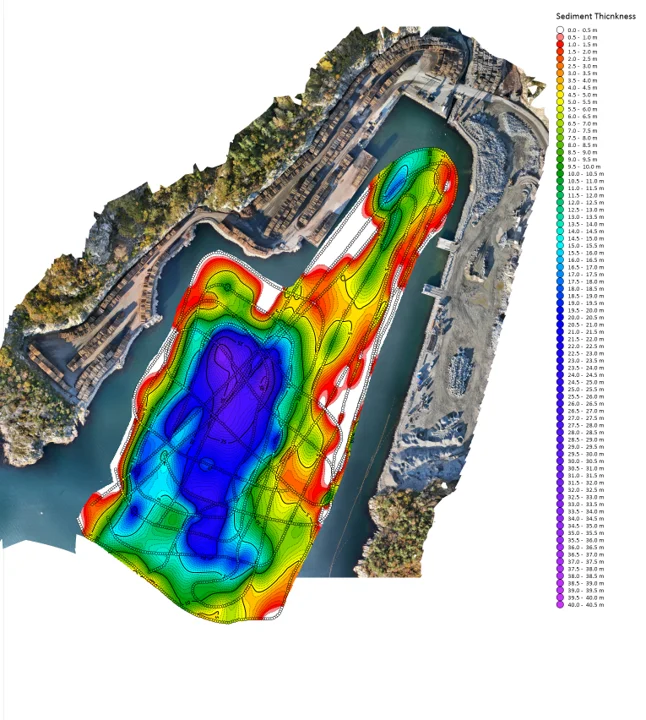
For the third visual, Alexey isolated the sediment thickness heat map to clearly illustrate the depth of soft overburden across the harbor floor. Near the shoreline (mainly in bright red), only about half a meter of soft sediment covered the underlying bedrock, a clear indicator that dredging equipment would hit hard granite almost immediately. Toward the center of the basin (mainly in deep blue and purple), the sediment layer expanded to 40 or 50 meters thick, pinpointing where dredging could proceed deep into soft material without encountering obstruction.
Modeling absolute bedrock depth
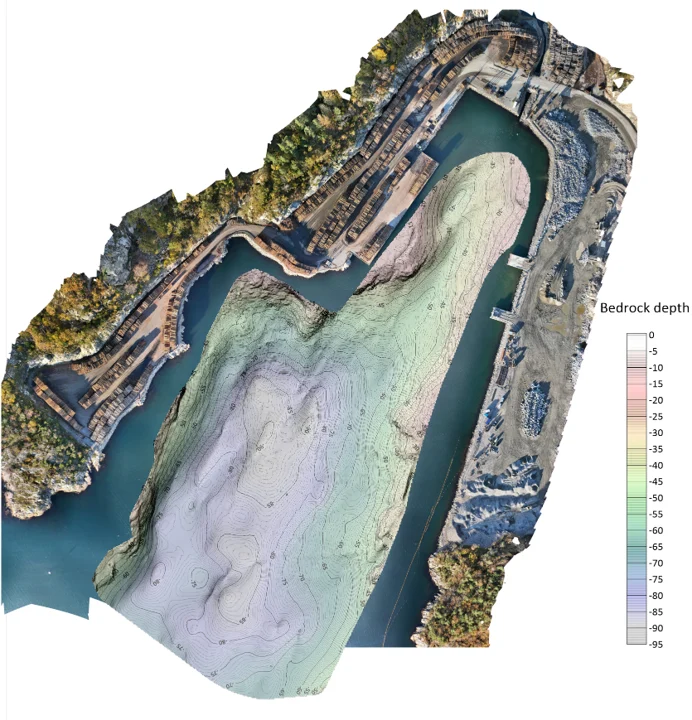
To map the bedrock surface itself, Alexey used grid math to subtract the sediment thickness grid from the bathymetry (seabed elevation) grid. The resulting map established the absolute elevation of the granite bedrock across the entire project area.
“From our seismic lines, I calculated point measurements of sediment thickness and created an interpolated grid,” Alexey explained. “The final outcome shows the absolute elevation of the hard rock in the harbor.”
The Value of Visual Storytelling in Engineering Reports
By the end of his workflow, Alexey had produced a collection of visuals that helped engineers understand the harbor so they could have a successful dredging project. As he explained: “All these images are included in the final report. Geotechnical engineers often focus primarily on the final grid files to import into AutoCAD for dredge calculations, but we show them these visualizations during our project wrap-up meetings on Zoom or Teams. Feedback is usually very positive.”
That distinction highlights an important aspect of engineering communication. The grid files provide the technical information needed for calculations, but visuals deliver insight on what those calculations mean without having to interpret the underlying data. For Alexey, that’s exactly what good visualization should accomplish.
“My approach is that all final images should be eye-catching,” he said. “Reports can be 50 to 100 pages long, and people usually skim through looking for nice pictures. A good illustration tells more than five pages of text. Coming from academia, I believe visuals should be crystal clear so you can understand the entire story just from the pictures.”
Recent Articles
- Nov 4, 2026|Gabbie Rhodes|6 min
Discover how Alexey Shulgin, Chief Geophysicist at Submara Survey, used various visuals to inform a Norwegian city's dredging project.
- Oct 28, 2026|Gabbie Rhodes|8 min
For our 2026 All Hands Meeting, our team gathered in Colorado for a few days of workshops, customer conversations, and fun activities.
- Oct 21, 2026|Gabbie Rhodes|7 min
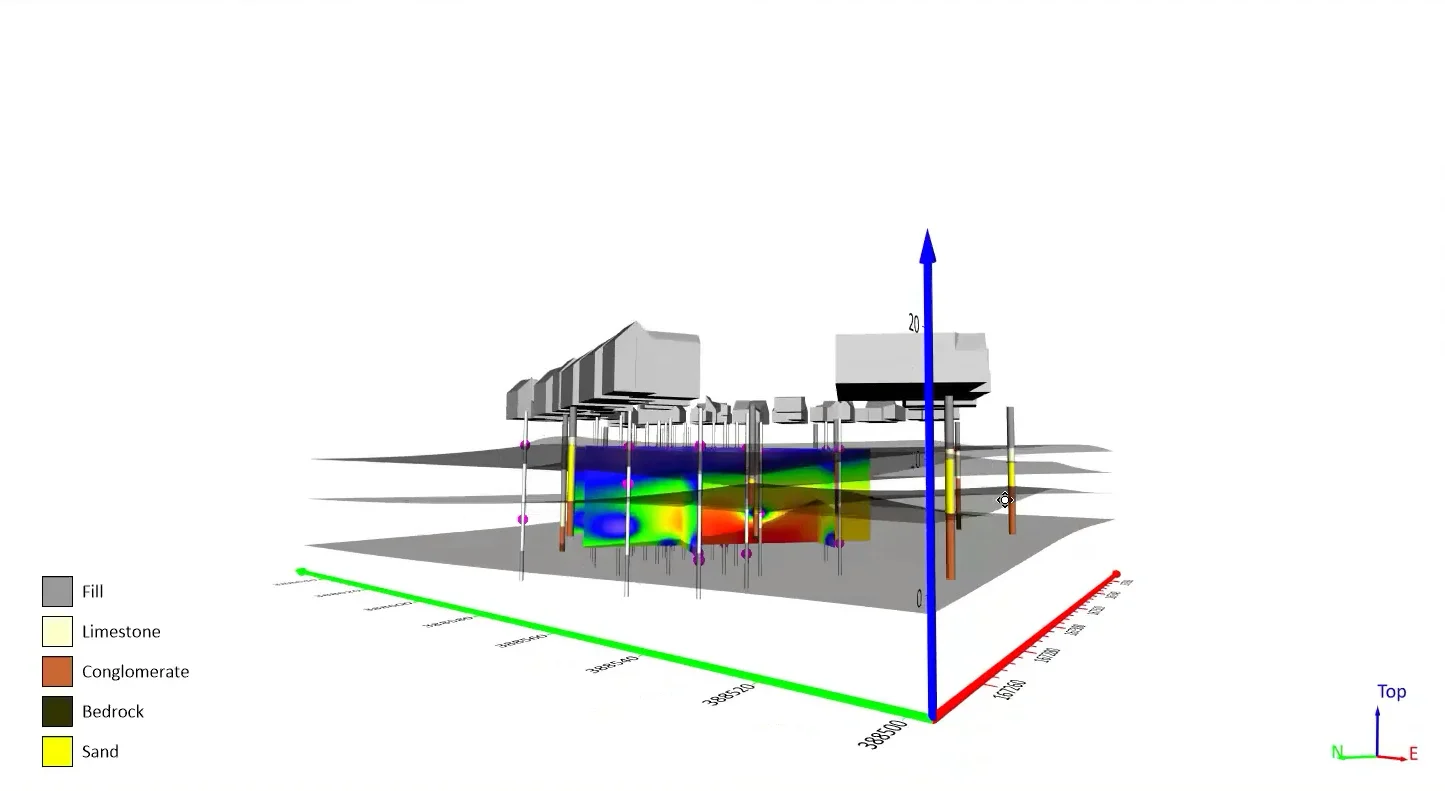
Want your subsurface data to tell a clear story to stakeholders? Learn how to visualize it in 2D and 3D so your data clearly shares key insights.
- Oct 21, 2026|Gabbie Rhodes|10 min
With climate change data, you need to visualize where temperature, precipitation, and other variables occur and change over time. Learn how.