Visualizing the Seafloor: How Submara Survey Uses Advanced Bathymetry to Steer Coastal Development


Coastal infrastructure projects—from port expansions and harbor dredging to underwater blasting—carry massive financial and environmental risks when the seafloor’s geography and geology remain a mystery.
A single unmapped ledge, undetected sediment layer, or miscalculated depth profile can lead to significant budget overruns, damaged equipment, or costly project delays. Collecting sonar and seismic data is essential to avoiding these unfortunate scenarios, but gathering raw numbers is only half the battle. The real impact lies in transforming complex geophysics into clear, intuitive visual stories that non-technical clients, engineers, and project managers can immediately act on.
That’s precisely where Alexey Shulgin, Chief Geophysicist at Norway’s Submara Survey, steps onto the scene. Backed by decades of experience in the field, Shulgin tackled this challenge head-on by merging two distinct spatial perspectives into a single visual masterpiece.
Mapping the Fjord: Bridging Land and Sea
To make way for a new industrial facility, a coastal development team targeted a rugged fjord along the Norwegian coastline. However, before any heavy work could begin, developers needed precise geotechnical and spatial insight.
“They were planning to do some blasting around the peninsula and islands to create an artificial infill for an industrial facility, like a port or warehouses,” Shulgin explained. “They needed to know the thickness of loose sediments and the depth to bedrock so they could estimate explosives, demolition, and material movement.”
Dropping thousands of tons of blasted rock into a Norwegian fjord without knowing what lies beneath is a recipe for disaster. To keep the project safe and on budget, Submara Survey needed to answer two critical questions:
- Surface Geometry & Depth: What does the underwater landscape look like—where are the shallow, flat areas suitable for filling versus the deep basins that will require significantly more infill volume?
- Slope & Stability Hazards: How steep are the underwater slopes, and are there near-vertical cliff faces or unstable gradients where dropped material will slide into deep water?
To deliver these answers, Submara Survey needed to seamlessly bridge the gap between terrestrial elevation data and underwater bathymetry through visuals that provided a clear, cohesive view.
From Raw Data to Actionable Insights: The Dual Visuals
To transform millions of complex data points into maps with actionable insights, Shulgin imported both datasets into Surfer. By layering onshore LiDAR in crisp grayscale against the vibrant multibeam bathymetry, he designed two distinct visual perspectives that told a comprehensive story. Here’s what each visual revealed.
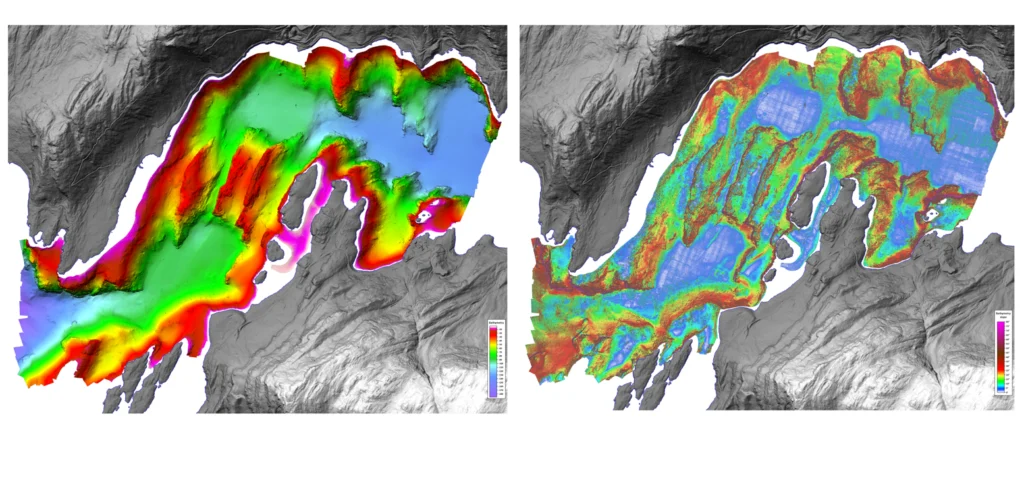
Visual 1: high-resolution bathymetry (depth mapping)
The first map rendered the underwater landscape in a continuous color spectrum, transitioning from warm reds along the shallow coasts to greens and blues in the fjord’s central channels. By merging this data with terrestrial elevation, Shulgin created a seamless transition across the shoreline:
As Shulgin noted, combining the datasets provided a complete picture: “This image combines onshore LiDAR data in grayscale with the high-resolution bathymetry survey… showing water depths in the fjord along with the sea bottom geology, like ridges.”
Visual 2: terrain modeling & slope stability analysis
While depth mapping establishes where the water is shallow or deep, construction planning requires understanding gradient and stability. Using Surfer’s terrain modeling tool, Shulgin calculated and mapped underwater slopes to identify potential hazards like marine landslides.
“Using the terrain modeling toolkit to show slope or curvature on DEMs gives completely different insights,” Shulgin explained. “From my end, looking at the slope underwater helps assess slope stability.”
This slope analysis led directly to the project’s critical “aha!” moment.
“In between the islands it’s relatively flat, so there were no issues,” Shulgin said. “However, on one edge of an island, there is a near-vertical wall. Anything dumped there would fall 40 meters down. Filling the flat areas was easy, but moving material into that section was a big challenge because of how much volume was required to level it out.”
Detecting this 40-meter drop-off before construction began would be invaluable. Without the terrain modeling, the coastal development team might have attempted to dump rock straight off the ledge, only to watch thousands of tons of infill slide uselessly into the depths. By catching the slope hazard early, the team could recalculate material volumes, adjust their infill strategy, and avoid significant cost overruns.
The Power of Visual Geophysics
By bringing terrestrial LiDAR and high-resolution multibeam bathymetry into a cohesive framework, Submara Survey transformed complex geophysical data into clear, decision-ready insights. With Surfer’s terrain modeling tools, Shulgin created striking visuals that uncovered hidden hazards to provide the coastal development team with the confidence to navigate their high-stakes marine project. Whether you are mapping offshore fjords, assessing slope stability, or planning complex infrastructure, the right visualization tools make all the difference in turning raw spatial data into actionable stories.
What’s the most unexpected underwater feature or bathymetric drop-off you’ve ever uncovered during a survey? Tell us your story below!
Recent Articles
- Oct 21, 2026|Gabbie Rhodes|7 min
Want your subsurface data to tell a clear story to stakeholders? Learn how to visualize it in 2D and 3D so your data clearly shares key insights.
- Oct 21, 2026|Gabbie Rhodes|10 min
With climate change data, you need to visualize where temperature, precipitation, and other variables occur and change over time. Learn how.
- Oct 14, 2026|Gabbie Rhodes|7 min
Mineral exploration requires you to analyze multiple variables. To do that successfully, you need to rely on both maps and graphs.
- Oct 7, 2026|Gabbie Rhodes|8 min
In the second post of our Visualizing Technical Data series, learn how maps and graphs can showcase your water quality data and uncover insights.