- Jan 8, 2025|Gabbie Rhodes|7 min read
Ever wanted to use new features but didn't know how long it'd take to learn and integrate them? Here's insight to understand the process.

About Golden Software
40 years ago, Golden Software began as a small company that develops, sells, and supports scientific visualization software.
Today, we still develop, sell, and support scientific visualization software, and more.
Surfer – Create an Immersive 2D/3D Model in Under 2 Minutes!
Grapher – If You Can Imagine It, You Can Graph It!
- Dec 18, 2024|Gabbie Rhodes|6 min
There are many benefits of utilizing technical support, particularly at Golden Software. Curious to learn what you can enjoy? Read more.
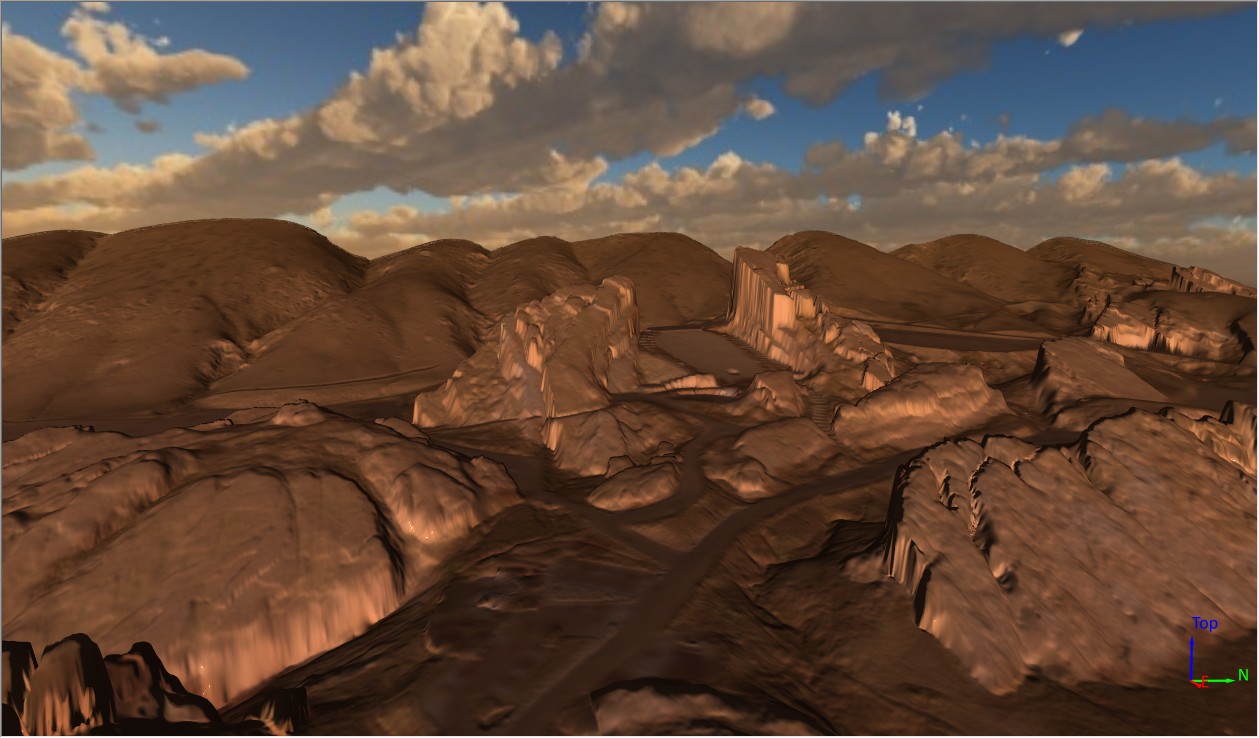
- Dec 5, 2024|Gabbie Rhodes|5 min
Topographic 3D maps are great tools for delivering insights to stakeholders, but they shouldn't be used in every situation. Learn more.
- Oct 31, 2024|Gabbie Rhodes|4 min
A geologist recently did a geophysics survey to map a graveyard in a British city. However, there were missing headstones and other mysteries.
- Oct 2, 2024|Gabbie Rhodes|5 min
When you have a good workflow, you may not want to change it. But there are good reasons to incorporate 3D visualization into your process.
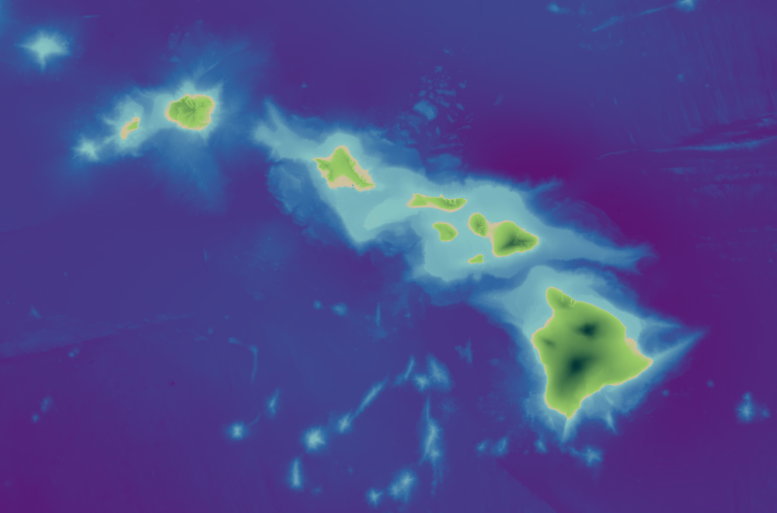
- Sep 26, 2024|Gabbie Rhodes|7 min
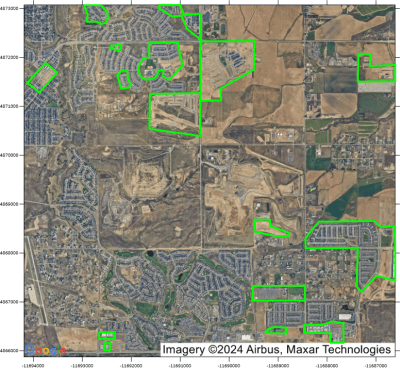
Satellite imagery can add context to your maps, but only when it's used properly. Execution matters. Learn when and how to use this asset.
- Sep 10, 2024|Katie Yoder|5 min
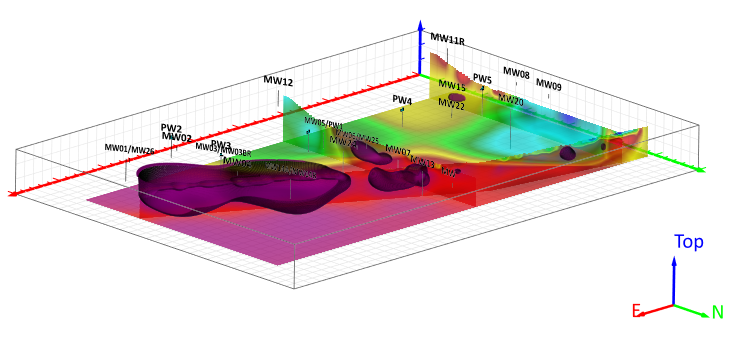
The latest version of Surfer adds 3D modeling functionality that include dynamic visualization tools and improved export and collaboration options.
- Aug 29, 2024|Drew Dudley|6 min
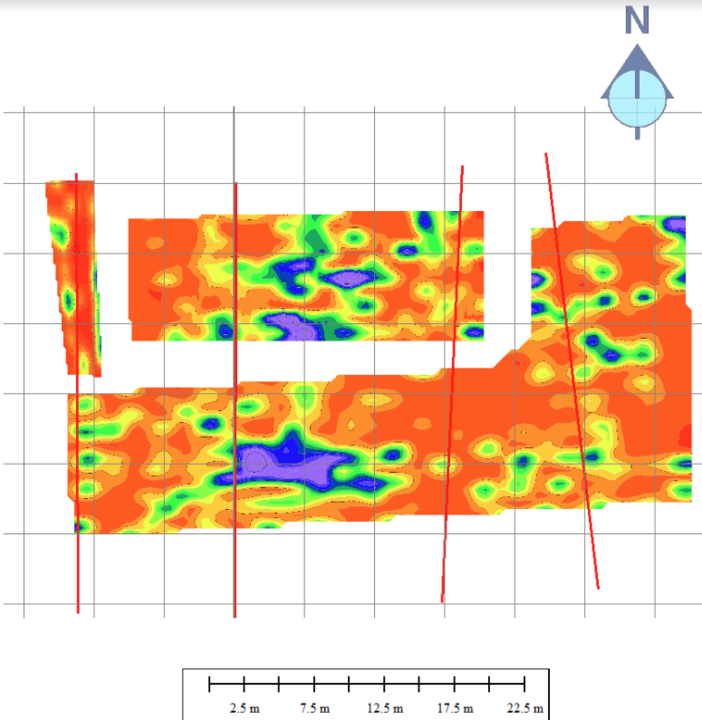
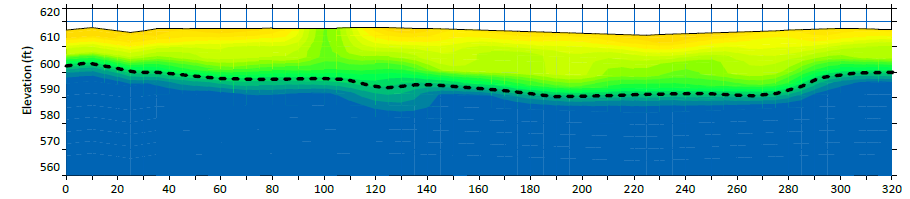
Gridding geophysical section data comes with some unique challenges that can be overcome by using these three best practices!
- Aug 14, 2024|Drew Dudley|5 min
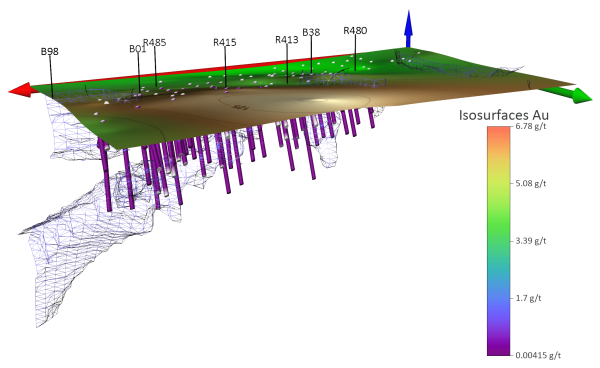
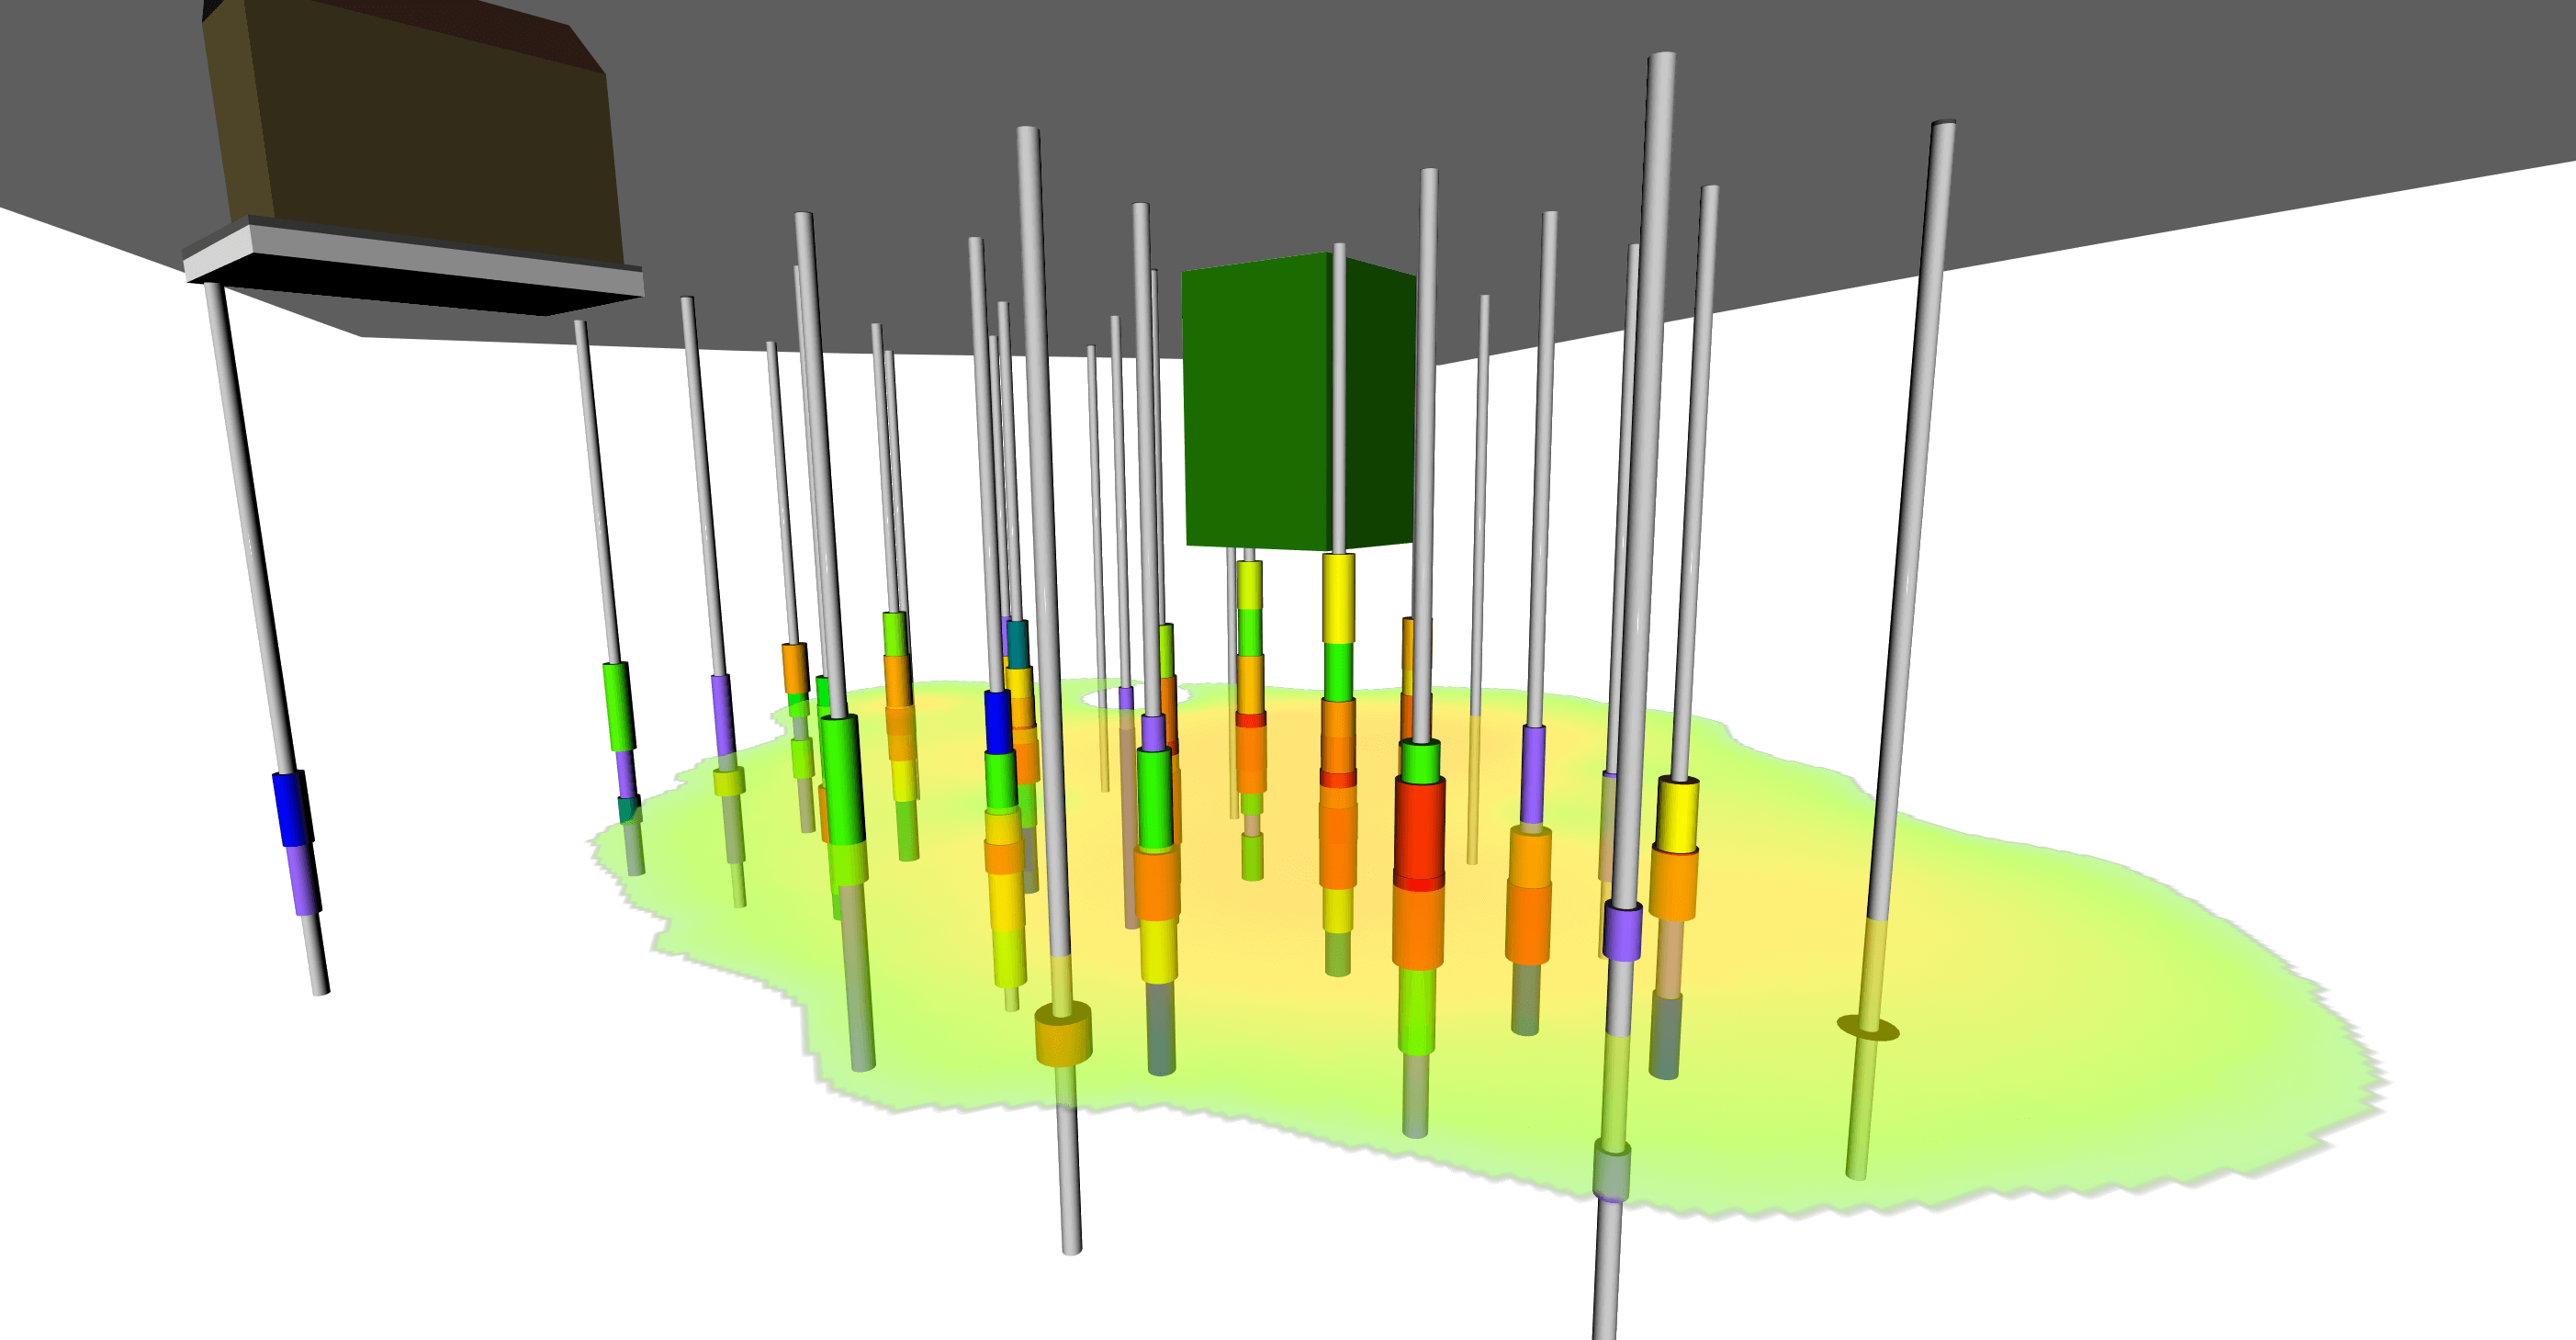
Gridding 3D drillhole data comes with some unique challenges that can be overcome by using these four best practices!
- Aug 1, 2024|Katie Yoder|4 min
Surfer and Grapher frame templates are designed to help you quickly create professional reports so you can spend more time doing what you love.
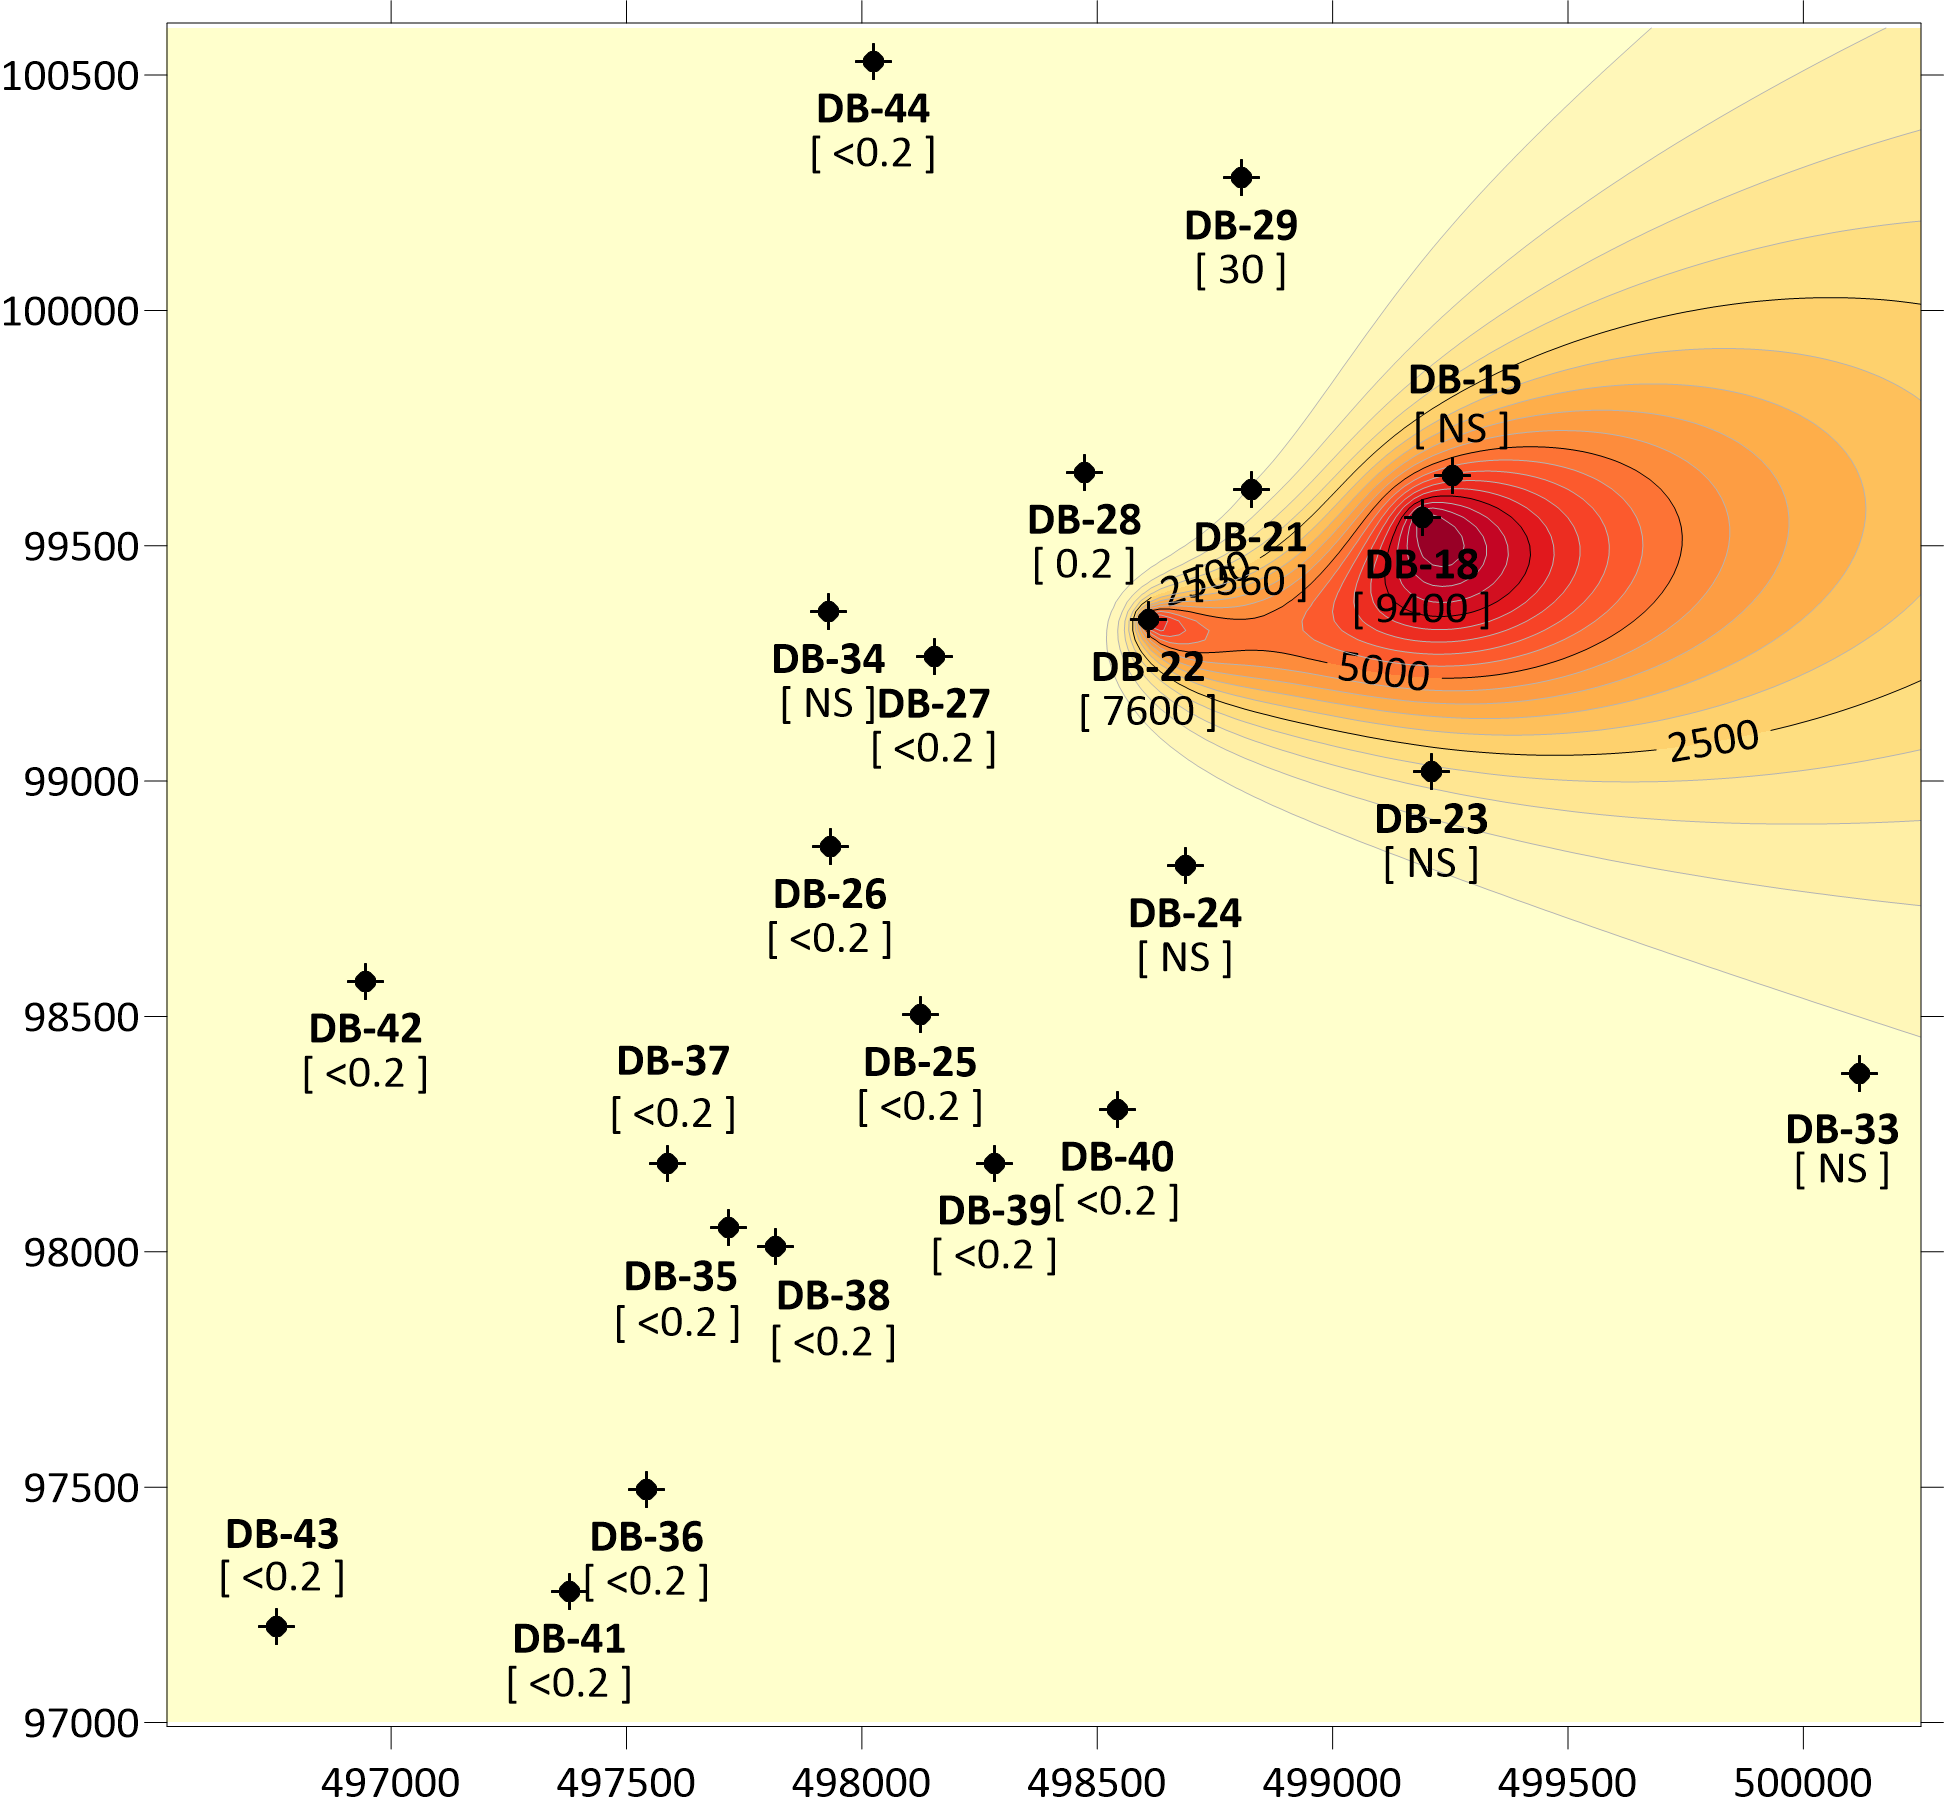
- Jul 25, 2024|Katie Yoder|7 min
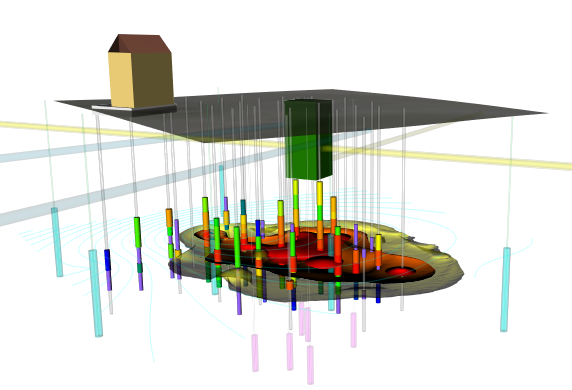
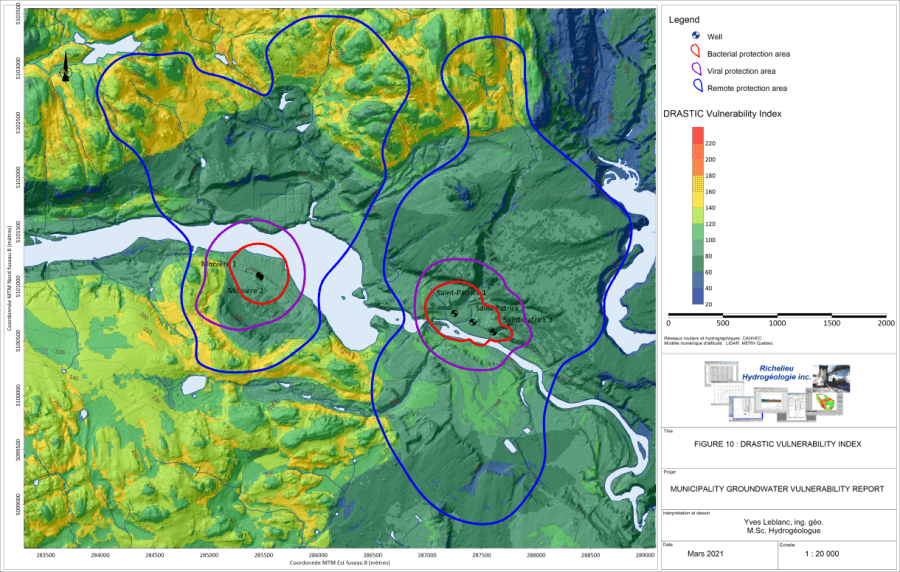
Gridding concentration data comes with some unique challenges that can be overcome by using these five best practices!
- Jun 20, 2024|Jake Stachewicz|3 min
Learn where to park in Red Rocks Amphitheater to avoid the longest walk and vertical incline according to a map and trail profiles created in Surfer.
- Jun 13, 2024|Katie Yoder|6 min
Imagine transforming a sea of numbers and charts into a captivating visual story. That's the power of effective color mapping in data visualization.