How to Support Tsunami Preparedness By Visualizing Historical Impact and Risk


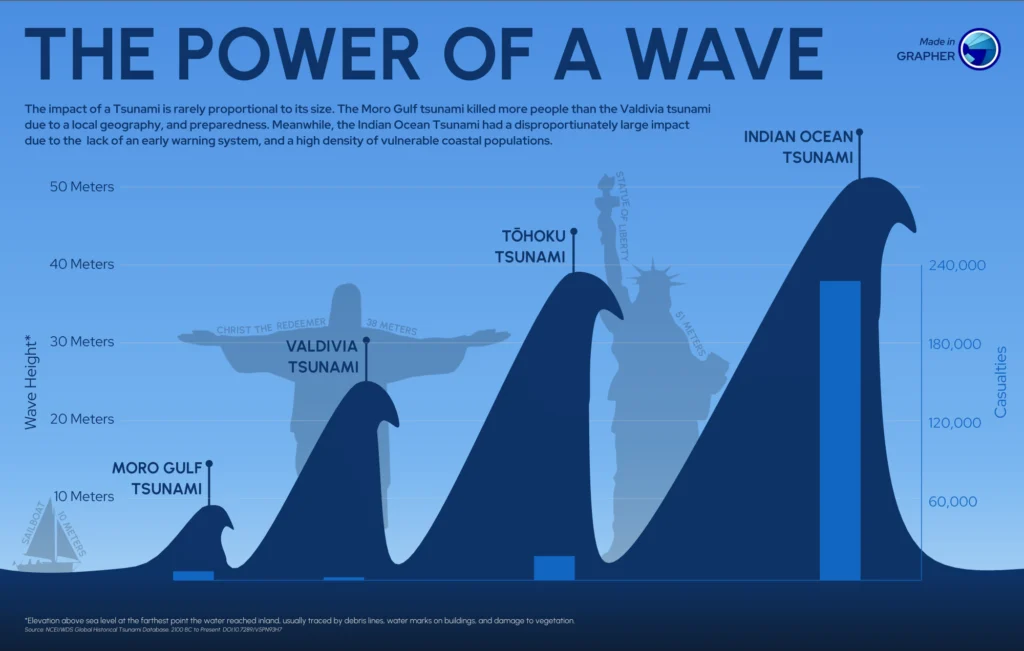
Tsunamis are among the most destructive natural hazards on Earth. Triggered by undersea earthquakes, volcanic eruptions, or landslides, they can travel across entire ocean basins before making landfall with devastating force. For many coastal communities, the time between detection and impact may be measured in minutes, leaving little opportunity to react once a tsunami is already underway. That reality makes tsunami preparedness fundamentally different from preparing for many other natural hazards.
Rather than relying solely on real-time monitoring, geo-professionals must understand where tsunamis have occurred in the past, which coastlines are most vulnerable, and how future waves may interact with the seafloor and coastal landscape. Historical records, bathymetric data, topography, and wave modeling all contribute valuable pieces of information—but only when they’re brought together in a way that’s easy to interpret.
That’s where data visualization plays a critical role.
By transforming complex datasets into clear, actionable visuals, geo-professionals can better understand tsunami behavior, identify areas at greatest risk, and communicate those findings to emergency managers, planners, and community leaders.
Why Tsunami Preparedness Requires Understanding More Than the Wave
If historical records, bathymetry, topography, and wave models each contribute to tsunami preparedness, is it really necessary to bring all of them together in a way that’s easy to interpret? The answer is yes, and it begins with understanding that a tsunami’s impact depends on much more than one element.
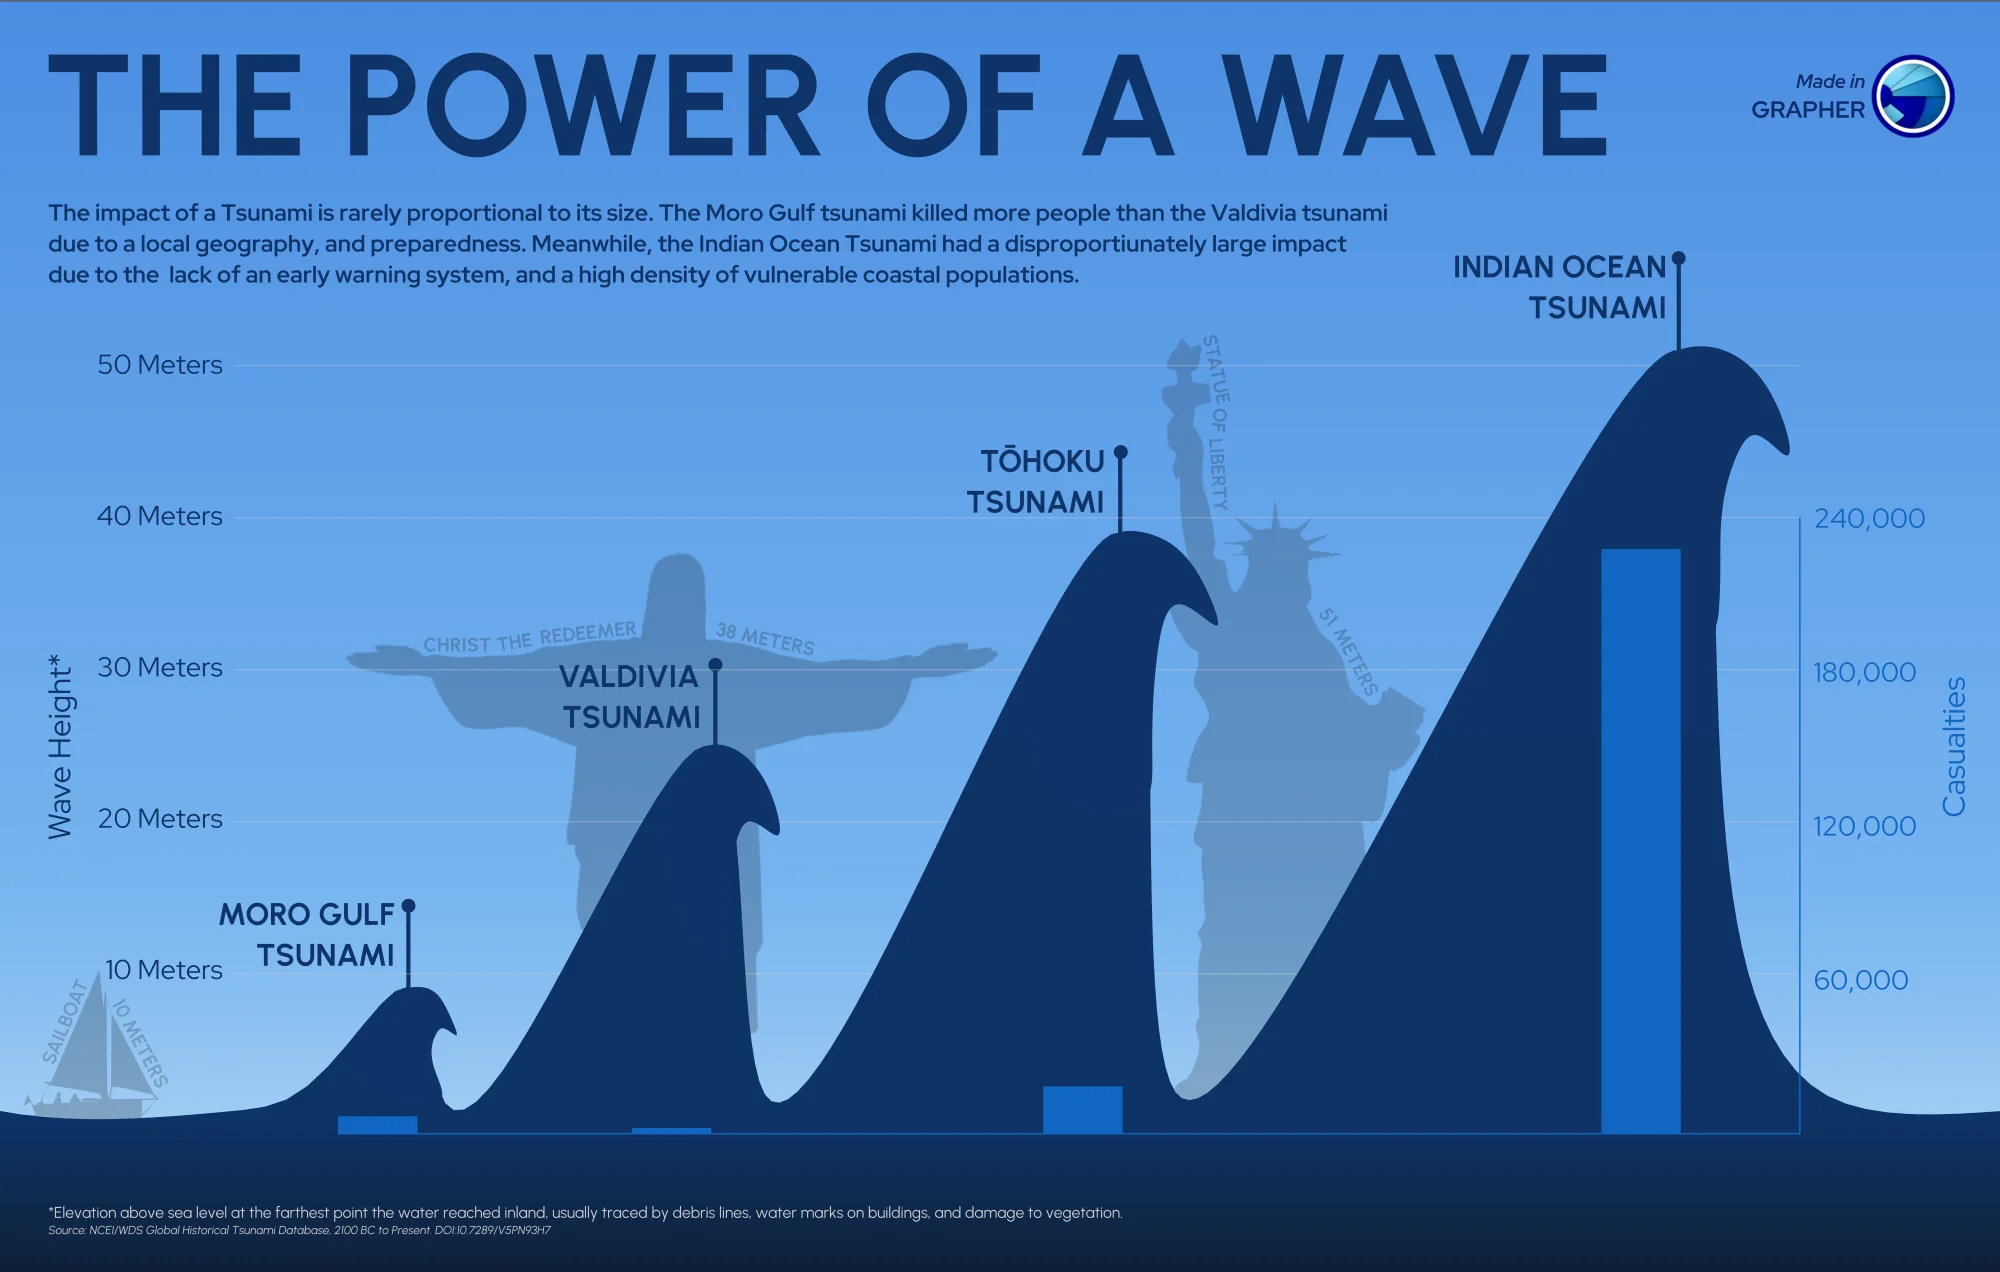
When people think about tsunamis, it’s easy to consider one measurement, specifically wave height. While that measurement is important, it only tells part of the story. Two tsunamis with similar wave heights can produce dramatically different impacts depending on how they interact with the ocean floor and the coastline they ultimately reach. That’s because a tsunami’s behavior begins long before it arrives onshore.
The source and magnitude of the seafloor displacement determine how much water is initially displaced. As the wave travels across the ocean, water depth and underwater terrain influence its speed and direction. As it approaches land, the shape of the shoreline, coastal bathymetry, and onshore ground surface elevation all affect how the wave transforms, how far inland it travels, and which communities face the greatest risk. Because these variables influence one another across enormous geographic areas, visualizing only one dataset makes it difficult to understand how a tsunami may actually behave.
Visualizing How Tsunamis Develop and Travel
Now that we’ve explored why tsunami preparedness depends on more than one dataset like wave height, the next question becomes: how can geo-professionals actually visualize all of these interacting variables?
Rather than relying on a single map, tsunami preparedness often involves a series of complementary visualizations. Each one reveals a different stage of the tsunami’s journey, from the initial triggering event to the areas that may ultimately be inundated along the coast. Keeping that in mind, here’s what experts should visualize to support tsunami preparedness.
Visualize where the tsunami begins
Every tsunami starts with an event that suddenly displaces a large volume of water. In some cases, that’s a powerful undersea earthquake, although volcanic eruptions and submarine landslides can also generate destructive waves.
One of the first visualizations to create can showcase the source of the tsunami itself. These maps often show:
- The earthquake epicenter or other triggering event
- Fault movement and the extent of seafloor displacement
- Surrounding bathymetry
Visualizing these conditions establishes where the tsunami originated while providing the starting information needed for wave modeling. It also helps connect the triggering event with the regions that may later experience its effects.
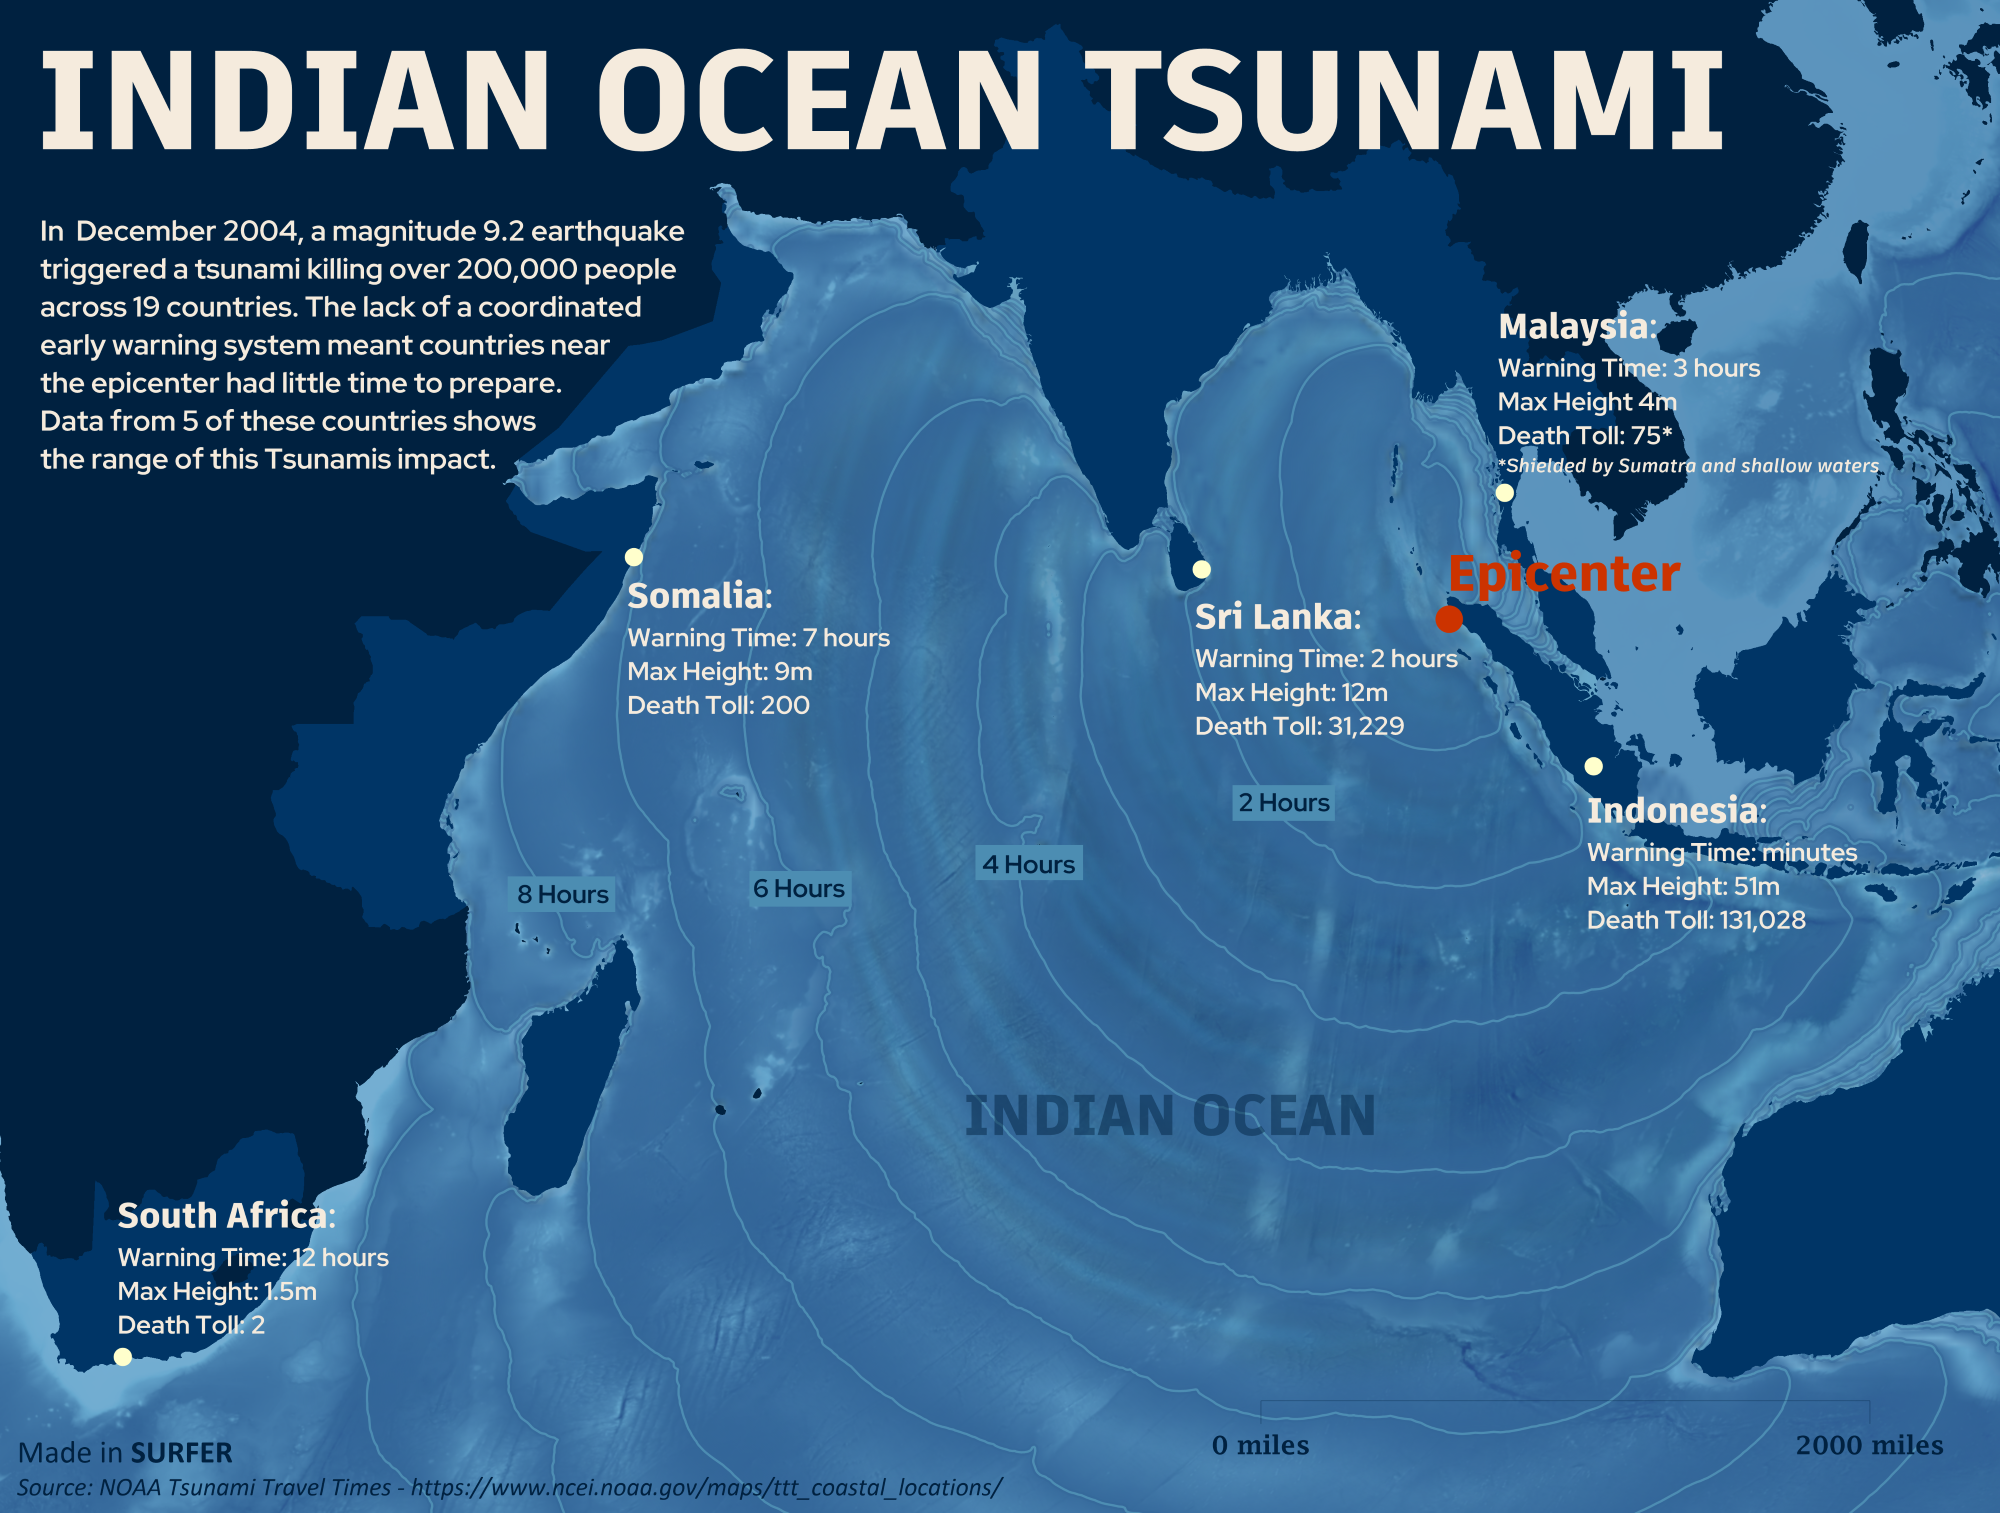
The 2004 Indian Ocean tsunami demonstrated why this first step is so important. Although the earthquake occurred off the coast of Sumatra, tsunami waves traveled across the Indian Ocean and affected countries thousands of kilometers away like Kenya and Tanzania.
Map how the wave travels across the ocean
After the tsunami forms, the shape of the seafloor begins influencing its behavior. That’s where bathymetric visualizations are helpful, as they reveal underwater features such as:
- Ocean depth
- Continental shelves
- Trenches
- Underwater ridges
- Changes in seafloor elevation
These features help determine how tsunami waves travel, where they slow down or accelerate, and how their energy changes before reaching land. Because bathymetry provides one of the primary inputs for tsunami modeling, color relief maps and contour maps of the seafloor are often used alongside numerical models.
From there, geo-professionals can model wave propagation itself. Depending on the project, this may involve wave-height maps, travel-time contours, sequential map snapshots, or animated simulations showing the tsunami spreading outward from its source.
These visualizations can help answer critical preparedness questions, including:
- Which coastlines could be affected?
- Which communities have the shortest evacuation windows?
- How might tsunami conditions differ from one shoreline to another?
Again, the 2004 Indian Ocean tsunami illustrates the value of this approach. Because the tsunami crossed an entire ocean basin, wave propagation models have become essential for understanding how distant coastlines can remain at significant risk long after the initial earthquake occurs.
Looking below the seabed understand what happens when the wave reaches shore
As a tsunami approaches land, understanding the transition between the ocean and the coastline becomes just as important as understanding the wave itself.
To build that complete picture, it’s helpful to combine bathymetric data below sea level with coastal topography above sea level into a continuous elevation model. This type of visualization can provide insight into how tsunami water may move from offshore areas onto land while identifying low-lying terrain that is particularly vulnerable.
From there, inundation models can estimate not only where tsunami water could travel but also how deep it may become across different parts of the landscape. Two locations inside the same inundation zone may experience dramatically different water depths, resulting in very different levels of damage.
The 2011 Tōhoku earthquake and tsunami highlighted the importance of these visualizations. Post-tsunami surveys documented how far water traveled inland, with observations showing inundation extending more than four kilometers inland in parts of the Sendai Plain. Researchers have since used observations from the event to reassess tsunami hazards and evaluate and improve inundation models, strengthening the information available for future preparedness and planning.
Preparedness becomes even more actionable when these hazard maps are combined with information about the built environment. Overlaying inundation models with roads, bridges, hospitals, schools, ports, utilities, and population centers shifts the conversation from “Where could the water go?” to “What could be affected if it gets there?”
How Different Stakeholders Use Tsunami Visualizations
Now, the real value of visualization lies in helping different groups make better decisions before, during, and after a tsunami. While they may all rely on the same underlying data, each stakeholder uses it to answer different questions and support different aspects of preparedness. Here’s what that looks like in practice.
Emergency managers
For emergency managers, time is everything. Tsunami travel-time maps, inundation models, and evacuation route visualizations help identify which communities may have the shortest response windows and where people should move to reach safety.
These visualizations also support emergency planning long before a tsunami occurs by helping agencies identify evacuation bottlenecks, refine response strategies, and prepare for a range of potential scenarios rather than reacting to a single event.
Engineers and infrastructure planners
Engineers use tsunami visualizations to understand how coastal infrastructure could be affected during future events. By overlaying inundation maps with roads, bridges, ports, utilities, hospitals, and other critical facilities, they can identify assets that may require additional protection or redesign. This information also supports long-term infrastructure planning by helping communities invest in projects that improve resilience before disaster strikes.
Urban and community planners
Preparedness also influences how coastal communities grow over time. Urban planners can use tsunami hazard maps alongside land-use and elevation data to better understand where future development may face greater risk.
These insights can help guide zoning decisions, identify suitable locations for critical facilities, and support community planning that accounts for long-term tsunami hazards rather than only immediate response needs.
Public officials and community leaders
Not everyone interpreting tsunami maps has a technical background. Public officials and community leaders often need to communicate risk to residents, coordinate preparedness initiatives, and support informed decision-making.
Clear, well-designed visualizations make these conversations much easier. Rather than relying on technical reports or raw datasets, stakeholders can quickly understand where hazards exist, who may be affected, and why preparedness measures—such as evacuation planning or infrastructure improvements—are necessary.
Turning Visualization Into Preparedness
Preparing for the next tsunami begins long before a wave reaches the shoreline. It starts with understanding historical tsunami impacts, bathymetry, coastal topography, and wave models to reveal where future hazards may exist. By transforming these complex datasets into clear, actionable visualizations, geo-professionals can better identify vulnerable areas, communicate risk, and support decisions that strengthen tsunami preparedness. The clearer the picture you create today—with the various datasets available—the better equipped communities will be to respond when the next tsunami occurs.
How are you using maps, models, or other visualizations to support natural hazard preparedness? Share your experience or favorite visualization techniques in the comments below!
Recent Articles
- Nov 11, 2026|Gabbie Rhodes|8 min
Transforming complex datasets into clear, actionable visuals can help you understand tsunami behavior and risk, enhancing tsunami preparedness.
- Nov 4, 2026|Gabbie Rhodes|6 min
Discover how Alexey Shulgin, Chief Geophysicist at Submara Survey, used various visuals to inform a Norwegian city's dredging project.
- Oct 28, 2026|Gabbie Rhodes|8 min
For our 2026 All Hands Meeting, our team gathered in Colorado for a few days of workshops, customer conversations, and fun activities.
- Oct 21, 2026|Gabbie Rhodes|7 min
Want your subsurface data to tell a clear story to stakeholders? Learn how to visualize it in 2D and 3D so your data clearly shares key insights.