What Are the Causes of a Landslide? Here’s the Answer & How To Visualize At-Risk Areas

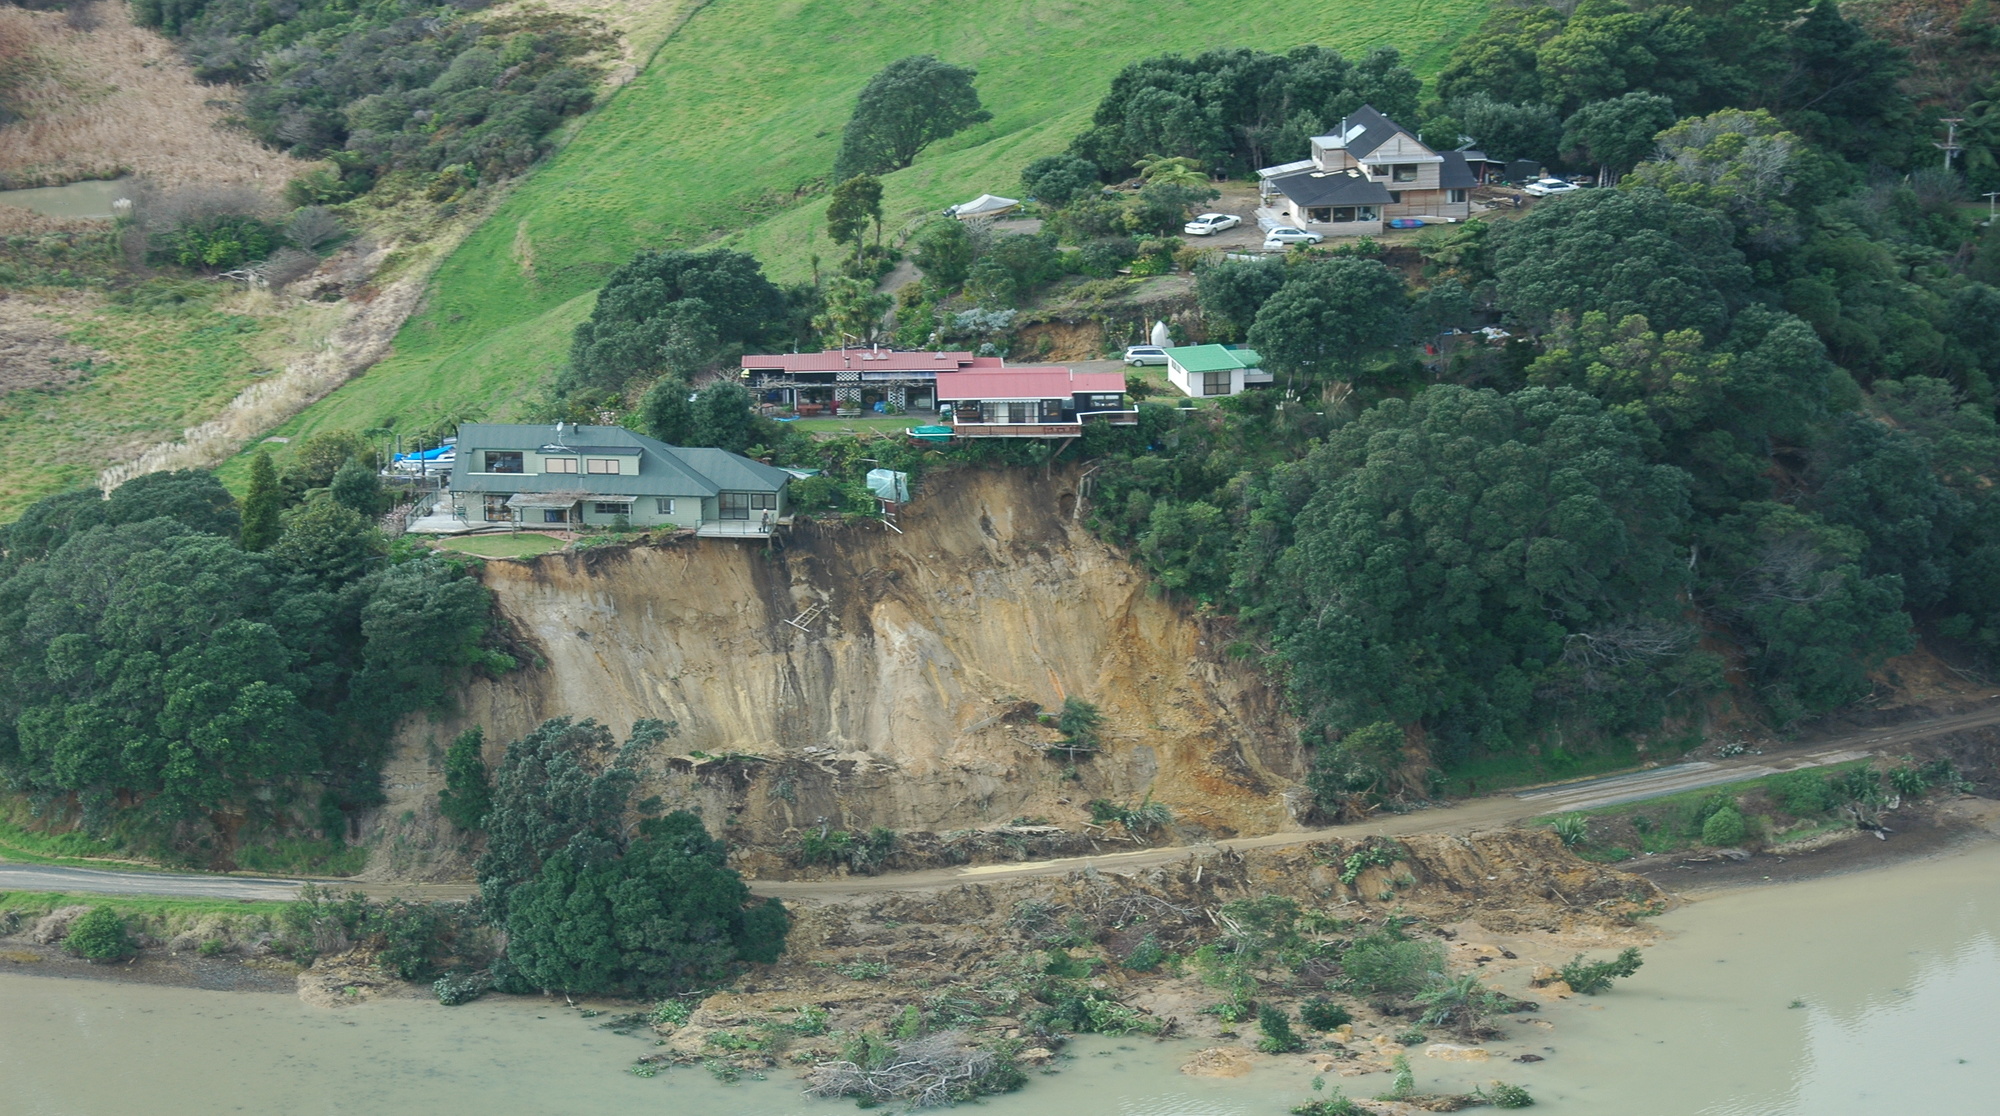
A landslide can seem to happen without warning. One moment, a hillside appears stable. The next, soil, rock, and debris are racing downslope, threatening roads, infrastructure, ecosystems, and communities. But while the movement itself may appear sudden, the conditions that contribute to slope failure often develop long before the first signs of collapse become visible.
Understanding those conditions is essential for assessing landslide risk. Just as importantly, visualizing them can reveal patterns that are difficult to recognize from raw data alone. By combining those contributing factors into visualizations, geo-professionals can identify areas that may be more susceptible to slope failure and communicate those risks more effectively to planners, engineers, and other stakeholders.
But what are the causes of a landslide in the first place? Let’s explore why these events occur and then look at how maps and models bring those contributing factors into focus.
What Are the Causes of a Landslide?
Landslides happen when the forces pulling soil, rock, and other material downslope become stronger than the forces holding that material in place. While gravity is always acting on a slope, a landslide typically doesn’t have a single cause. Instead, slopes often become increasingly vulnerable over time before a triggering event pushes them past the point of failure. Here are several of those triggering events and how they play a role in producing a landslide.
1. Steep slopes
Gravity continuously pulls soil and rock downslope. As a slope becomes steeper, the downslope component of that force increases, placing greater stress on the material. While steep terrain isn’t guaranteed to fail, it is generally more susceptible to landslides, especially when combined with other unfavorable conditions.
2. Soil and rock composition
Not all geological materials behave the same way. Different soil and rock types have different strengths, permeabilities, and responses to water. Weak, weathered, fractured, or poorly consolidated materials are often more susceptible to failure than stronger, more intact formations. Geological layering can also influence how water moves through a slope, creating zones where failure is more likely.
3. Water saturation and heavy rainfall
Rainfall is one of the most common triggers of landslides. As water infiltrates the ground, it can increase the weight of the slope, raise pore-water pressure, and reduce the strength holding soil and rock together. When those changes occur on an already vulnerable slope, failure becomes much more likely.
4. Vegetation degradation
Vegetation plays an important role in slope stability. Plant roots help reinforce soil, while vegetation also influences how rainfall infiltrates the ground and how water flows across the surface. When vegetation is removed through wildfire, logging, land clearing, or development, those stabilizing effects are reduced, increasing the potential for slope failure.
5. Erosion
Over time, rivers, waves, runoff, and other erosional processes can remove material from the base of a slope. As that natural support disappears, the remaining soil and rock become increasingly unstable and may eventually collapse under their own weight.
6. Earthquakes and ground shaking
Strong ground motion can destabilize slopes that are already susceptible to failure. Earthquakes may dislodge loose material, weaken fractured rock, or trigger movement along existing zones of weakness that had previously remained stable.
7. Human activity
People can unintentionally increase landslide risk by changing the natural forces acting on a slope. Construction, excavation, road building, altered drainage, added fill, and vegetation removal can all affect slope stability, particularly when several of these changes occur together.
Real-World Examples: When Multiple Factors Come Together
While it’s helpful to discuss landslide causes individually, like we’ve already mentioned, they rarely occur in isolation. Most landslides result from multiple contributing factors interacting over time before a triggering event finally causes the slope to fail. Here are three well-known examples that illustrate how those factors can work together.
The Oso Landslide (Washington, USA)
In March 2014, a hillside near Oso, Washington, collapsed following weeks of heavy rainfall, producing the deadliest single landslide event in U.S. history.
Several of the factors we just discussed contributed to the failure in these ways:
- Steep Glacial Terrain: The slope was composed of roughly 18 million tons of weak, unconsolidated sand, till, and clay left behind by ancient glaciers.
- Extreme Seasonal Rainfall: Precipitation in the area during February and March 2014 reached 150 to 200 percent of the long-term average, elevating pore-water pressure deep within the slope.
- Two-Stage Failure Mechanism: Seismic data analyzed by the USGS showed the collapse occurred in two distinct stages within about 2 minutes of each other. During the second stage, the failing mass accelerated across the North Fork Stillaguamish River, acquiring extra water and rapidly liquefying into a mobile mudflow.
- River Undercutting & Valley Geometry: Historical river erosion at the toe of the slope had systematically removed support over decades, leaving the slope uniquely vulnerable to a high-speed flow that crossed the entire river valley.
Rather than resulting from a single isolated trigger, this complex, deep-seated failure rapidly transitioned into a high-velocity debris flow because multiple geological and hydrological conditions had already destabilized the slope long before the final collapse occurred.
The Montecito Debris Flows (California, USA)
Following California’s Thomas Fire in late 2017, the steep watersheds above Montecito were left stripped of much of their vegetation. Just weeks later, an intense winter storm triggered devastating debris flows that swept through nearby neighborhoods.
Here’s how several contributing factors aligned to produce the event:
- Burned Watersheds: The Thomas Fire removed much of the vegetation that had helped stabilize the hillsides. The burned landscape also became more susceptible to increased runoff and erosion during subsequent storms.
- Intense Rainfall: A short but powerful winter storm generated rapid runoff across the burned terrain, triggering destructive debris flows.
- Steep Mountain Slopes: The steep catchments of the Santa Ynez Mountains allowed mud, rocks, and debris to accelerate downslope before spreading into developed neighborhoods.
The Montecito disaster demonstrates that landslide hazards don’t always end when a wildfire is extinguished. In many cases, the greatest risk emerges afterward, when intense rainfall interacts with recently burned terrain that has become far more vulnerable to debris flows.
The Wenchuan Earthquake (China)
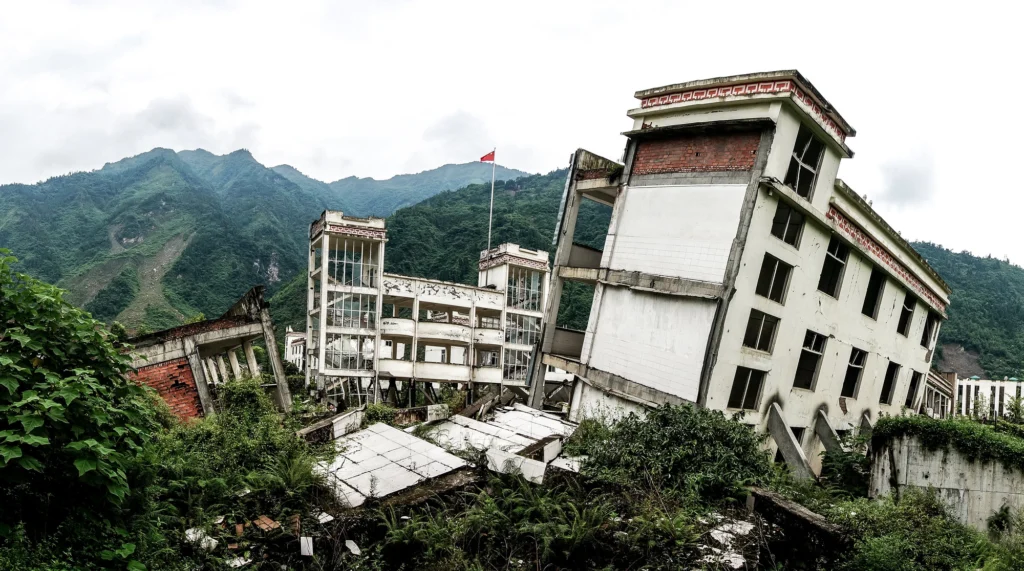
When the 2008 Wenchuan earthquake struck southwestern China, the powerful ground shaking triggered 56,000 landslides throughout the surrounding mountains.
Here’s how multiple conditions combined to produce widespread slope failures:
- Strong Earthquake Shaking: Powerful seismic forces destabilized slopes throughout the region, triggering failures across a vast mountainous landscape.
- Steep Mountain Terrain: The rugged slopes of the Longmen Shan mountain range increased the likelihood that loosened material would move rapidly downslope.
- Fractured Rock and Geological Weaknesses: Existing fractures, faults, and other geological weaknesses left many slopes especially vulnerable once intense ground shaking began.
Many of the landslides dammed rivers, buried roads, and complicated rescue and recovery efforts long after the earthquake itself had ended.
How to Visualize At-Risk Areas
Understanding what causes landslides is only part of the equation. The next step is identifying where those conditions exist across a landscape. That’s where landslide susceptibility mapping comes into play.
Instead of relying on a single dataset, geo-professionals can combine and visualize multiple sources of information that represent the conditions contributing to slope instability. Each dataset adds another piece of context, and together, they can reveal locations where multiple risk factors coincide.
However, it’s important to note that, in most cases, these visuals help identify areas that may be more susceptible to landslides; they don’t predict exactly when or where one will occur. With that distinction in mind, here are some of the most valuable ways to visualize landslide risk.
Map elevation and slope
Because topography influences how gravity acts on a hillside, elevation is often one of the first datasets geo-professionals can analyze. Visualizing the landscape helps identify terrain where slope geometry may contribute to instability and highlights areas that deserve closer investigation.
Potential visuals include:
- DEMs
- slope maps
- contour maps
- shaded relief maps
- 3D terrain models
These visualizations can reveal:
- steep terrain
- abrupt changes in slope
- valleys and drainage features
- areas where topography may contribute to instability
Example: A slope map derived from a DEM can highlight steep hillsides that warrant closer geotechnical investigation when compared with geology, rainfall, or soil-stability data. Planners and engineers can then prioritize those areas for field assessments before designing roads, buildings, or other infrastructure.
Visualize soil and geological conditions
The shape of a slope is only part of the story. The materials beneath the surface also influence how stable that slope will be under changing environmental conditions, making them critical to visualize.
Potential visuals include:
- soil-type maps
- geological maps
- classified maps showing different soil or rock units
- cross-sections showing subsurface geology
- overlays combining geology with terrain
These visualizations can reveal:
- locations containing materials more susceptible to failure
- relationships between geological conditions and steep terrain
Example: Overlaying geological units on a slope map can identify steep areas underlain by comparatively weak or highly weathered materials. When those conditions occur together, geo-professionals can better determine where additional geotechnical investigation or slope stabilization may be appropriate before development moves forward.
Map rainfall and water conditions
Because water is one of the most common landslide triggers, visualizing how it enters and moves through the landscape provides valuable insight into slope conditions.
Potential visuals include:
- rainfall contour maps
- color-relief precipitation maps
- groundwater or pore-pressure maps (when available)
- time-series graphs showing rainfall accumulation
- overlays of rainfall and susceptible terrain
These visualizations can reveal:
- where slopes are experiencing or have experienced significant water input
- whether heavy precipitation overlaps with susceptible terrain
Example: Comparing cumulative rainfall with mapped landslide-susceptibility zones can identify locations where already vulnerable slopes are experiencing unusually wet conditions. This information can help agencies prioritize monitoring efforts, inspections, or temporary hazard assessments following major storm events.
Visualize vegetation degradation
Vegetation helps stabilize slopes, so changes in land cover can be an important indicator of increasing landslide susceptibility.
Potential visuals include:
- vegetation-cover maps
- before-and-after maps
- burn-severity maps
- satellite or aerial imagery
- overlays of vegetation loss and slope
These visualizations can reveal:
- slopes where vegetation has recently been removed or significantly reduced
- areas where erosion and runoff conditions may have changed
Example: Overlaying a recent wildfire perimeter or burn-severity dataset with slope can identify steep burned terrain that may warrant additional post-fire debris-flow assessment. Identifying those locations early empowers land managers to prioritize erosion-control measures, monitoring, or emergency planning before heavy rainfall arrives.
Map known landslides and historical activity
Past landslides often provide valuable context for understanding future ones. Visualizing historical failures can help identify recurring patterns and areas with a documented history of instability.
Potential visuals include:
- landslide inventory maps
- point maps of known landslides
- mapped landslide or debris-flow boundaries
- overlays of historical landslides with slope, geology, or rainfall
These visualizations can reveal:
- areas with a documented history of instability
- spatial relationships between previous failures and current terrain or geological conditions
Example: Plotting historical landslide locations over slope and geology maps can determine whether past failures consistently occur under similar conditions. Those patterns can equip planners and engineers to focus future investigations on areas where multiple risk factors overlap rather than evaluating every slope equally.
Best Practices for Communicating Landslide Susceptibility
The value of a landslide susceptibility map depends not only on the quality of the analysis but also on how clearly the results are communicated. Thoughtful map design helps stakeholders understand both the findings and the reasoning behind them. To support better decisions, the final visualization should clearly communicate both what the analysis shows and what it doesn’t. Here are a few design best practices to keep in mind.
Explain what the map is showing
One of the most important things you can communicate is that a susceptibility map is not a prediction of exactly when or where the next landslide will occur. Instead, it identifies areas where conditions may make slope failure more likely based on the variables included in the analysis.
Just as importantly, help stakeholders understand how the map reached those conclusions. Clearly explain which factors were included, what the susceptibility classifications represent, and any important limitations or uncertainty in the analysis. When appropriate, include supporting maps that show variables such as slope, geology, rainfall, or vegetation. Providing that additional context helps stakeholders understand why an area received its susceptibility classification rather than asking them to rely solely on a final color-coded map.
Choose colors intentionally
Color plays an important role in how people interpret risk. Use a logical progression that clearly distinguishes lower- and higher-susceptibility areas while avoiding color schemes that exaggerate relatively small differences in the data.
Thoughtful color choices make the map easier to interpret at a glance and help ensure the visualization accurately reflects the results of the analysis rather than unintentionally overstating the level of risk.
Provide geographic context
Even the most accurate susceptibility map has limited value if viewers can’t relate it to the places they care about. Include familiar reference features—such as roads, communities, infrastructure, waterways, political boundaries, or landmarks—so stakeholders can quickly understand where susceptible areas exist in relation to existing development or planned projects. That added context helps transform a technical map into a practical decision-making tool for engineers, planners, emergency managers, and other audiences.
Bringing the Warning Signs Into Focus
Landslides may appear to happen suddenly, but the conditions that contribute to them often develop over time. Understanding what causes a landslide is the first step toward recognizing terrain that may be more susceptible to failure.
But as we’ve explored, no single factor tells the whole story. Slope, geology, water, vegetation, erosion, and human activity can all interact in ways that increase instability. By visualizing those conditions individually and together, geo-professionals can transform scattered datasets into a clearer picture of landslide susceptibility.
While no analysis can predict a landslide with certainty, effective visualization helps reveal where warning signs overlap so planners, engineers, emergency managers, and other stakeholders can make better-informed decisions before slope failure occurs.
What factors do you typically consider when evaluating slope stability or landslide susceptibility? Share your approach in the comments below!
Recent Articles
- Oct 7, 2026|Gabbie Rhodes|8 min
In the second post of our Visualizing Technical Data series, learn how maps and graphs can showcase your water quality data and uncover insights.
- Oct 7, 2026|Gabbie Rhodes|12 min
Have you ever wondered: what are the causes of a landslide? Discover the answer and how to visualize at-risk areas.
- Sep 29, 2026|Gabbie Rhodes|9 min
When visualizing technical data, a map will reveal certain insights, while a graph will reveal other insights. You need both to get the full picture.
- Sep 29, 2026|Gabbie Rhodes|5 min
Repetition slowing you down? Automation can quicken your high-volume workflow, remove manual steps, and even improve consistency.