- Jul 16, 2025|Gabbie Rhodes|11 min read
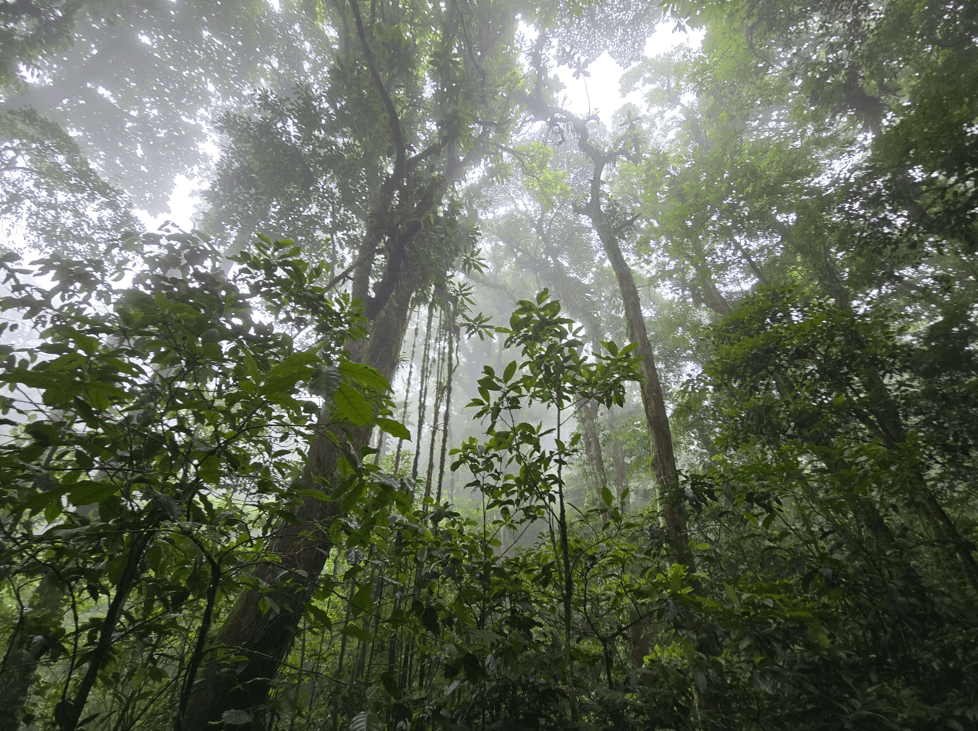
Our Product Manager Sheena Skinner went to Costa Rica and adventured through its beautiful, varied ecosystems. Discover its wonders.
About Golden Software
Since 1983, Golden Software has been at the forefront of scientific data visualization.
Today, we empower professionals to solve real-world problems by transforming complex data into clear, impactful visual stories through our industry-leading software and legendary customer support.
Surfer – Create an Immersive 2D/3D Model in Under 2 Minutes!
Grapher – If You Can Imagine It, You Can Graph It!
- Jul 9, 2025|Gabbie Rhodes|8 min
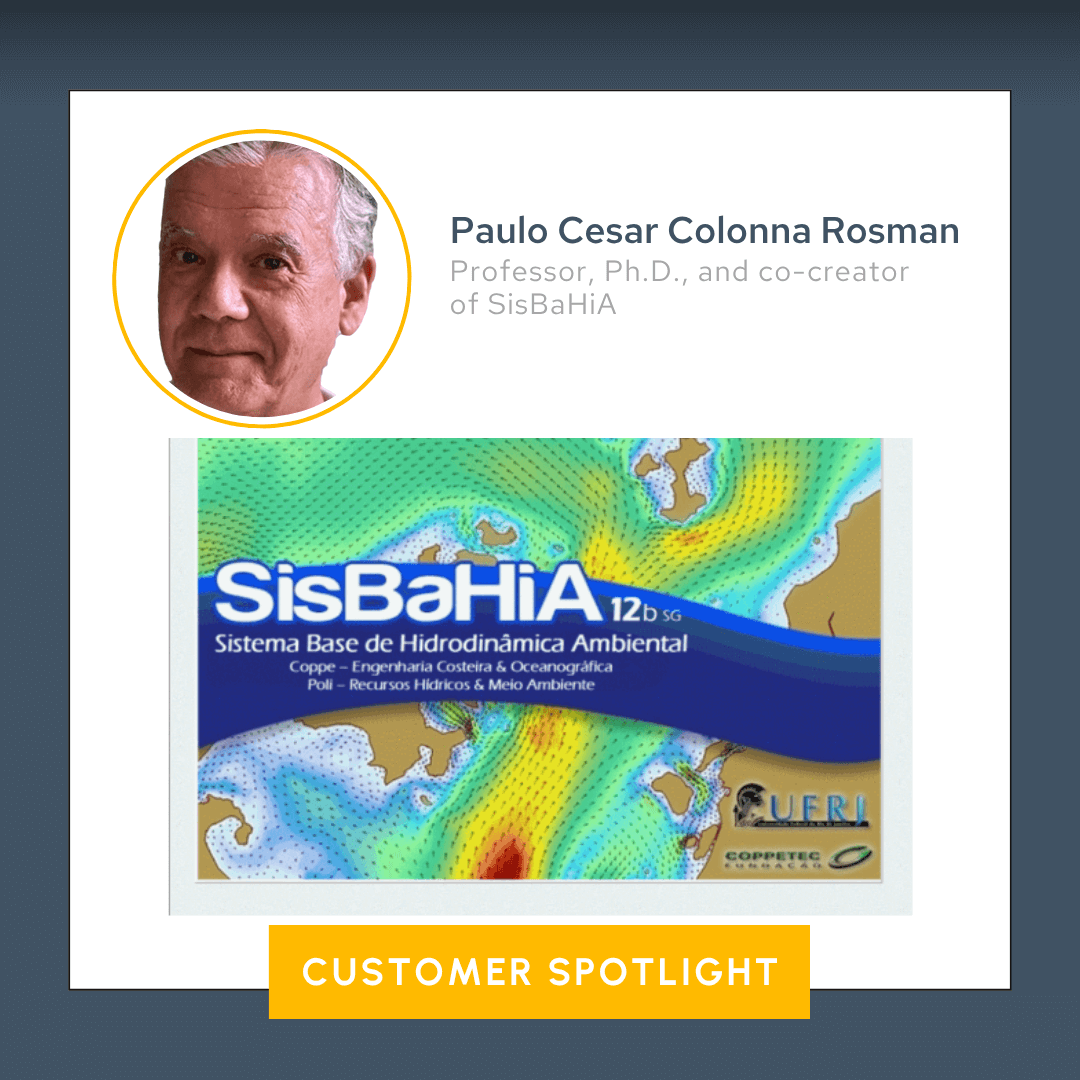
SisBaHiA models natural water bodies in Brazil and beyond, delivering key insights. It also integrates with Surfer and Grapher to get the job done.
- Jul 9, 2025|Gabbie Rhodes|6 min
You have to be efficient in today's fast-paced world. To map your data as quick as possible, automation can be a gamechanger. Learn more.
- Jul 2, 2025|Gabbie Rhodes|12 min
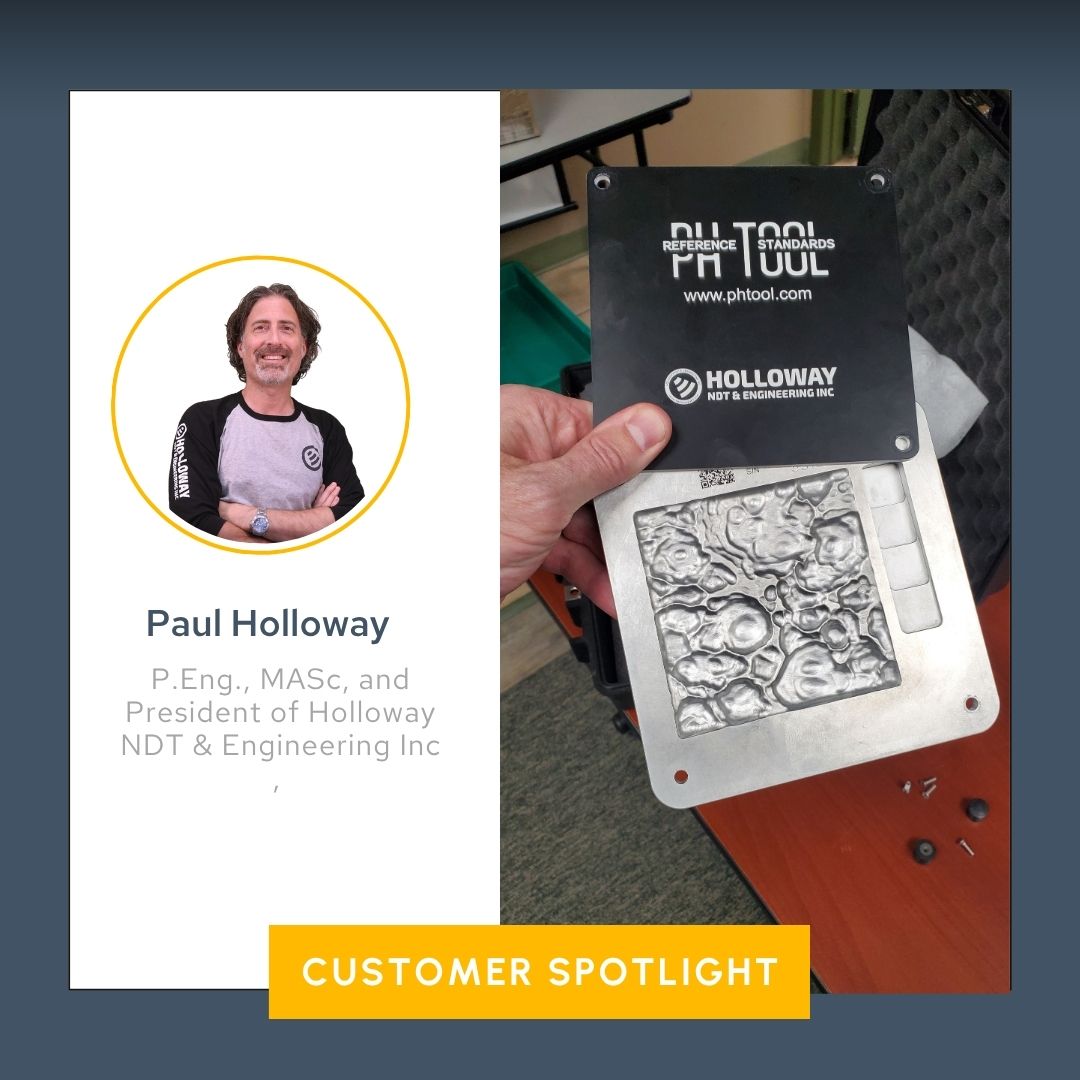
It's important to train and test NDT operators effectively before they go into the field. But how? That's where CUT Boards and Surfer come in.
- Jul 2, 2025|Gabbie Rhodes|5 min
Dino Fest 2025 in Denver's Thornton Arts and Culture Center is helping kids love STEM through fun, educational activities. Learn why this matters!
- Jun 25, 2025|Gabbie Rhodes|6 min
When you get new data, it's time to refresh your Grapher plots with the latest insights. The best way to do it? Using the Remap Worksheets tool.
- Jun 25, 2025|Gabbie Rhodes|9 min
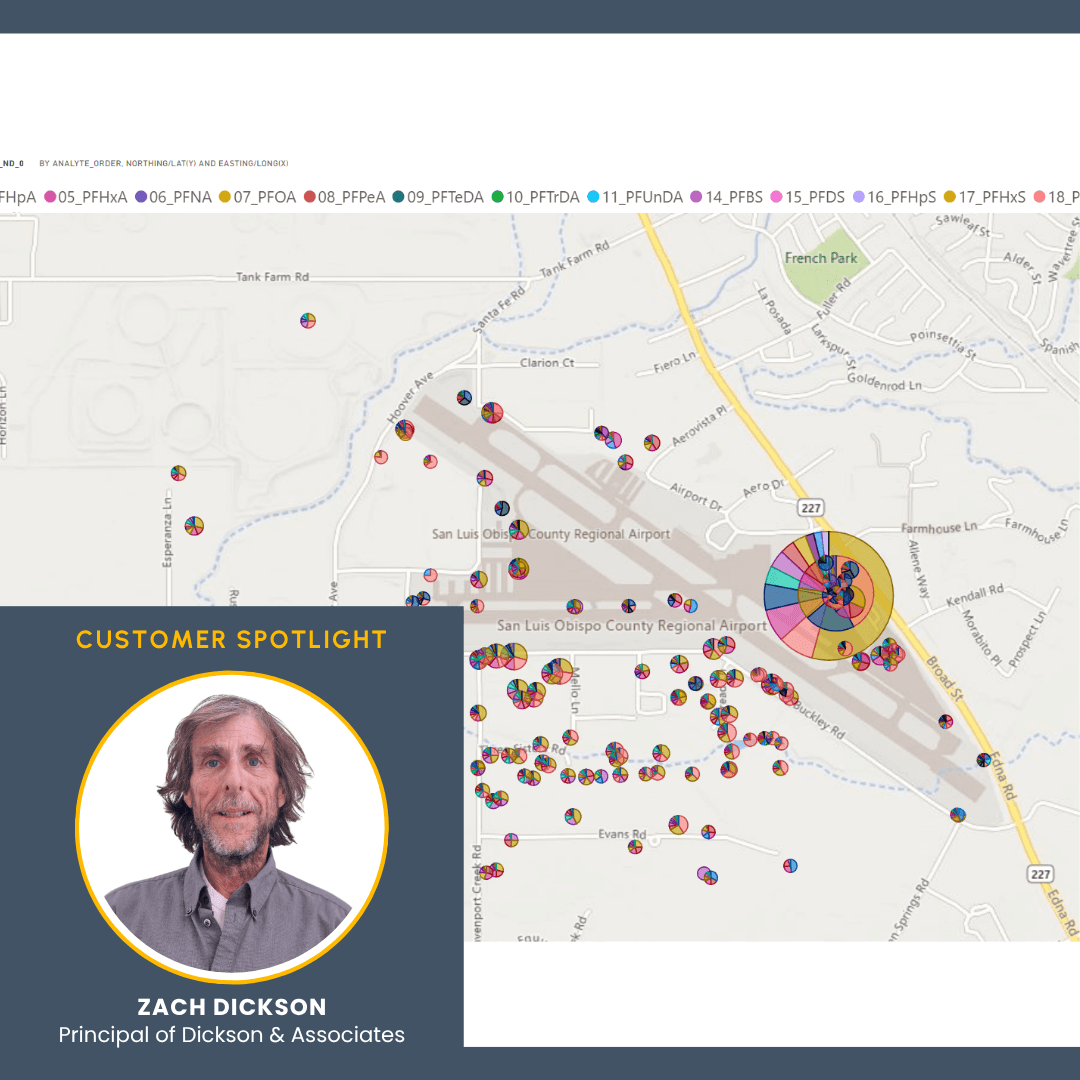
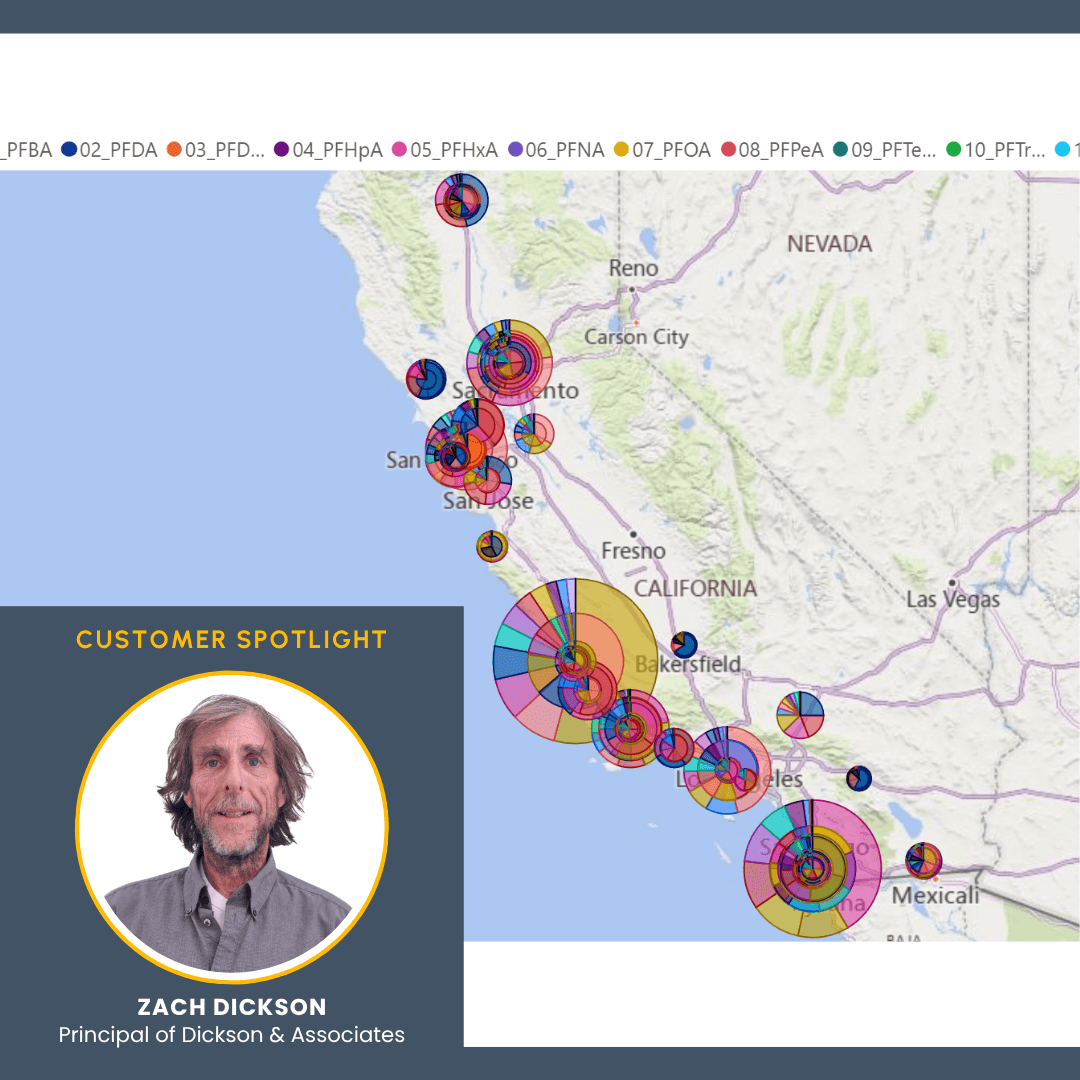
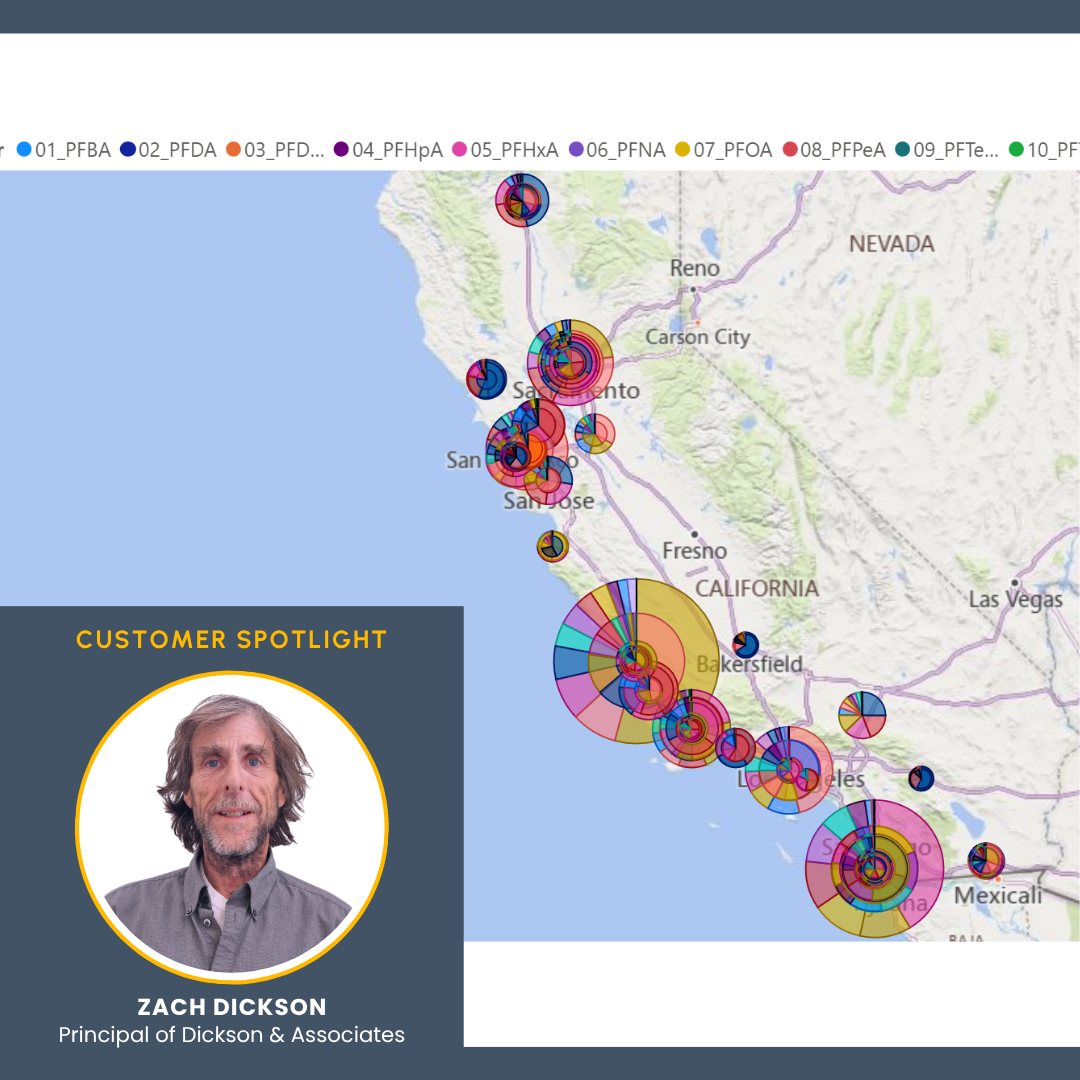
PFAS at California airports are an issue. But how can researchers and the public truly understand the problem? A PFAS model can help.
- Jun 17, 2025|Gabbie Rhodes|8 min
PFAS is a growing concern in California. However, to better understand the situation, Zach Dickson created a model showing PFAS in California.
- Jun 17, 2025|Gabbie Rhodes|8 min
We take your feedback seriously, which is why we don't just collect it - we also have a process for using it to continuously improve our products.
- Jun 10, 2025|Gabbie Rhodes|6 min
As the professor at FGCU's limnology class, Dr. Serge Thomas gives students the tools and practical experience they need to excel. Learn more.
- Jun 10, 2025|Gabbie Rhodes|6 min
PFAS is a growing concern in Colorado. However, to better understand the situation, an model was created to visualize PFAS in Colorado.
- Jun 3, 2025|Gabbie Rhodes|9 min
It's typical to sift through vast datasets to uncover and visualize insights, but you can save time and deliver better work by filtering data in Grapher.
- Jun 3, 2025|Gabbie Rhodes|8 min
PFAS is an increasingly urgent problem in the U.S., but sometimes, it's hard to understand its impact. Fortunately, new interactive models can help.