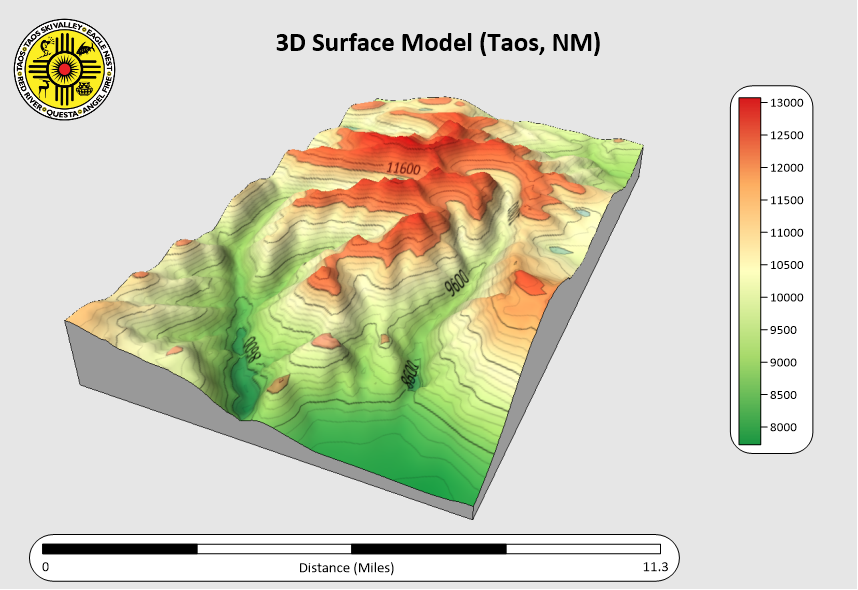
- Jun 20, 2024|Jake Stachewicz|3 min
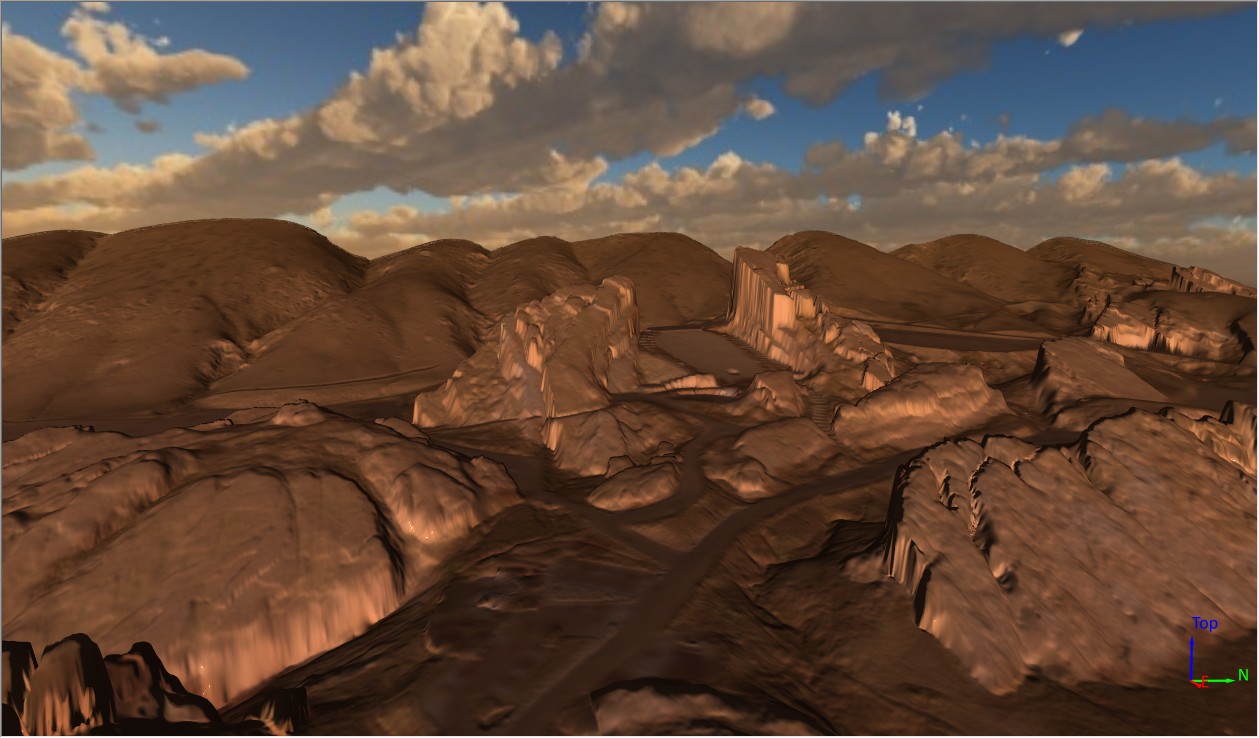
Learn where to park in Red Rocks Amphitheater to avoid the longest walk and vertical incline according to a map and trail profiles created in Surfer.
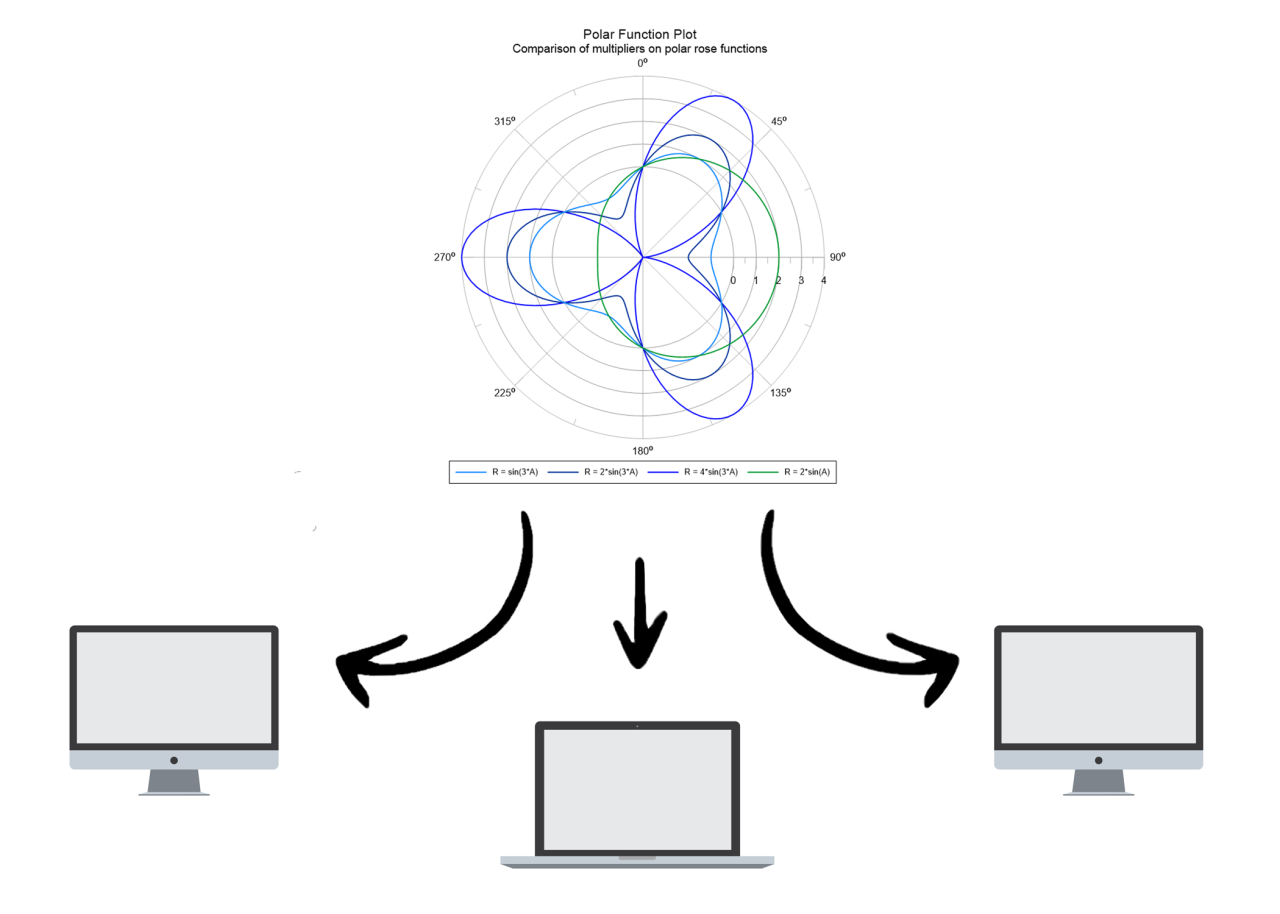
- Jun 13, 2024|Katie Yoder|6 min
Imagine transforming a sea of numbers and charts into a captivating visual story. That's the power of effective color mapping in data visualization.
- May 30, 2024|Katie Yoder|3 min
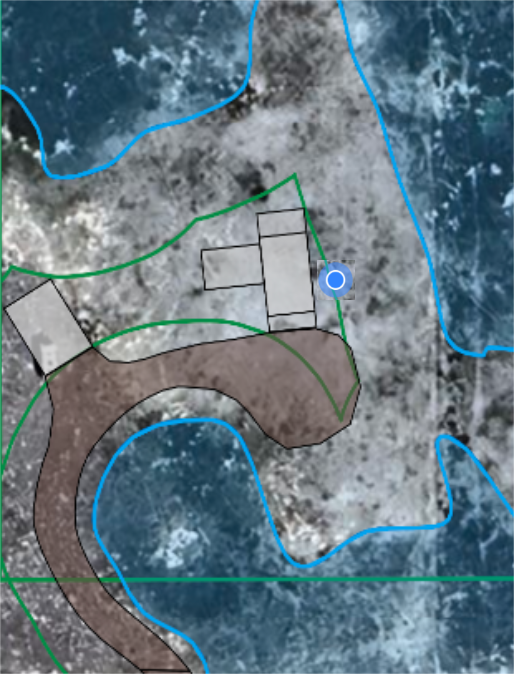
Use Google Earth and a KML version of your site map to see exactly where you are on the site, add points of interest, take photos, and add notes.
- May 23, 2024|Katie Yoder|2 min
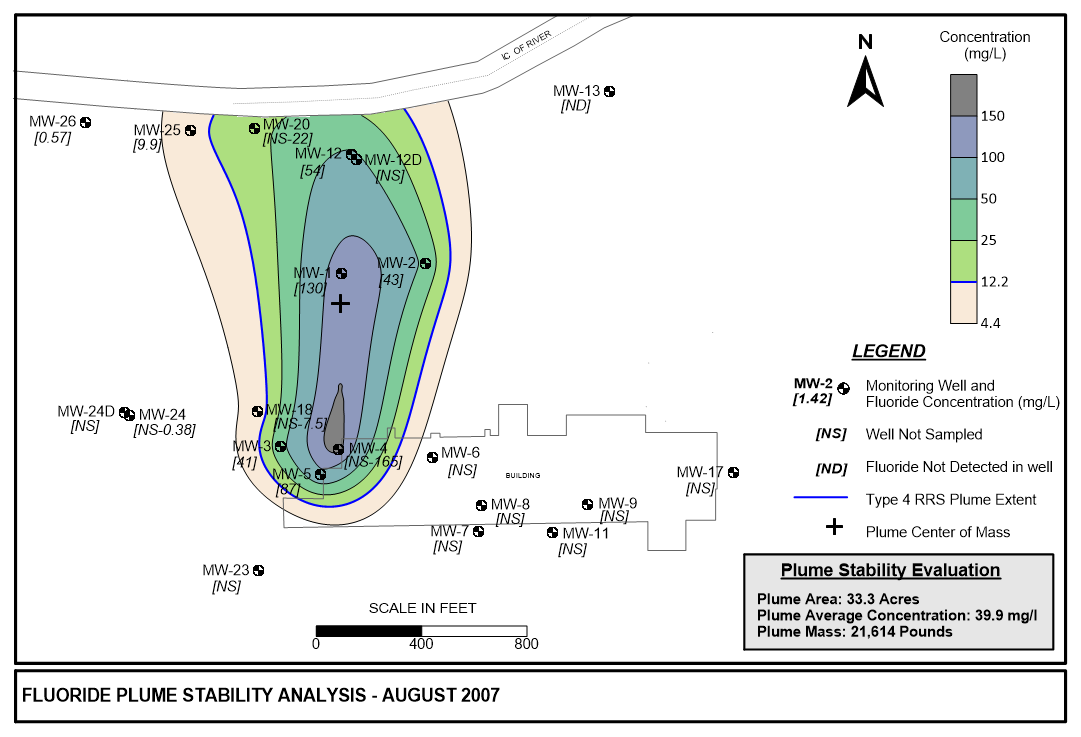
The Ricker Method for plume stability analysis helps engineers communicate meaningful patterns in environmental data
- Mar 22, 2024|Sena Secilmis|4 min
The latest Grapher release is engineered to enhance your workflows whether you’re a seasoned Grapher pro or a first time user.
- Feb 27, 2024|Katie Yoder|3 min
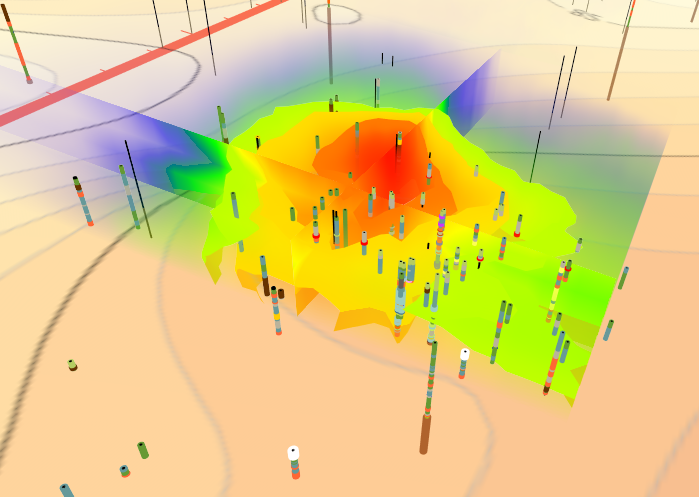
The latest version of Surfer adds 3D modeling functionality that include dynamic visualization tools and improved export and collaboration options.
- Feb 9, 2024|Katie Yoder|3 min
Zach Dickson, principal hydrogeologist, recently shared how he uses Surfer to model his site characterization and forensic analysis data.
- Sep 14, 2023|Jake Stachewicz|3 min
The latest version of Surfer adds 3D modeling functionality that include dynamic visualization tools and improved export and collaboration options.
- Jun 23, 2023|Jake Stachewicz|5 min
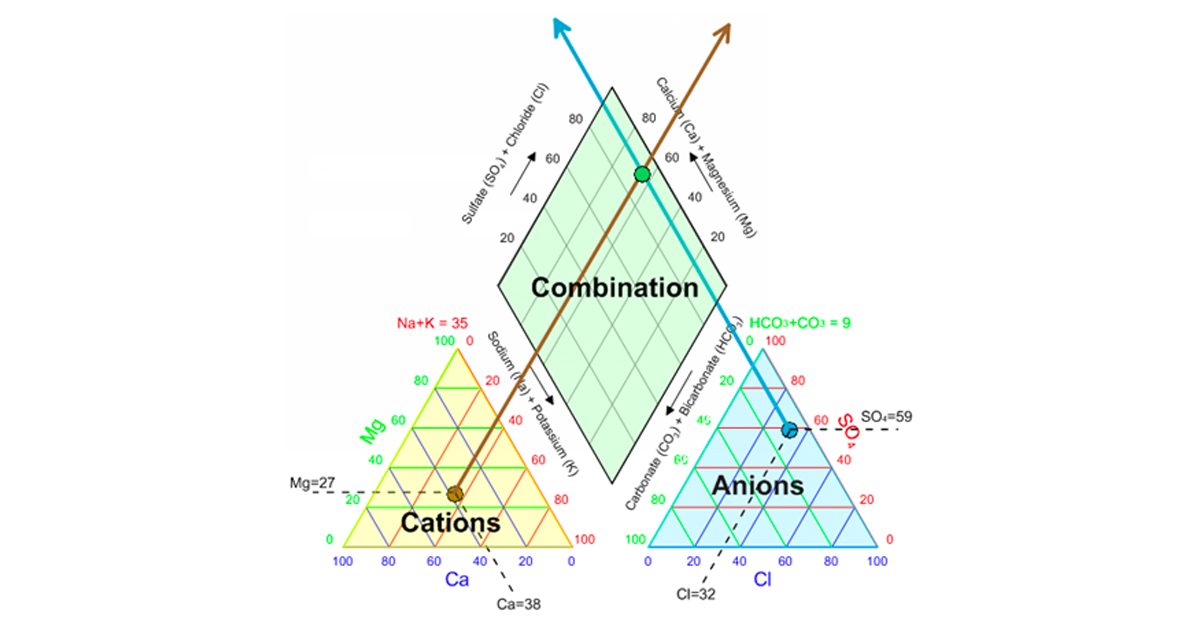
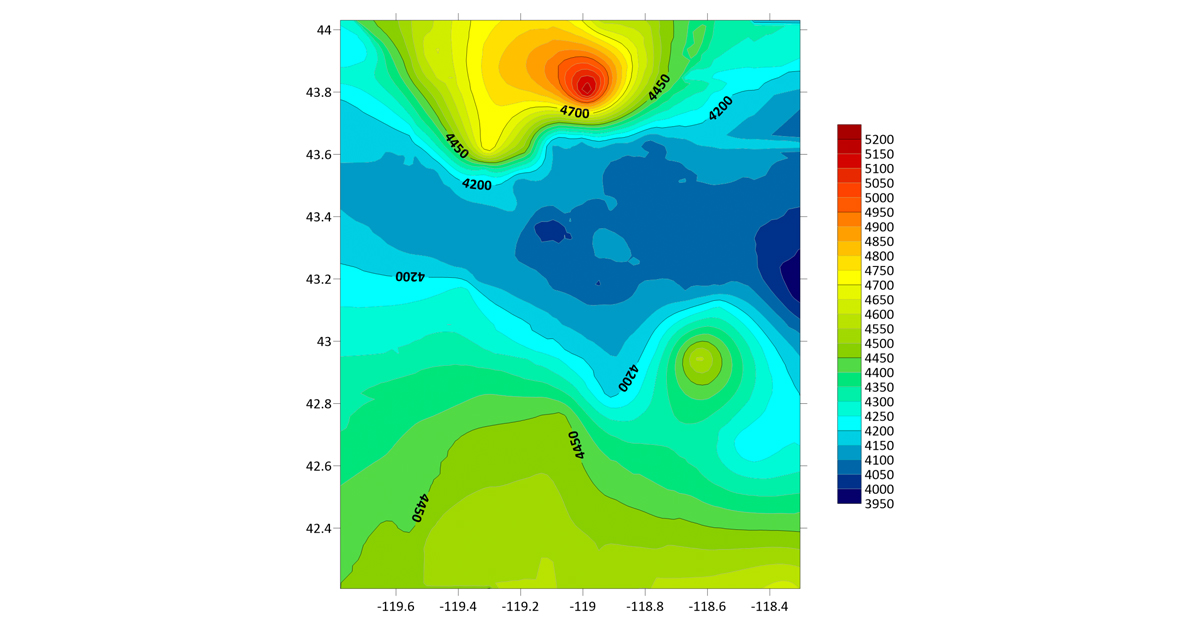
Being able to communicate water quality data is a key responsibility for hydrogeologists. This blog describes diagrams used to present water quality.
- Mar 29, 2023|Jake Stachewicz|3 min
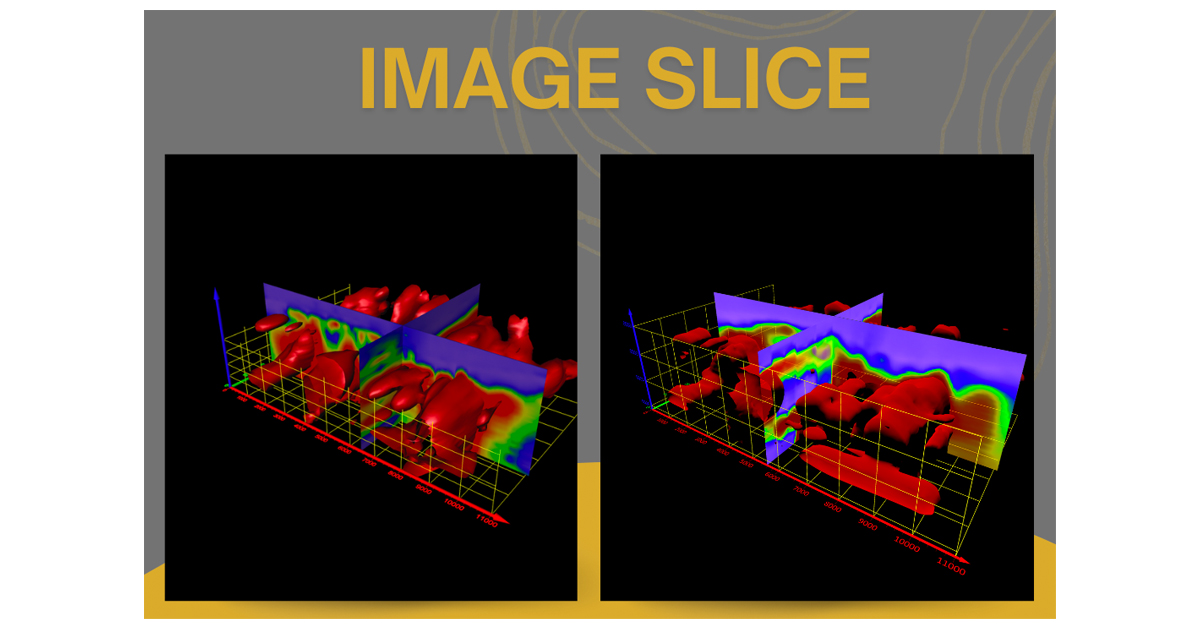
With Surfer any scientist or engineer can utilize powerful 3D modeling functionality to create the site models they need. Ultimately helping you reduce you software toolkit and create 3D models that leave a lasting impression on clients.
- Mar 14, 2023|Jake Stachewicz|3 min
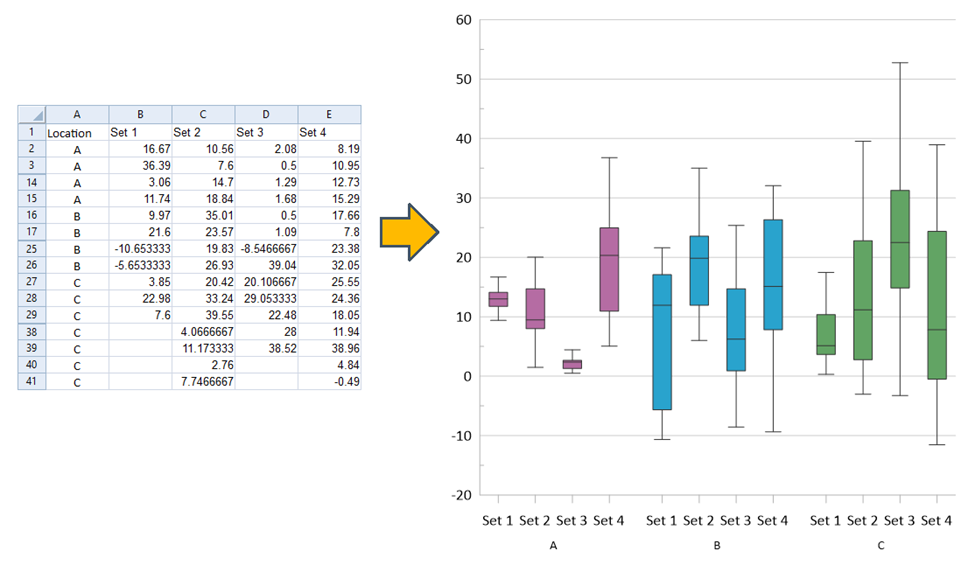
A new Grapher release is here! This update contains features aimed to help you communicate your data more intuitively.
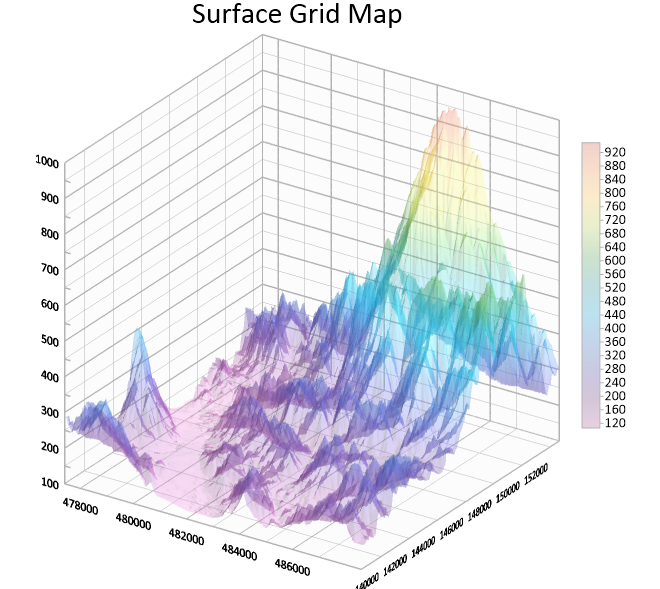
- Feb 14, 2023|Jake Stachewicz|6 min
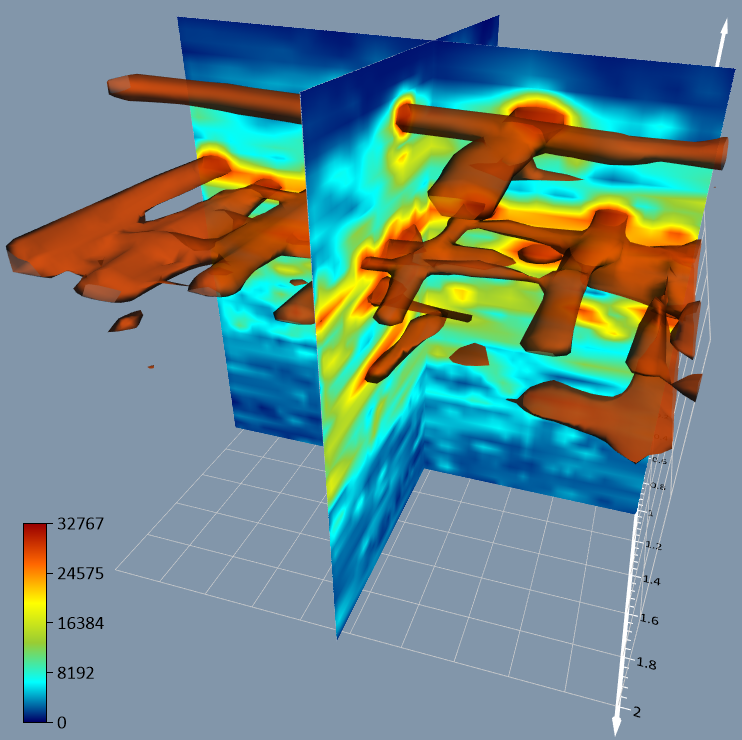
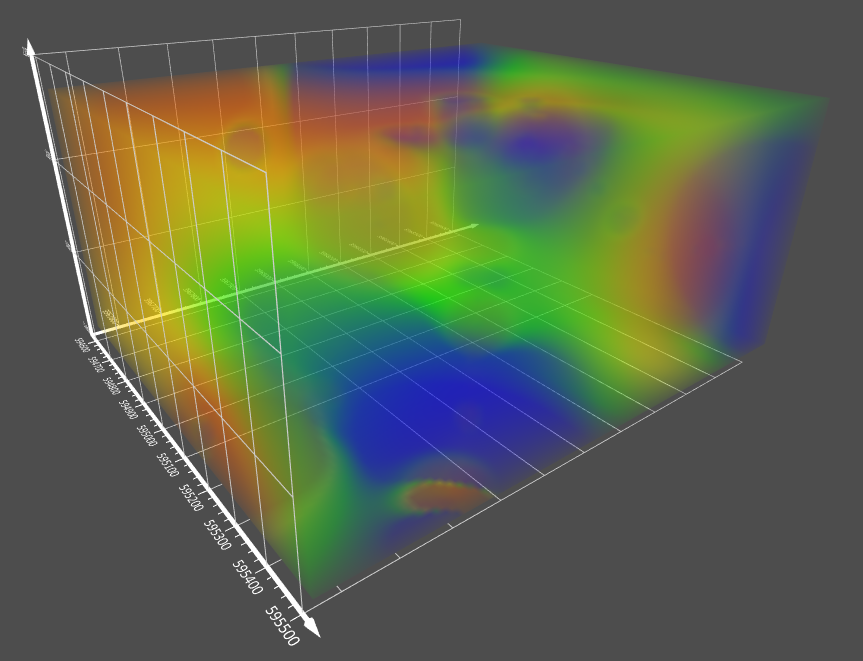
A new version of Surfer is here with highly anticipated 3D gridding features. With 3D gridding you can interpolate and map XYZC data.
- Jan 3, 2023|Jake Stachewicz|4 min
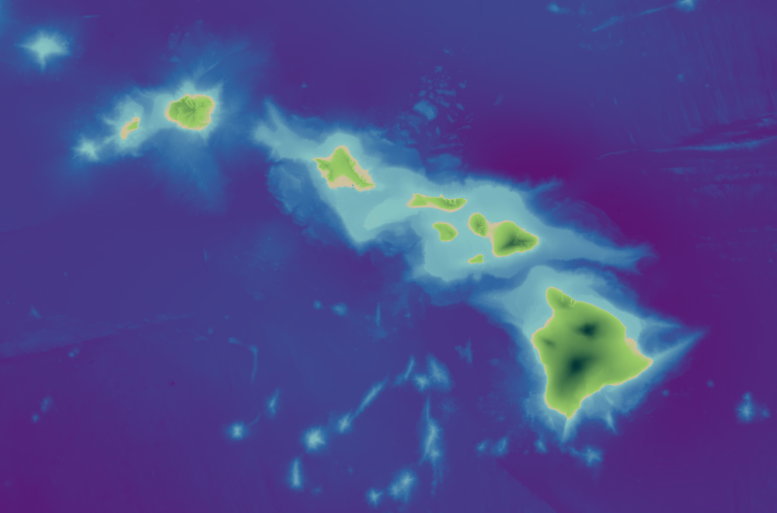
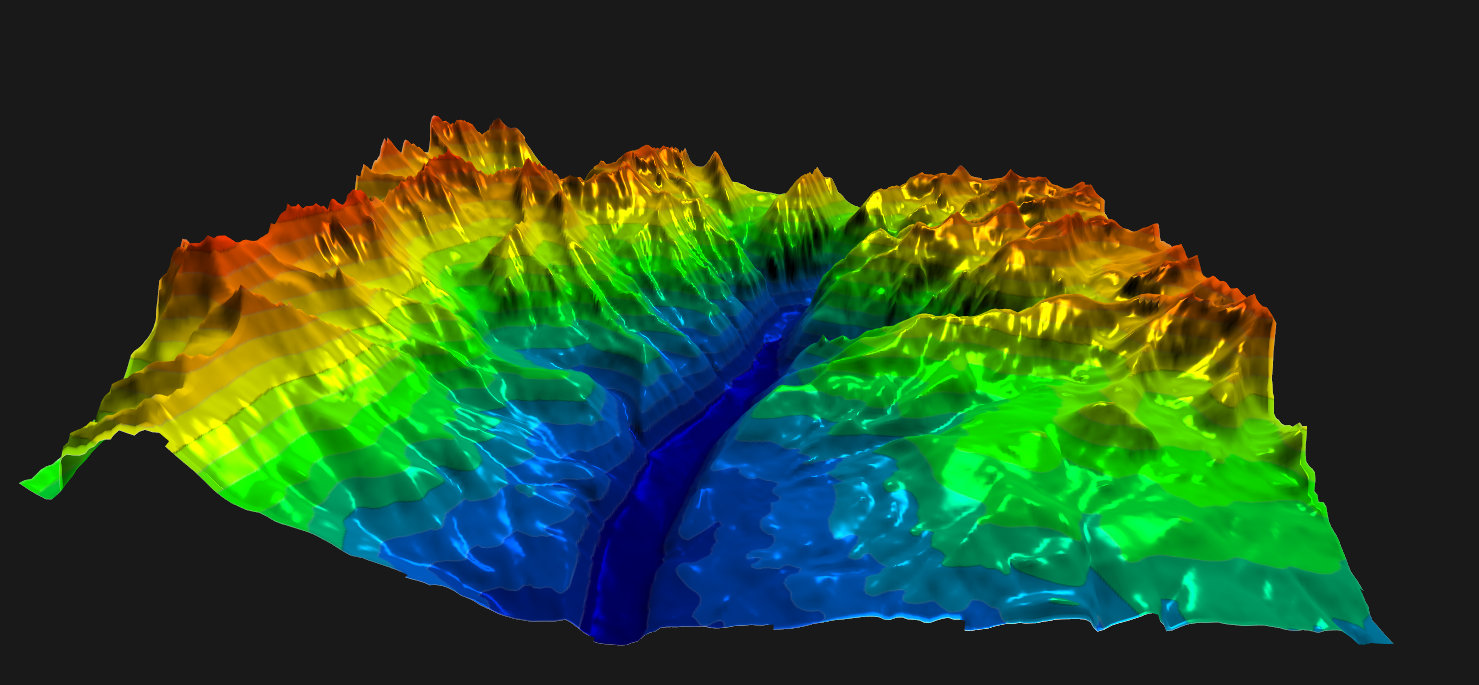
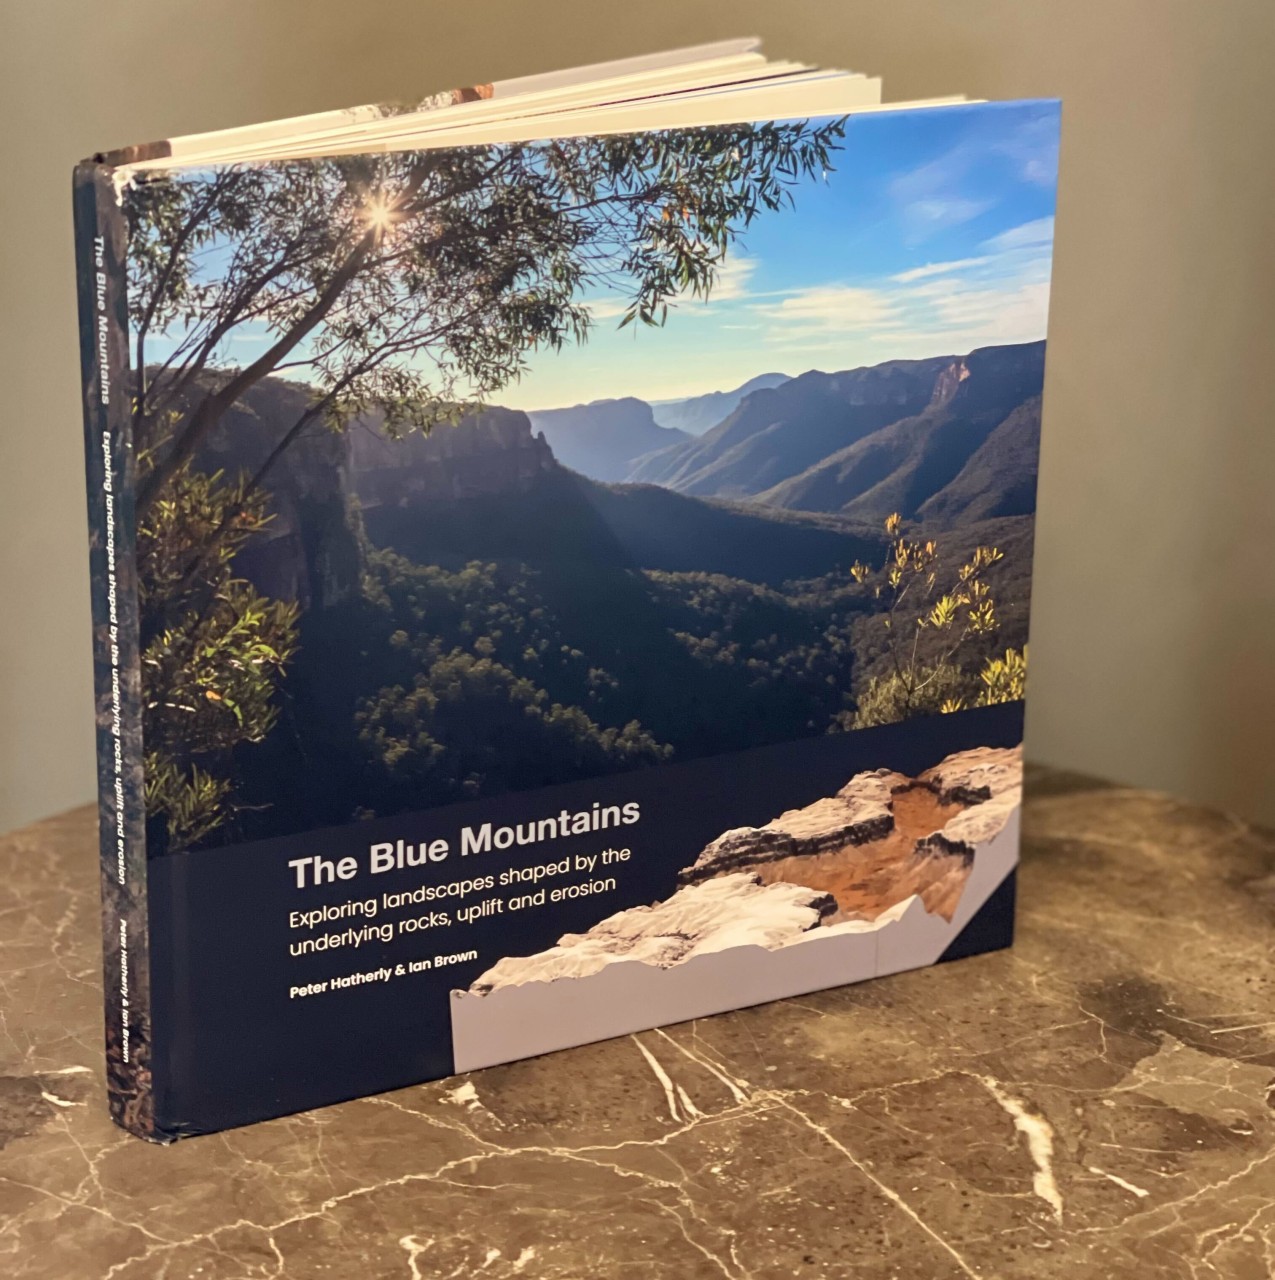
A geophysicist used Surfer to create multiple visualizations for his guidebook on the geology and history of the Blue Mountains in Australia.
- Sep 19, 2022|Jake Stachewicz|2 min
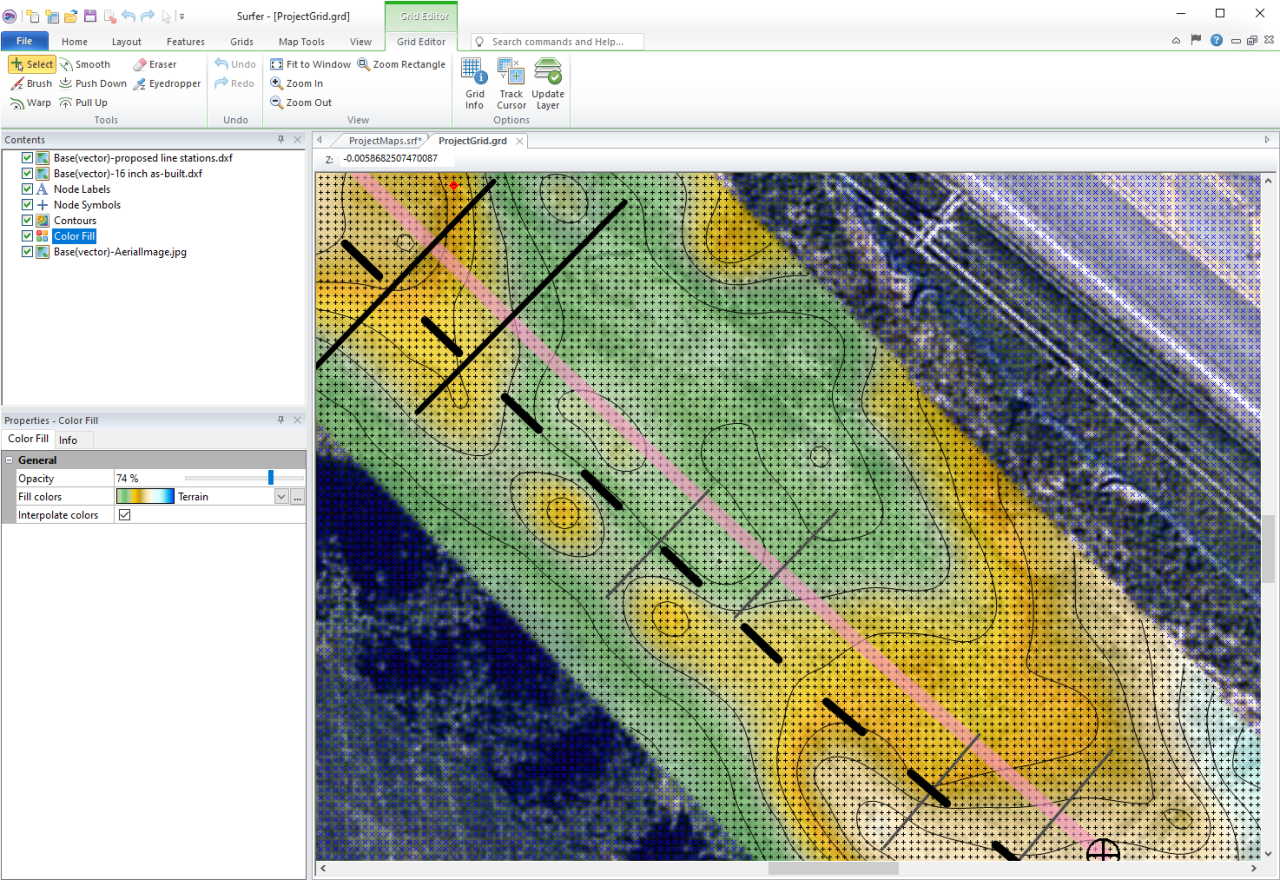
With the latest Surfer release there are exciting new display options to help you better tell the story of your data.
- Feb 22, 2022|Jake Stachewicz|7 min
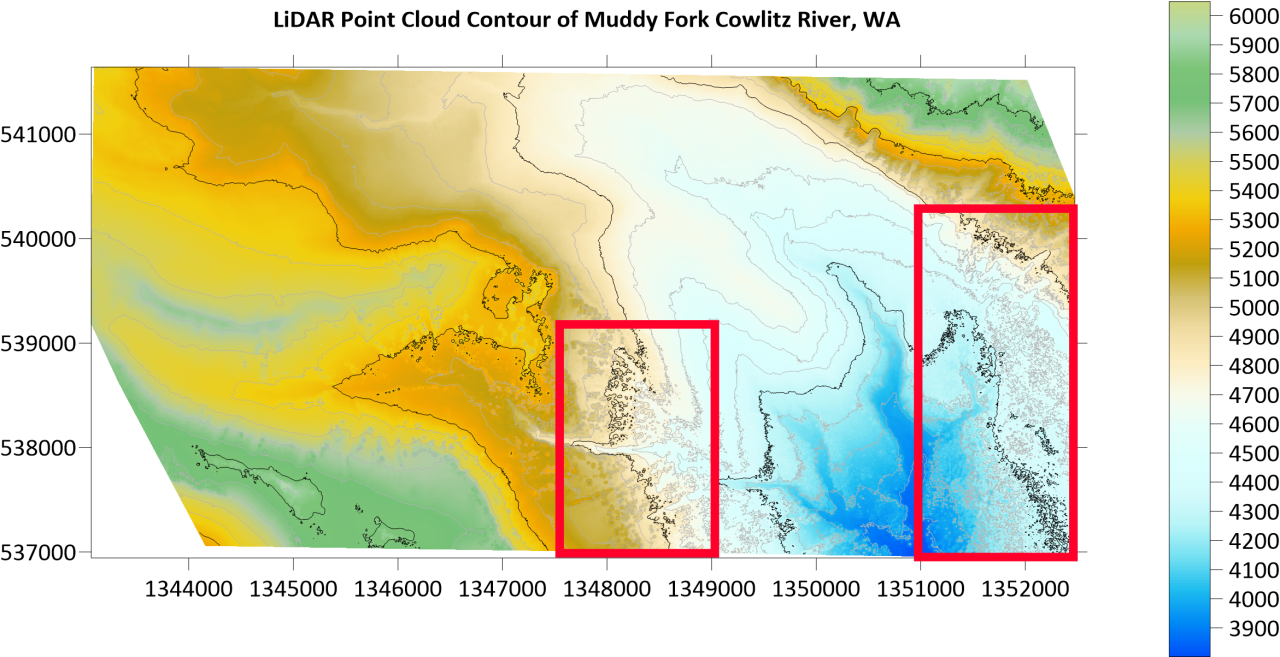
As LiDAR data continues to become more prevalent you need to know the methods to reduce a common headache, LiDAR noise.
- Jan 17, 2022|Jake Stachewicz|5 min
With the latest Surfer update there are several new features including exciting 3D customization options.
- Dec 13, 2021|Jake Stachewicz|3 min
When you are working with a team, collaboration is one of your greatest assets. This blog details how Golden Software can boost collaboration.
- Dec 13, 2021|Jake Stachewicz|3 min
The latest Grapher release contains features that will help you better filter and customize your data.