- Sep 26, 2024|Gabbie Rhodes|7 min
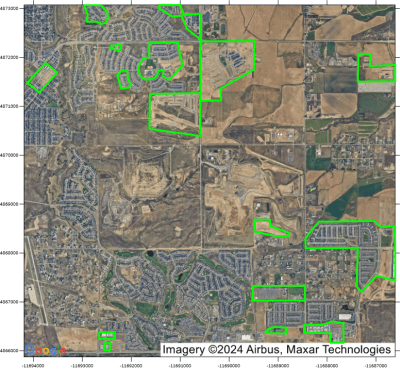
Satellite imagery can add context to your maps, but only when it's used properly. Execution matters. Learn when and how to use this asset.
- Sep 18, 2024|Gabbie Rhodes|7 min
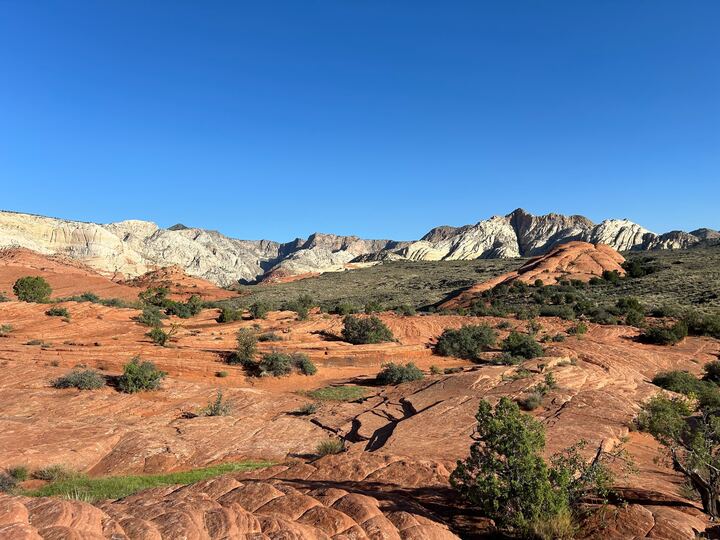
Zion National Park may be a renowned attraction in Utah, but Snow Canyon State Park is also worth seeing while in the state. It's full of wonders!
- Sep 10, 2024|Katie Yoder|5 min
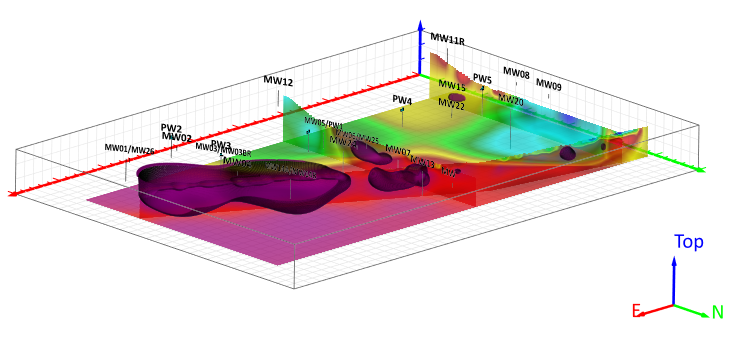
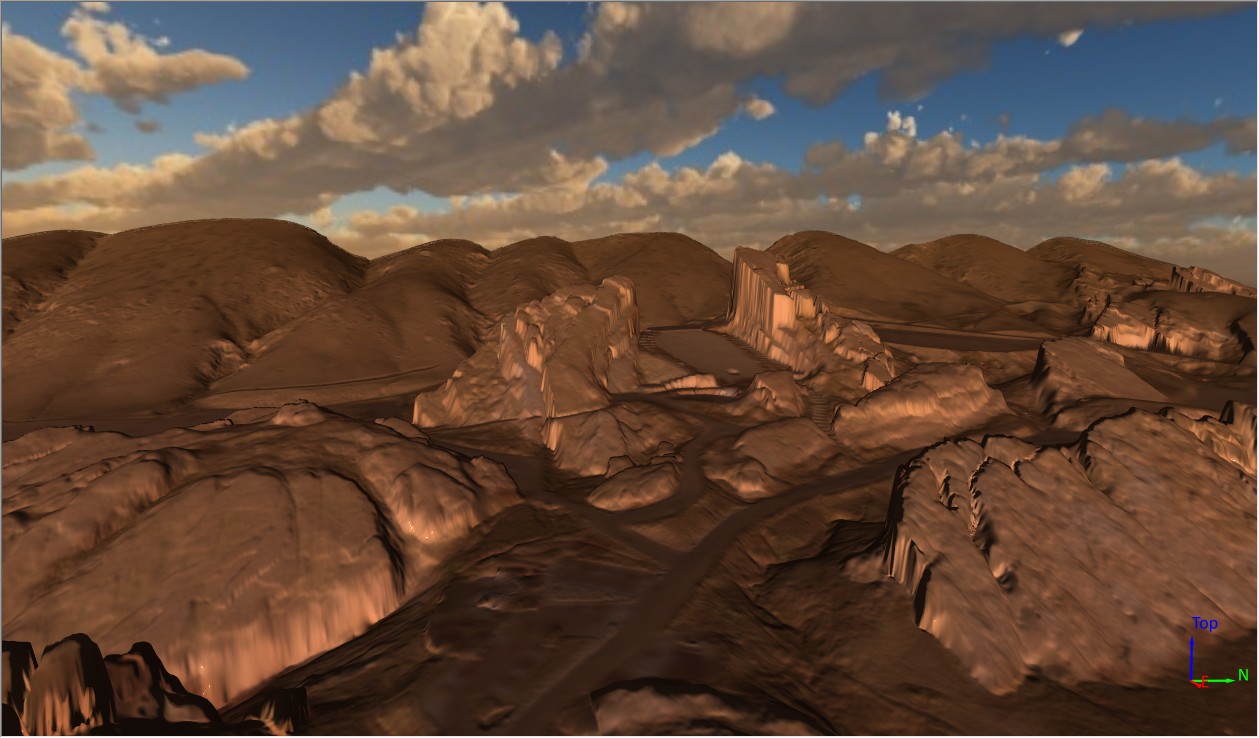
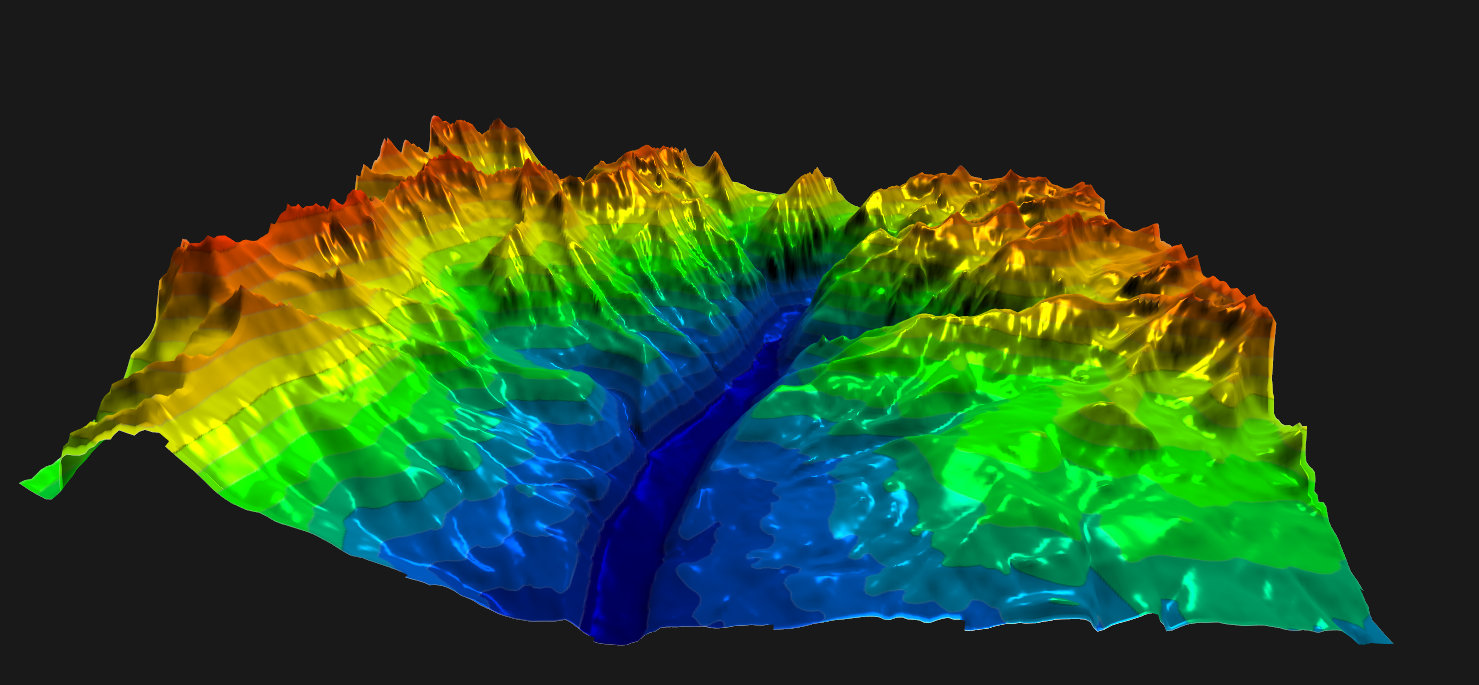
The latest version of Surfer adds 3D modeling functionality that include dynamic visualization tools and improved export and collaboration options.
- Sep 4, 2024|Katie Yoder|4 min
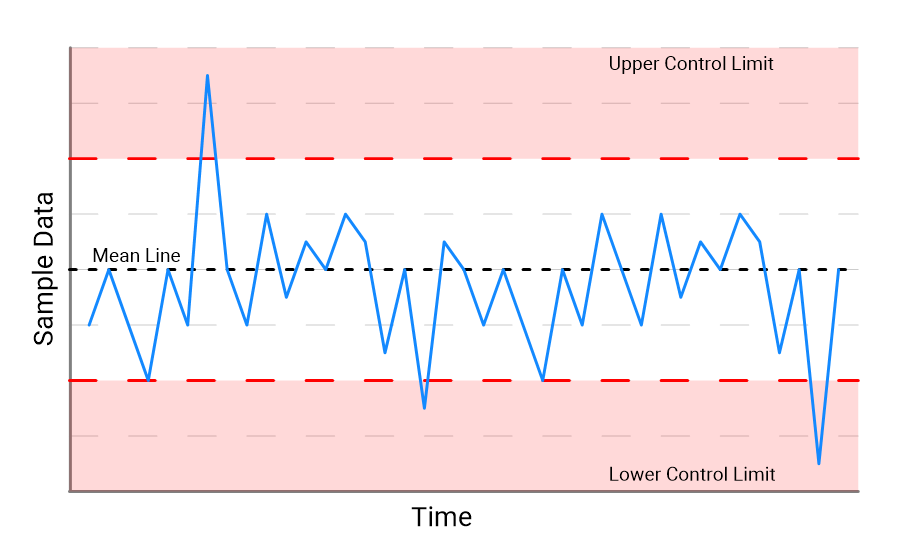
SPC charts are a powerful asset and are widely used across various industries for monitoring, controlling, and enhancing processes.
- Aug 29, 2024|Golden Software|6 min
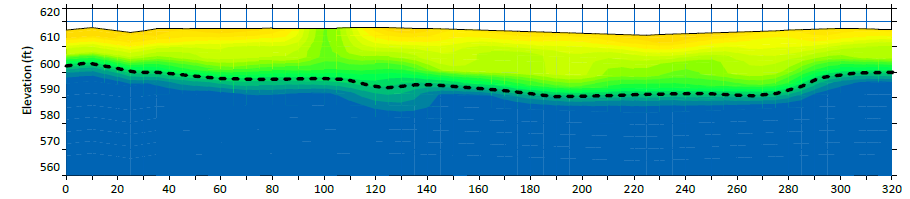
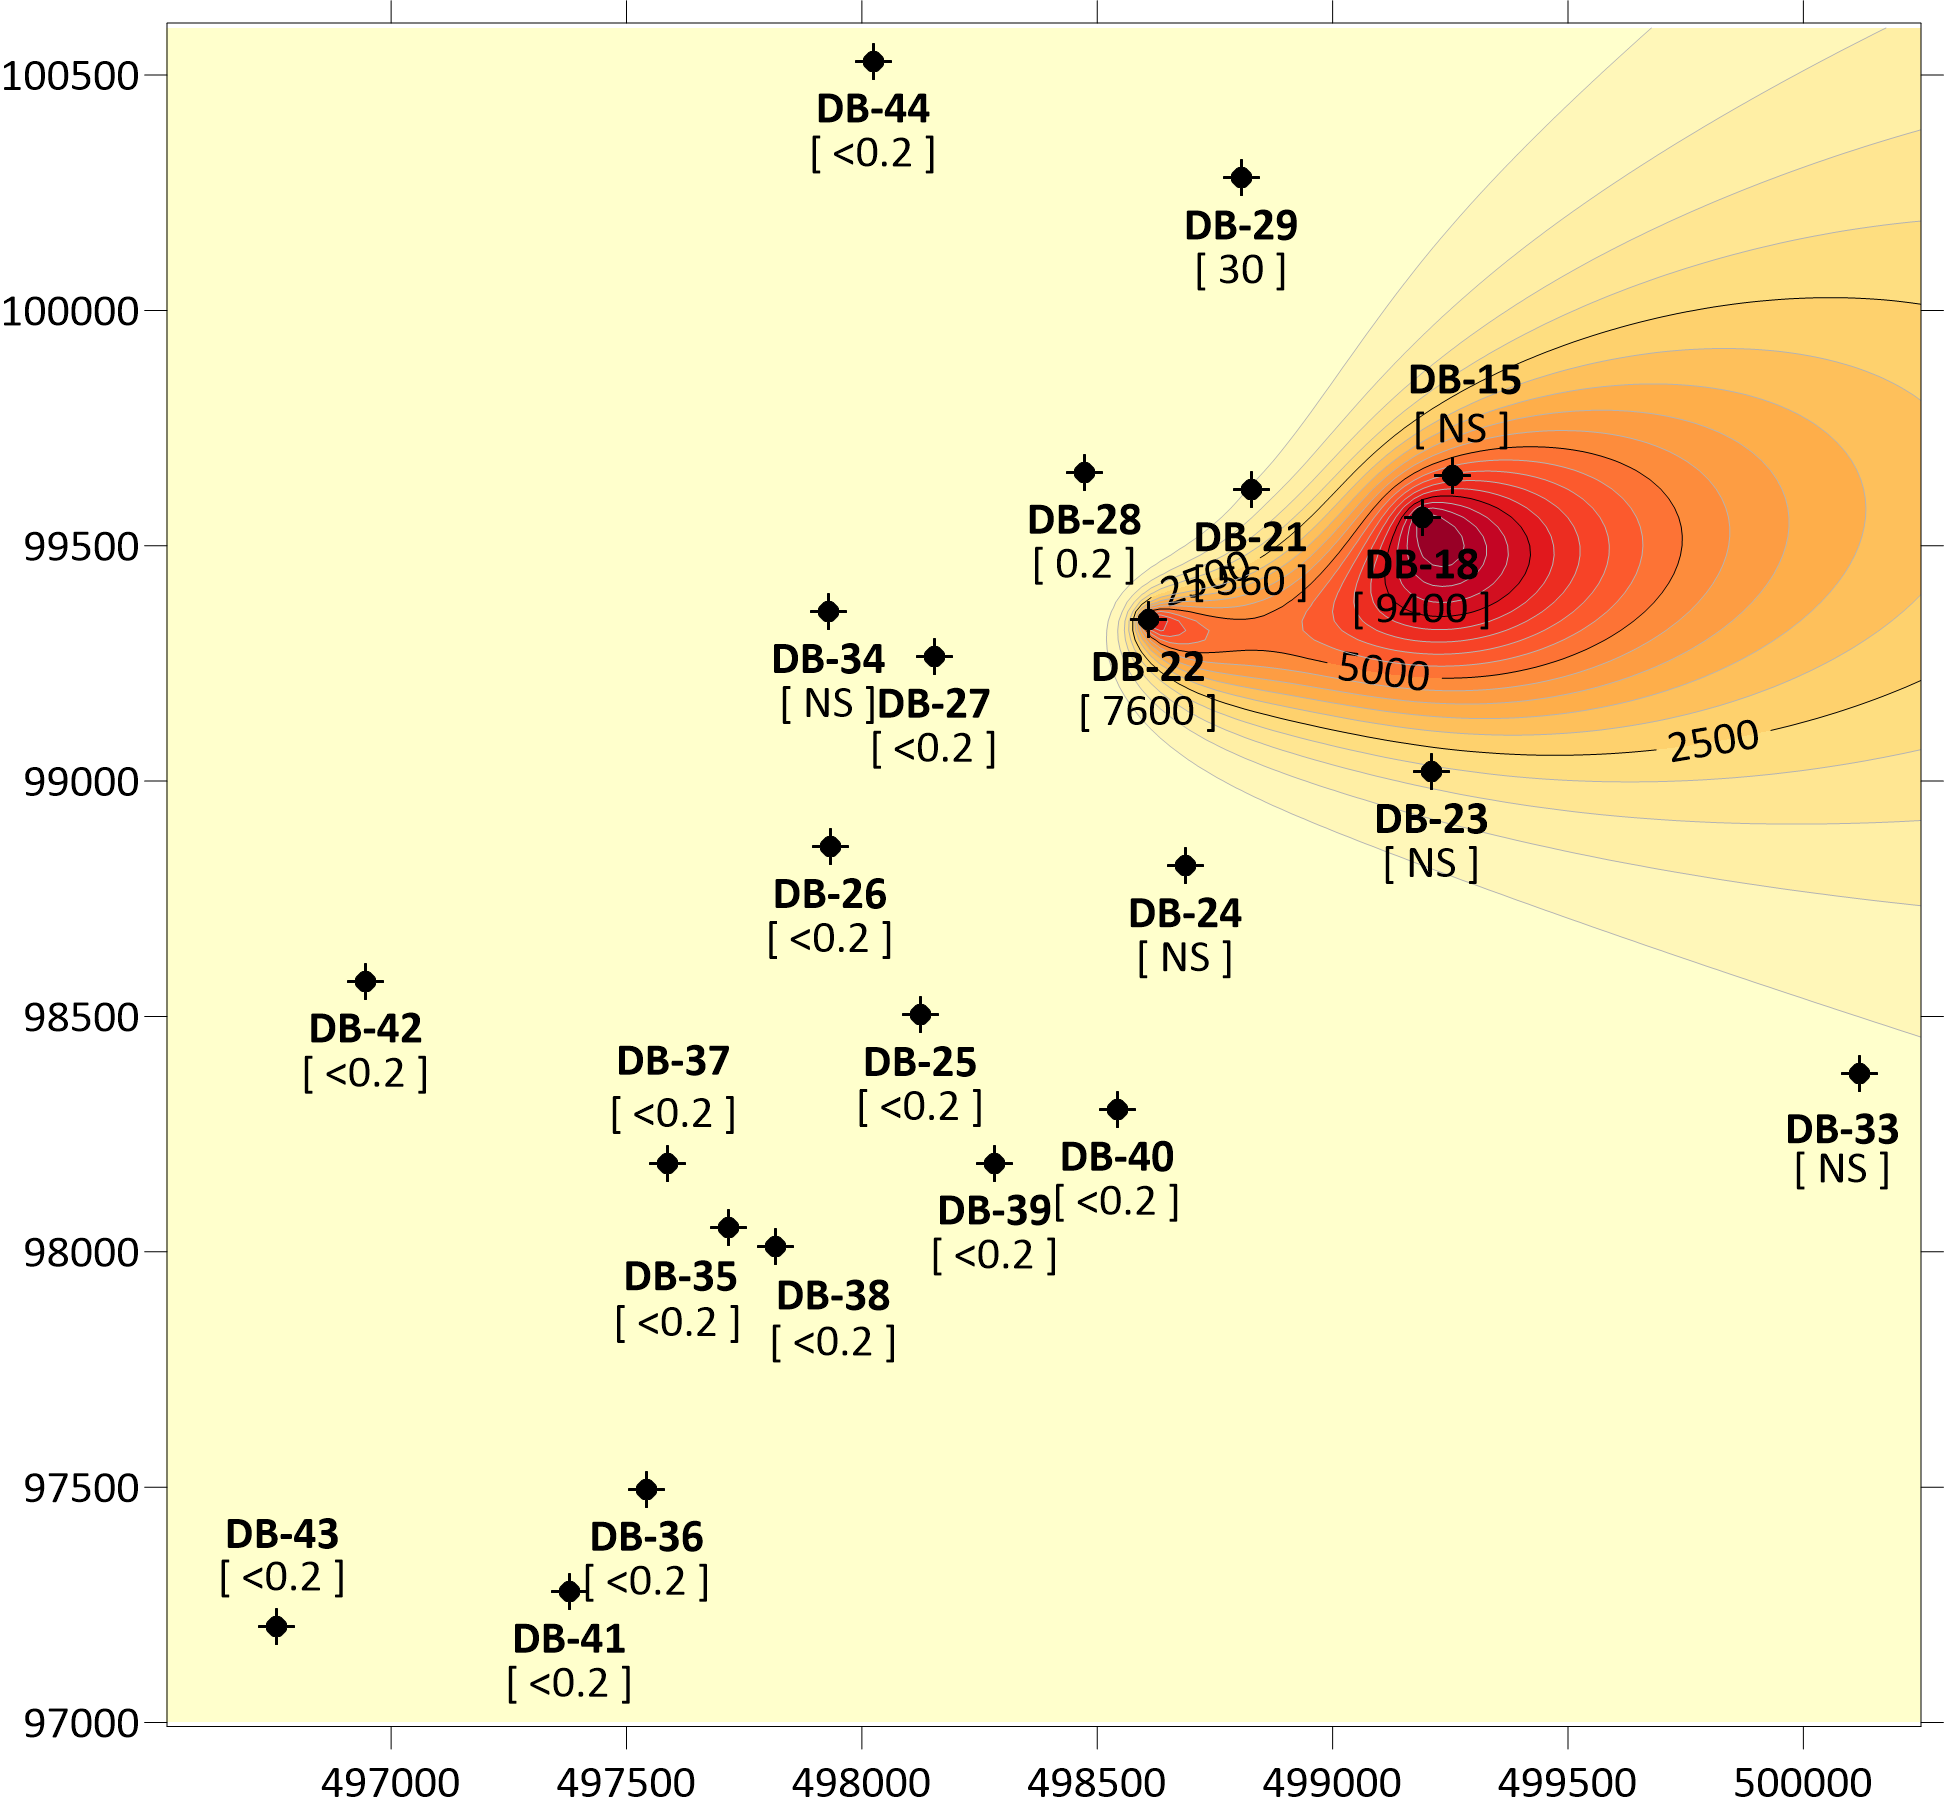
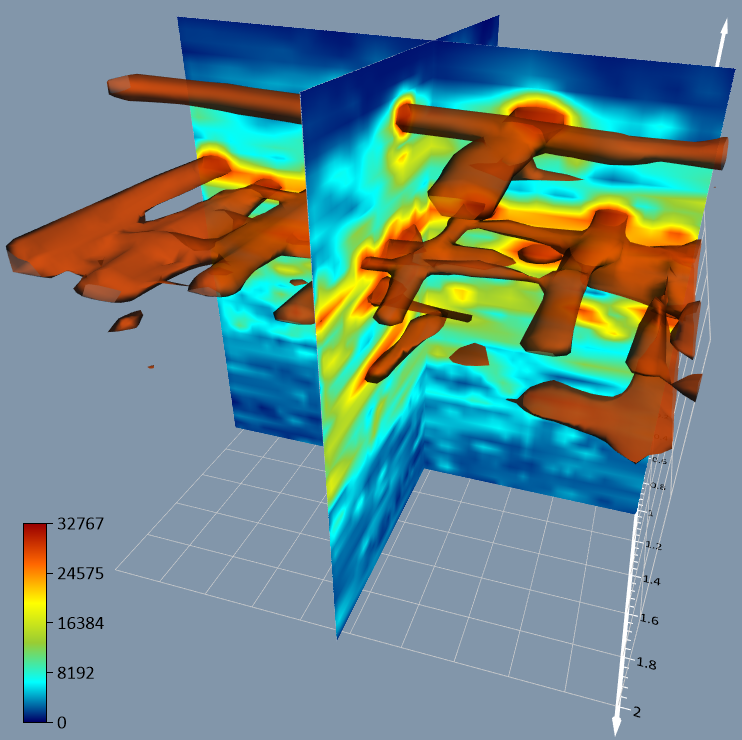
Gridding geophysical section data comes with some unique challenges that can be overcome by using these three best practices!
- Aug 21, 2024|Golden Software|3 min
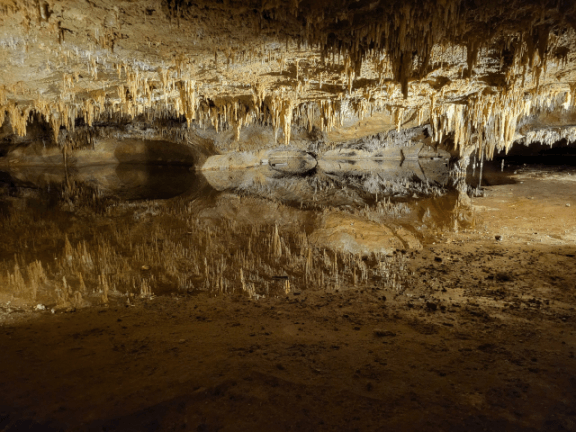
Get to know one of our team members and learn about the geology of Luray Caverns, one of many stunning sites you can explore with your family
- Aug 14, 2024|Golden Software|5 min
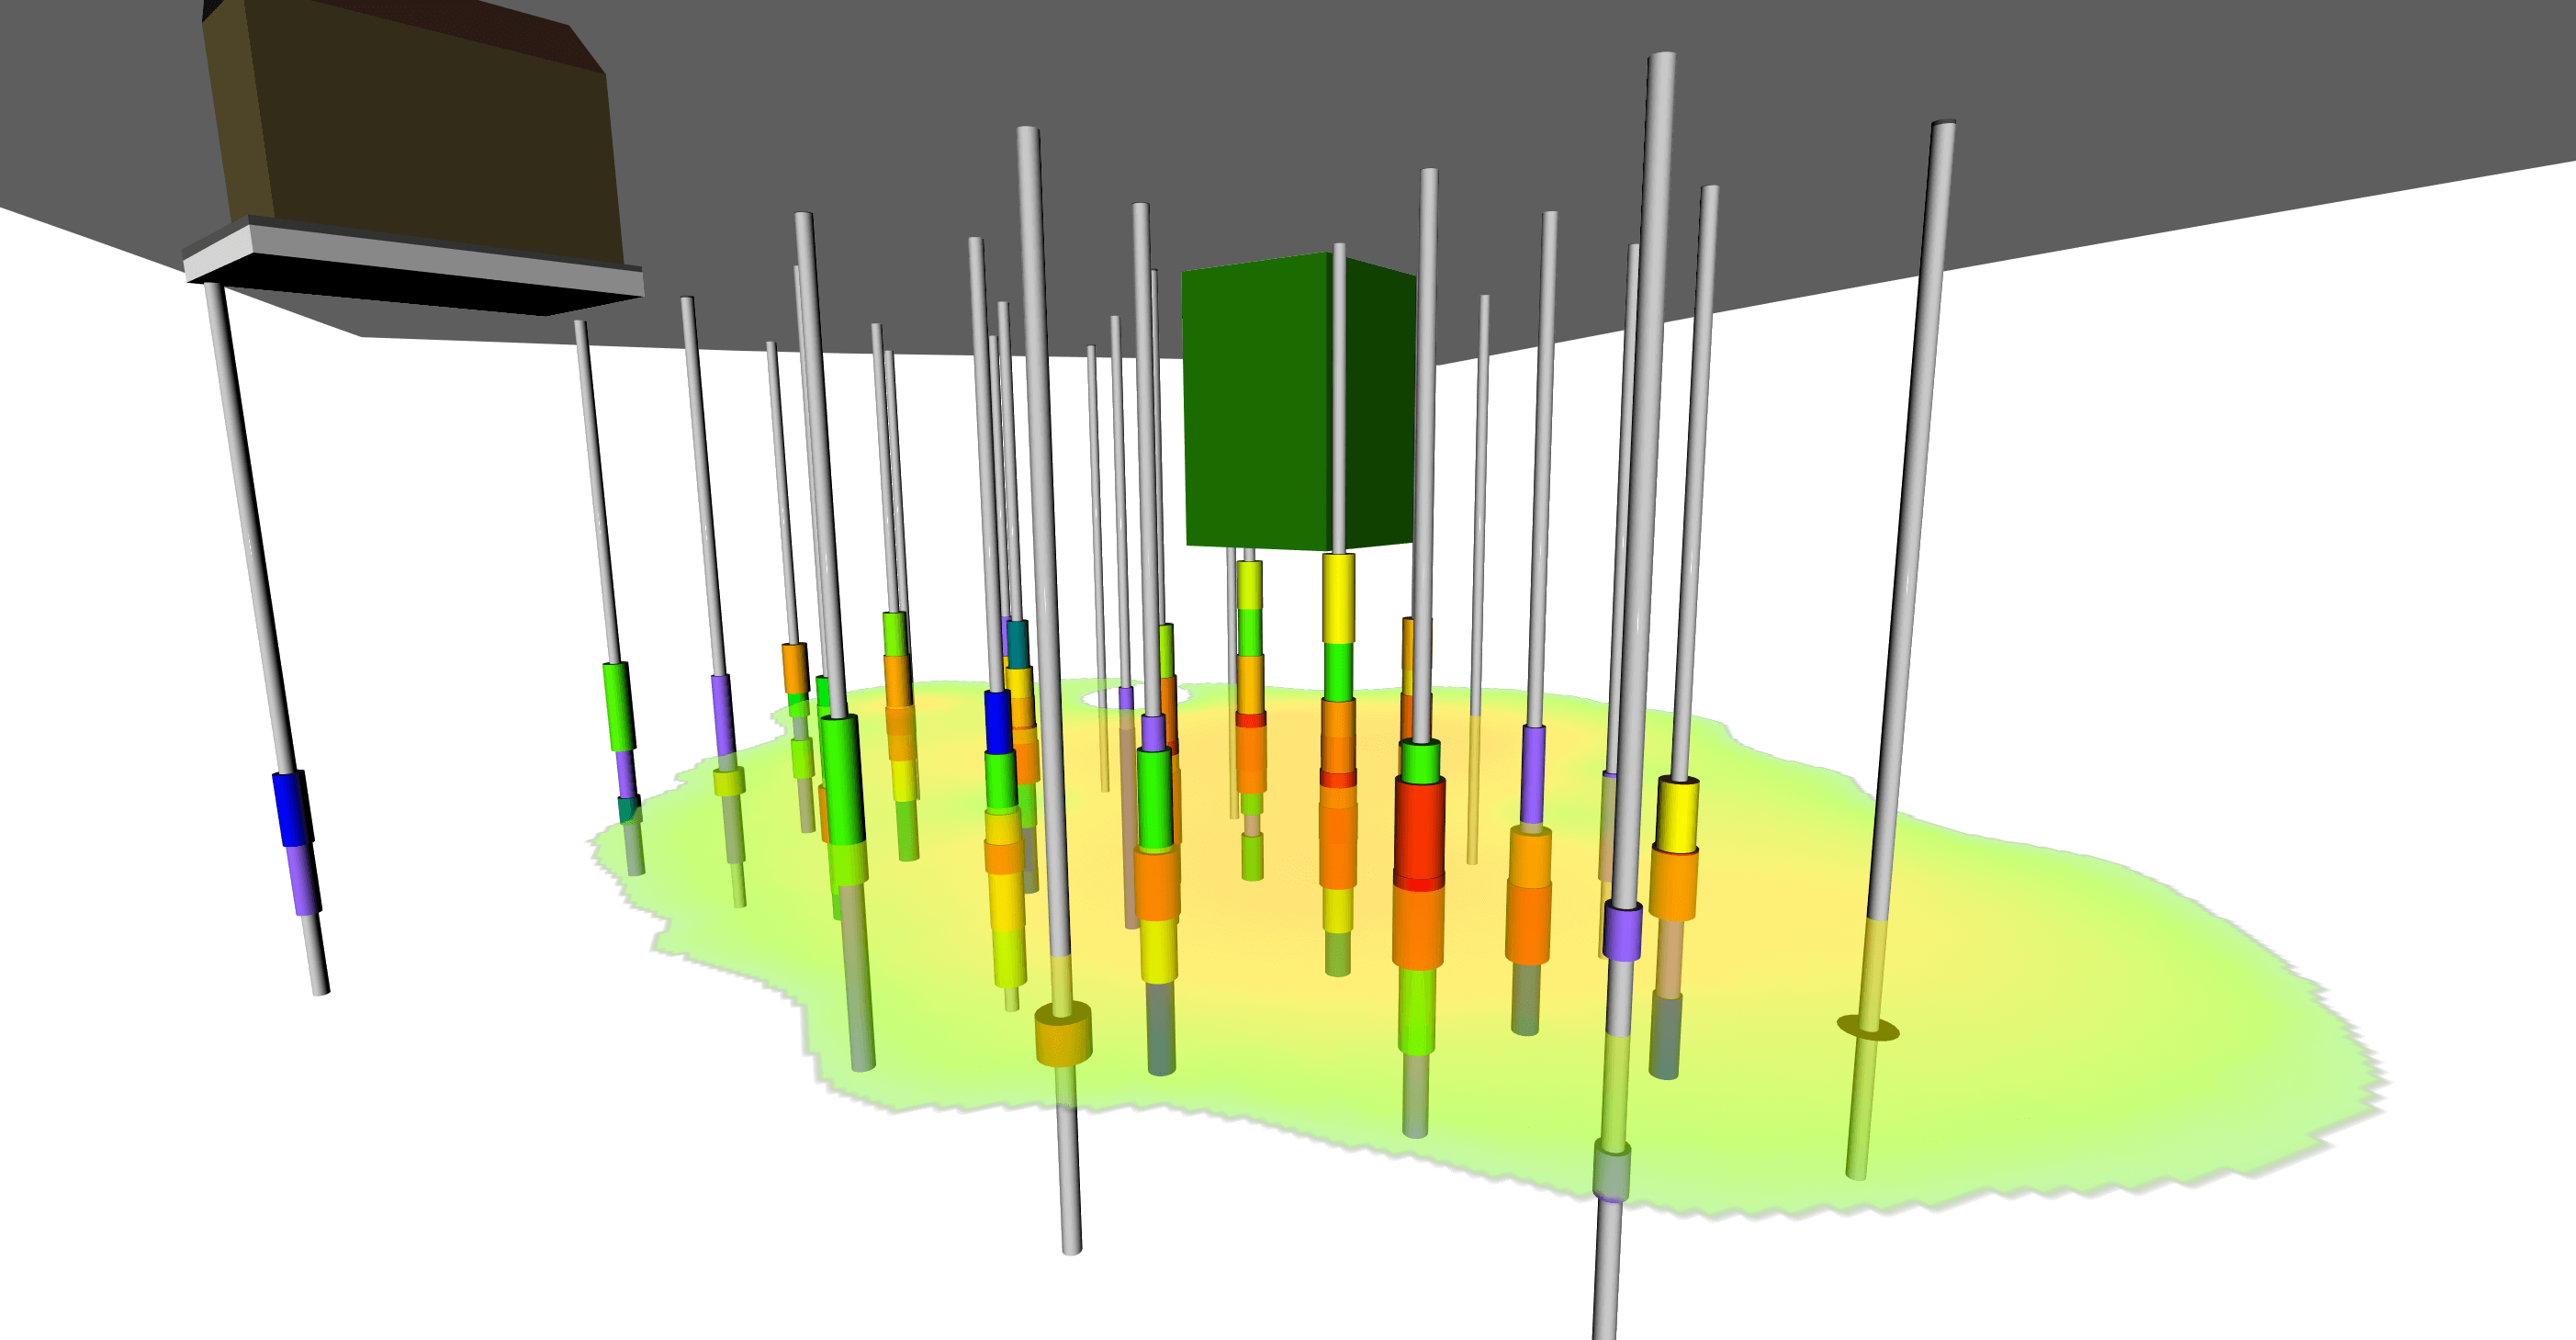
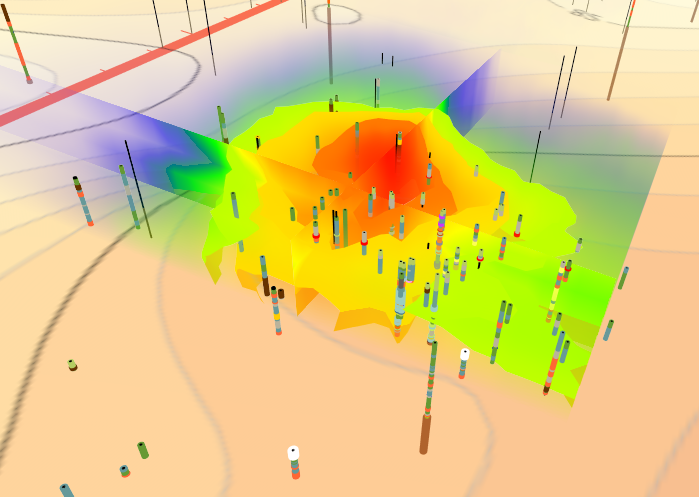
Gridding 3D drillhole data comes with some unique challenges that can be overcome by using these four best practices!
- Aug 1, 2024|Katie Yoder|4 min
Surfer and Grapher frame templates are designed to help you quickly create professional reports so you can spend more time doing what you love.
- Jul 25, 2024|Katie Yoder|7 min
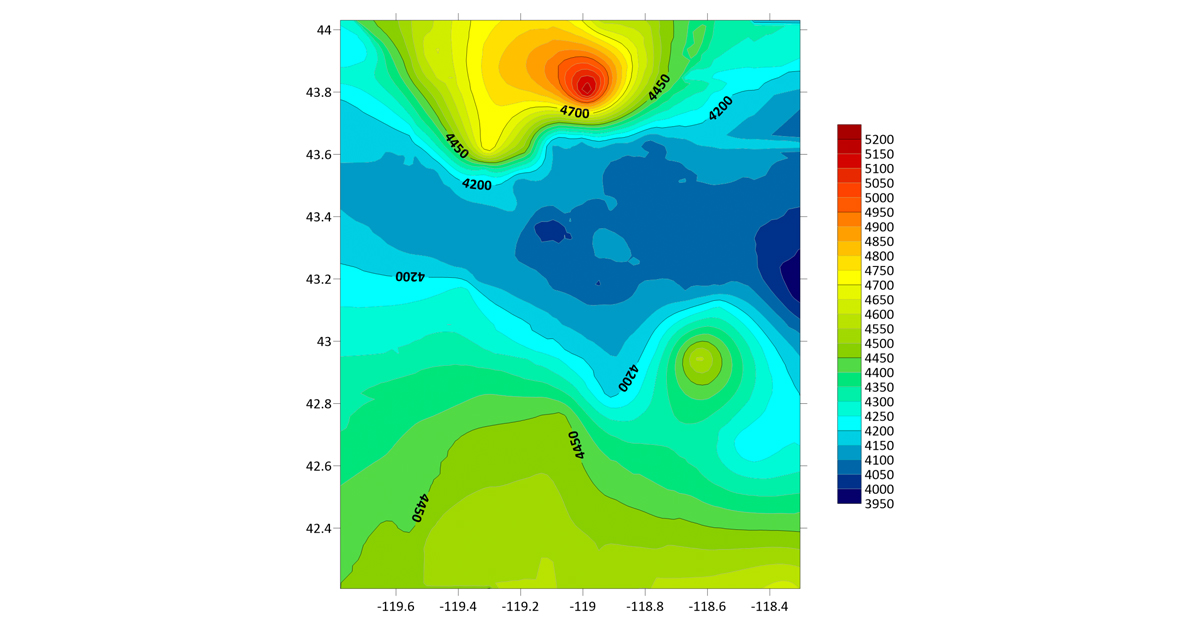
Gridding concentration data comes with some unique challenges that can be overcome by using these five best practices!
- Jul 17, 2024|Jessica Johnson|4 min
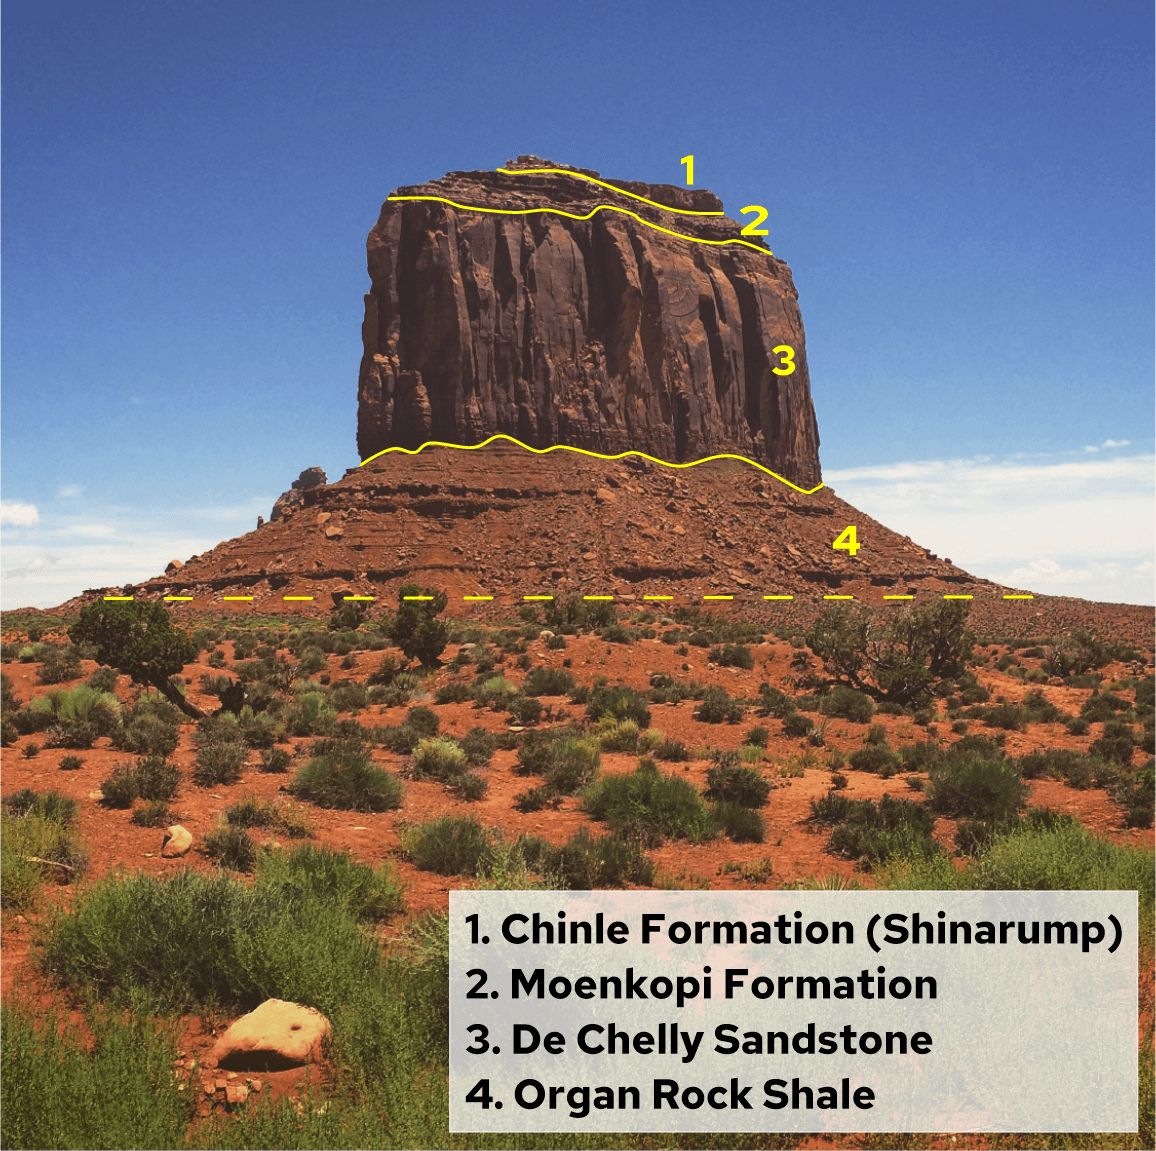
Get to know one of our team members and learn about the geology of Monument Valley, one of many stunning sites you can explore with your family
- Jun 20, 2024|Golden Software|3 min
Learn where to park in Red Rocks Amphitheater to avoid the longest walk and vertical incline according to a map and trail profiles created in Surfer.
- Jun 13, 2024|Katie Yoder|6 min
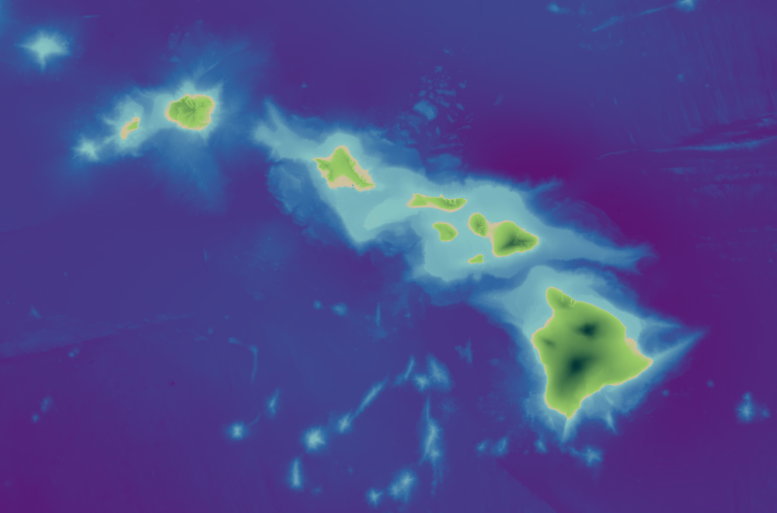
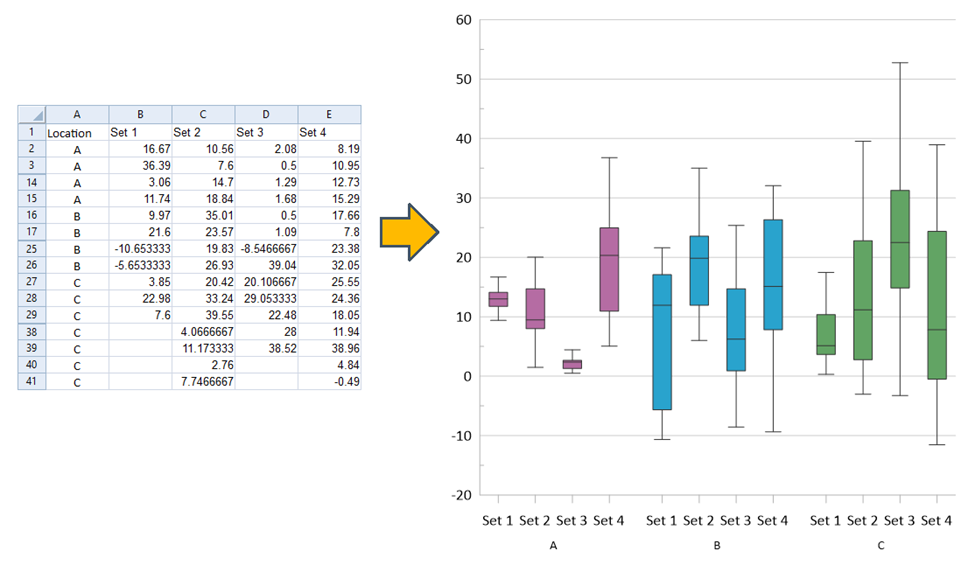
Imagine transforming a sea of numbers and charts into a captivating visual story. That's the power of effective color mapping in data visualization.
- May 30, 2024|Katie Yoder|3 min
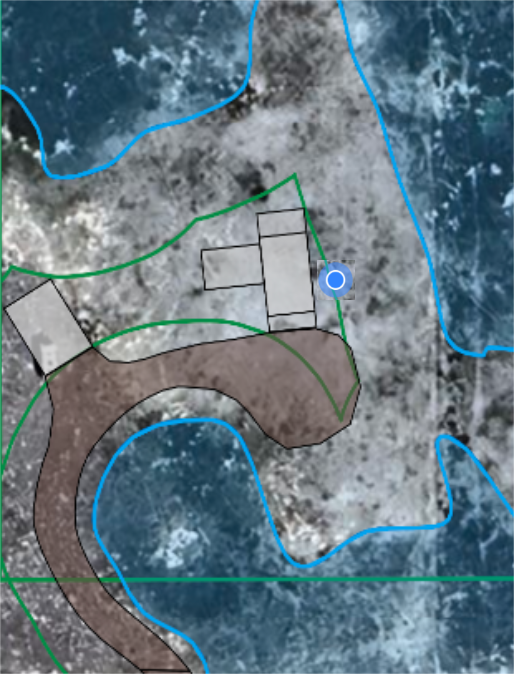
Use Google Earth and a KML version of your site map to see exactly where you are on the site, add points of interest, take photos, and add notes.
- May 23, 2024|Katie Yoder|2 min
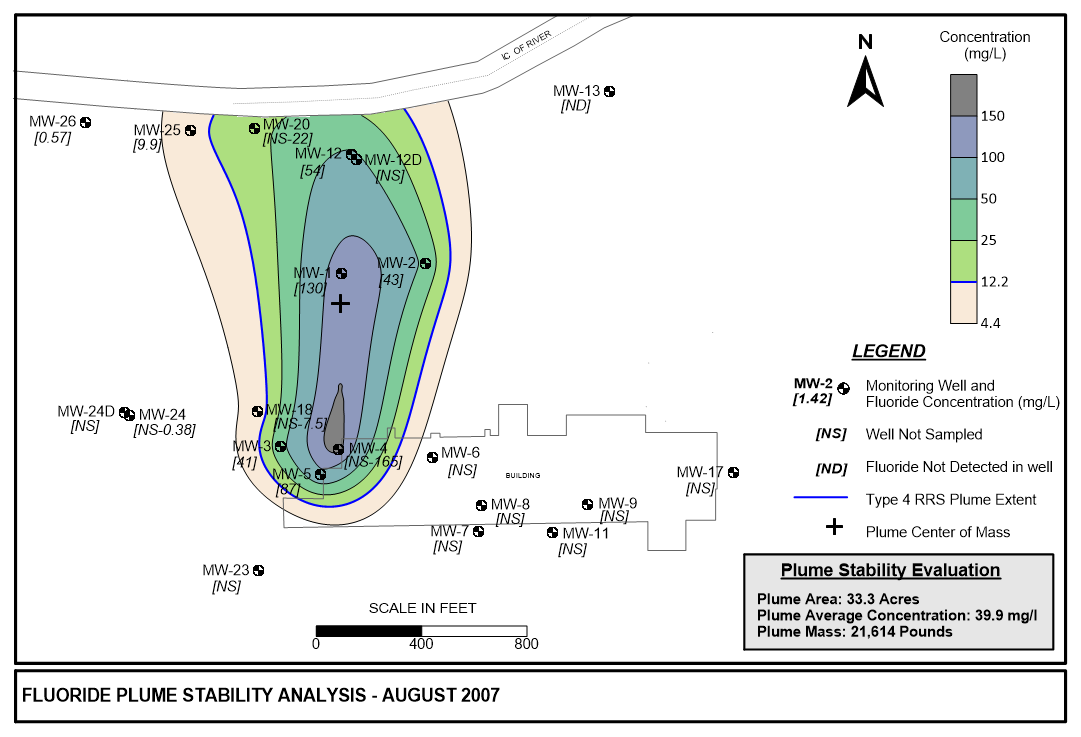
The Ricker Method for plume stability analysis helps engineers communicate meaningful patterns in environmental data
- Mar 22, 2024|Golden Software|4 min
The latest Grapher release is engineered to enhance your workflows whether you’re a seasoned Grapher pro or a first time user.
- Feb 27, 2024|Katie Yoder|3 min
The latest version of Surfer adds 3D modeling functionality that include dynamic visualization tools and improved export and collaboration options.
- Feb 9, 2024|Katie Yoder|3 min
Zach Dickson, principal hydrogeologist, recently shared how he uses Surfer to model his site characterization and forensic analysis data.
- Sep 14, 2023|Golden Software|3 min
The latest version of Surfer adds 3D modeling functionality that include dynamic visualization tools and improved export and collaboration options.
- Jun 23, 2023|Golden Software|5 min
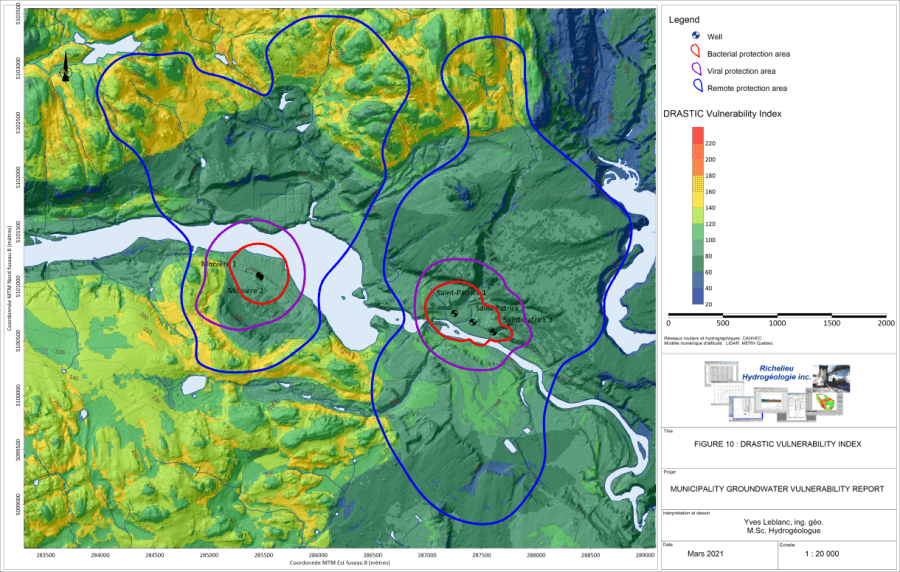
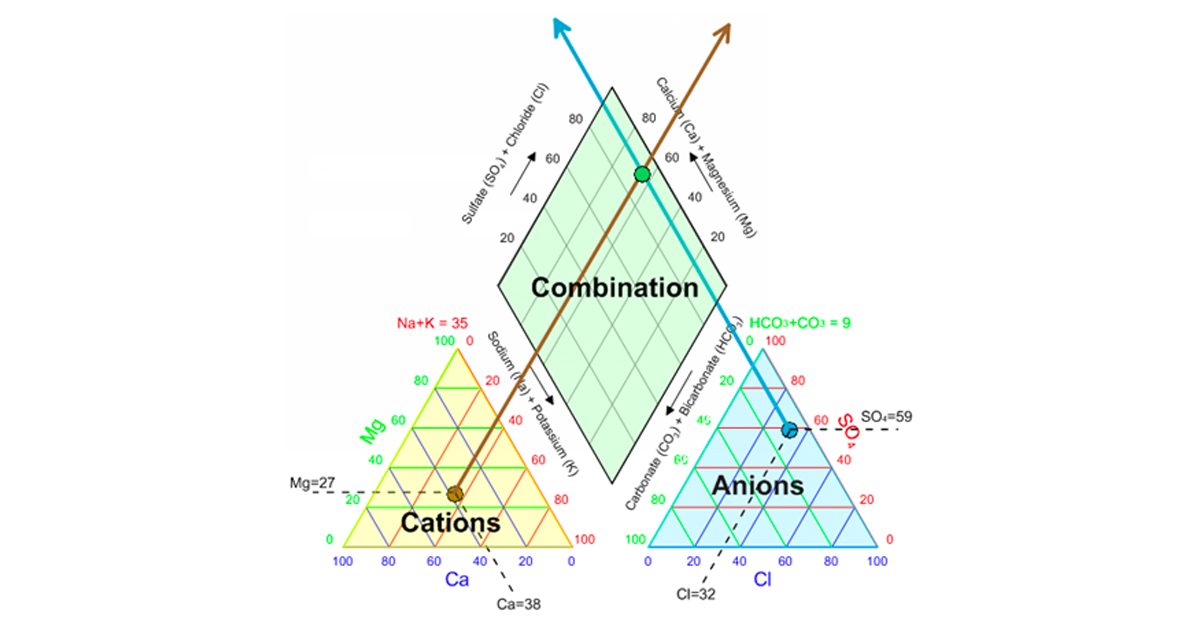
Being able to communicate water quality data is a key responsibility for hydrogeologists. This blog describes diagrams used to present water quality.
- Apr 12, 2023|Golden Software|4 min
Discover the top features scientists and engineers in the environmental industry should consider when choosing mapping software.